XAUUSD trade ideas

I expect a price jump in the short termI expect a short-term price rally.
Sellers' power has decreased.
Trading always involves risk - stick to your stop loss
X TRADER

down down xauusdxauusd down side view xauusd can fill fvg then fall after touching 0.5 fivonachi level and fall on down side when retailer buy there up and market trap all sl and fall down side.

XAUUSD | GOLD | 12-May-2025 | 9:50 PM ISTBearish Continuation
If price stays below 3265–3280 and continues downward momentum:
Target 1: 3200
Target 2: 3150
Target 3: 3080
Short-Term Pullback
If price holds above 3230 and breaks above 3280:
It could revisit 3340, then face strong resistance at 3420


[XAUUSD] Daily Analaysis 12 - 13 May 2025Continuing my mapping in the previous post, H4 GOLD turned out to be stronger and brought GOLD down to support 3195 - 3238. Of course, today's large decline will be followed by a fairly high correction as well. Anticipate GOLD which will correct to the previous low at 3282.
With the confirmed downtrend pattern, the SELL Area 3262 - 3290 is worthy of our SELL position again.

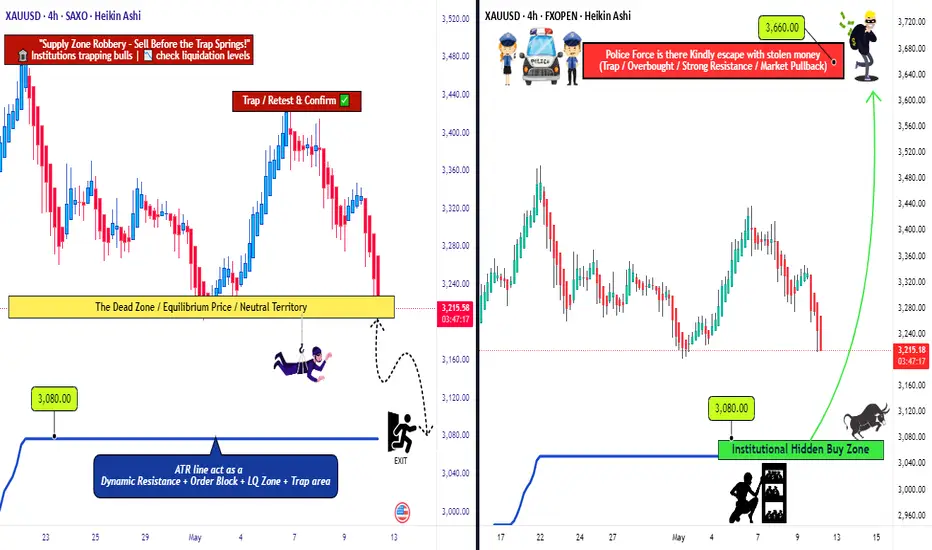
Golden Opportunity: XAU/USD’s Bull & Bear Heist Strategy!Hello Money Makers & Market Bandits! 🤑💰✈️
Get ready to raid the XAU/USD Gold Market with our cunning Thief Trading Style, blending sharp technicals and deep fundamental insights! 📊🔥 Our plan? Strike with precision on both bullish and bearish moves, grabbing profits before the market turns. Let’s outwit the charts and stack that gold! 🏆💸
📈 The Gold Heist Plan
Entry Points 🚪:
🏴☠️ Bullish Move: Wait for a pullback to the Institutional Hidden Buy Zone at 3080—your signal to jump in for bullish gains!
🏴☠️ Bearish Move: Watch for a breakout below the neutral level at 3200—time to ride the bearish wave!
Tip: Set alerts to catch these key levels! 🔔
Stop Loss (SL) 🛑:
Bullish Trade: Place SL at 2960 (4H swing low, Institutional Hidden Buy Zone).
Bearish Trade: Set SL at 3360 (4H swing high).
Adjust SL based on your risk, lot size, and number of orders. Stay sharp—this is your shield! ⚠️
Take Profit (TP) 🎯:
Bullish Robbers: Aim for 3660 or exit early if momentum fades.
Bearish Robbers: Target 3080 or slip out before the market flips.
Escape Plan: Watch for overbought/oversold signals to avoid traps! 🚨
📡 Why XAU/USD?
The Gold Market is in a bearish trend 🐻, driven by:
Fundamentals: USD strength from Fed policy, US growth, and tariffs.
Macroeconomics: US resilience vs. global economic weakness.
COT Data: Bearish speculative bets favor USD.
Intermarket: Rising US yields and equities boost USD, pressuring gold.
Quantitative: RSI and Fibonacci confirm bearish momentum.
🧠 Sentiment Outlook (May 12, 2025)
Retail Traders:
🟢 Bullish: 42% 😊 (Hoping for gold rebound on trade war fears)
🔴 Bearish: 45% 😟 (USD strength and improved US-China relations weigh)
⚪ Neutral: 13% 🤔
Source: Social sentiment & trading platform polls
Institutional Traders:
🟢 Bullish: 30% 💼 (Safe-haven demand amid geopolitical uncertainty)
🔴 Bearish: 60% ⚠️ (USD rally and higher concrete 5/12/2025)
🟢 Bullish: 30% 💼 (Safe-haven demand amid geopolitical uncertainty)
🔴 Bearish: 60% ⚠️ (USD rally and higher yields suppress gold)
⚪ Neutral: 10% 🧐
Source: COT reports & institutional flows
⚠️ Trading Alert: News & Risk Management 📰
News can shake the market like a storm! Protect your loot:
Skip new trades during major news releases.
Use trailing stop-loss to lock in profits and limit losses.
Stay vigilant—volatility is our playground, but only with a plan!
💪 Ride with the Thief Trading Team!
Hit the Boost Button to power up our Thief Trading Style and make this heist epic! 🚀 Each boost fuels our squad, helping us plunder profits daily. Let’s conquer the XAU/USD market together! 🤝
Stay tuned for the next heist! 🐱👤 Keep your charts ready, alerts on, and trading vibe high. Catch you in the profits, bandits! 🤑🎉
#ThiefTrading #XAUUSD #GoldHeist #TradingView #StackTheGold
Daily live trade with XAUUSD in 15m/30m/1h 20250512Daily live trade with XAUUSD in 15m/30m/1h 20250512


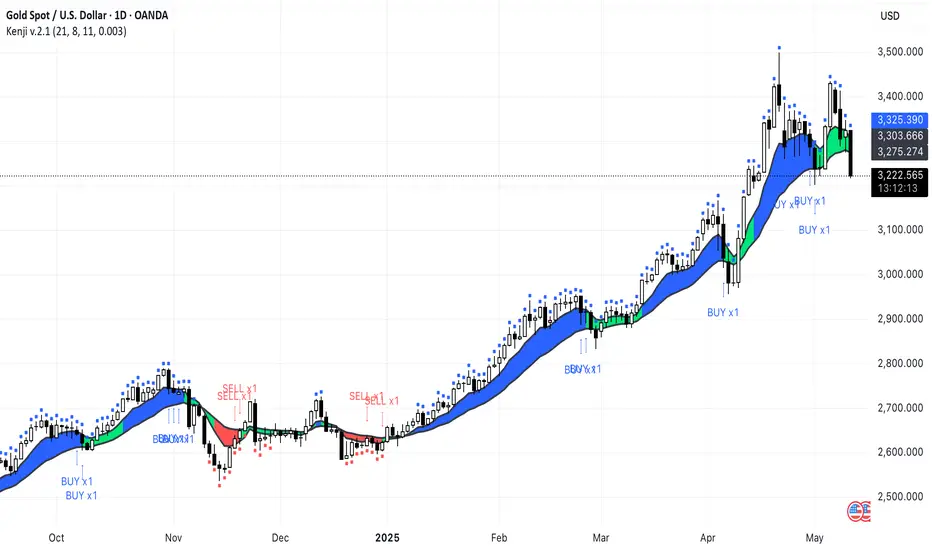
Gold is Booming: Time to BUY (Part 1/4)War, Uncertainty and Safe-Haven Demand
Gold is on fire.
+15% in 2023
+35% in 2024
+35% again — just in the first 4 months of 2025 (!)
Now trading near all-time highs: $3500
What’s driving the rally?
Global tensions:
China–Taiwan
Iran/Hamas–Israel
Russia–NATO
India–Pakistan
All on the edge of escalation. This fuels demand for safe-haven assets .
Trade Wars 2.0:
— US hits China with 145% tariffs
— China retaliates with 125% tariffs
— US GDP down -0.3% in Q1 2025
Uncertainty = more demand for gold.
We've seen it before:
In 2018, trade wars triggered a long gold rally.
From 2018 to 2020 → Gold +100%
Target: $4000–5000 is on the table.
Gold price plummets: current pressure level is 3300-3310Gold price plummets: current pressure level is 3300-3310
News:
• Negative factors:
1: High-level economic and trade consultations between China and the United States were held in Geneva, Switzerland, and substantial progress was made. The two sides agreed to establish a Sino-US economic and trade consultation mechanism. The market expects that the tariff war will end soon, and the demand for risk aversion has cooled significantly, leading to a drop in gold prices.
2: The Federal Reserve's May resolution emphasized that "inflation still needs to be observed", and the probability of a rate cut in June fell to 65%. The US dollar index stabilized at 100.3, which suppressed the attractiveness of gold.
3: In addition, the comprehensive ceasefire between India and Pakistan, Trump's announcement of a ceasefire agreement with the Houthi armed forces, the cooling of geopolitical risks, and the recovery of market risk appetite are also unfavorable to gold.
Support factors:
1: Gold prices triggered short-term buying in the range of US$3260-3275, and there is a need for technical oversold repair.
2: The People's Bank of China has increased its gold holdings for 6 consecutive months. In the first quarter, global central banks net bought 244 tons of gold, and the long-term logic of de-dollarization has not changed.
3: The US GDP shrank by 0.3%, inflation was high (the expected CPI was 3.5%), and the risk of stagflation was looming. The anti-inflation property of gold was favored by institutional funds.
Technical analysis:
Gold opened lower and fell today, and once fell by 50 points. The decline narrowed after the opening of the Asian session, but the technical short trend of gold remained strong. The gold price fell below the support level and is expected to fall back. Today's operation considers rebound shorting as the main, and low-level longs as the auxiliary, and pay attention to the resistance of 3310-3330 US dollars above.
Shorting suggestion: shorting near 3290-3288 above, stop loss 3300-3310, take profit 3270-3265-3250-3225;

GOLD 4.000Ok then big GAP Thankfully I do never keep open Gold positions on weekends
This is what I can see
sell from 3305 to 3245
buy from 3245 to 4.000
GG
How to read the opening price of goldAs for the daily chart, the market surged on Monday and Tuesday, plummeted on Wednesday and Thursday, and ended in shock on Friday. The bulls and bears were tug-of-war and refused to give in to each other. The short-term news is relatively complicated. Market sentiment follows the news. It surges when it is slightly nervous and plummets when it is appropriately relaxed. There are certain risks in short-term operations, and the volatility is large. Maintain two principles. First, do not chase gains and sell losses; second, reduce positions. There are opportunities in the market at any time. If there is news on the weekend, it will inevitably impact the market next week. Gold will still be violently swept for the time being. It is expected that this will be the norm throughout May. As time goes by, the weekly MA10 gradually moves up. This position will be the focus of attention in the later period. The biggest retracements in the past were all based on this support. Any large downward adjustments are opportunities for long positions. On the whole, the short-term operation strategy for gold next Monday is to focus on long positions on pullbacks and short positions on rebounds. The short-term focus on the upper side is the 3370-3410 resistance line, and the short-term focus on the lower side is the 3310-3315 support line.

[ TimeLine ] Gold 5-6 May 2025📅 Today is Friday, May 2, 2025
📌 Upcoming Signal Dates:
May 5, 2025 (Monday) or
May 5 & 6, 2025 (Monday & Tuesday)
🧠 Trading Plan & Notes:
✅ Gold has undergone a significant reversal of over 2000 pips, from its ATH of 3500 down to 3200
⚠️ If the upcoming Hi-Lo range is wide, consider reversal entries or setups based on Fibonacci retracement levels
✅ I will personally be trading both signals as part of my research and ongoing strategy
⚠️ If you're risk-averse or uncertain, it’s okay to skip the May 5–6 signals
📋 Execution Plan:
🔹 Wait for the price range from the selected candles to fully form (marked by green lines on the chart)
🔹 Entry will be triggered upon breakout, including a 60-pip buffer
🔹 If SL is hit, cut/switch and double the position on the next valid setup for potential recovery
📉📈 Chart Reference:
🔗 Copy & paste this code into TradingView URL: TV/x/C5zZyXar/

SHORT On Gold m30you can have a good short on xauusd. in a support area. a hidden divergance. regular time divergance and ... its good time to have a sell position

GOLD → sideways fluctuations. Will it break the resistance levelNews summary:
US President Trump announced a trade agreement with the UK, which raised hopes of reaching such an agreement with other countries, eased market tensions, suppressed gold's safe-haven buying, and the rise in the US dollar, US stocks and US bond yields also suppressed gold prices. US Treasury Secretary Bensont and Trade Representative Greer will talk with China's top economic officials in Switzerland in the near future.
Quaid reminds everyone that market concerns have not completely dissipated, and it is necessary to pay attention to the support of bargain hunting. The European Commission said earlier that if negotiations with Washington fail to cancel a series of tariffs imposed by US President Trump, the EU is considering taking countermeasures against US imports worth up to 95 billion euros. Close attention needs to be paid to news related to the international trade situation and changes in market sentiment during this trading day.
Support level analysis:
3310-3300 US dollars/ounce: 3300 US dollars is a psychological barrier and technical support for the confirmation of the previous price retracement. If it falls below 3300, it may fall to the 3280 US dollar area.
Resistance level analysis:
3360-3375 USD/ounce: Gold is currently above the convergence and oscillation range. 3360-3375 USD is the high pressure level of the previous day's box consolidation. If it breaks through this position strongly, the upward space will open up.
Technical analysis:
Gold is in a high-level oscillation and convergence range. The 4-hour MACD indicator shows that the short-selling momentum is weakening, but the hourly chart shows that the price is still constrained by the downward trend line. If gold prices stabilize at $3,300, it may trigger a rebound to $3,350-3,360; if it falls below $3,280, it may accelerate the downward trend. if it falls below 3280 USD, it may accelerate the downward trend.
Operation strategy:
Bull strategy: Long at 3315-3325 USD, stop loss at 3305 USD, target position at 3350-3360 USD.
Short strategy: short at $3365-3375, stop loss at $3380, target position at $3330-3300.

Daily Analysis: 09‑05‑2025Spot gold closed yesterday with a 1.75% loss, settling at 3,306, following the announcement of a trade agreement between the United States and the United Kingdom. President Trump also stated that significant trade talks with China are expected to take place at the end of the week, with a potential 145% reduction in tariffs—developments that could impact the markets and increase volatility at the start of next week.
This morning, gold is showing a slight upward bias, though price action for the remainder of the day is likely to remain sideways and limited.
Technically, the levels of 3,334 and 3,360 are seen as potential resistance, while 3,310 and 3,287 act as key support levels in case of a pullback.

Gold will Dump.Xauusd Gold will be bear
Use proper management.
Look for good entry.
Put stop loss down of entry
Move your stop loss to entry when you are in small green (Profit).

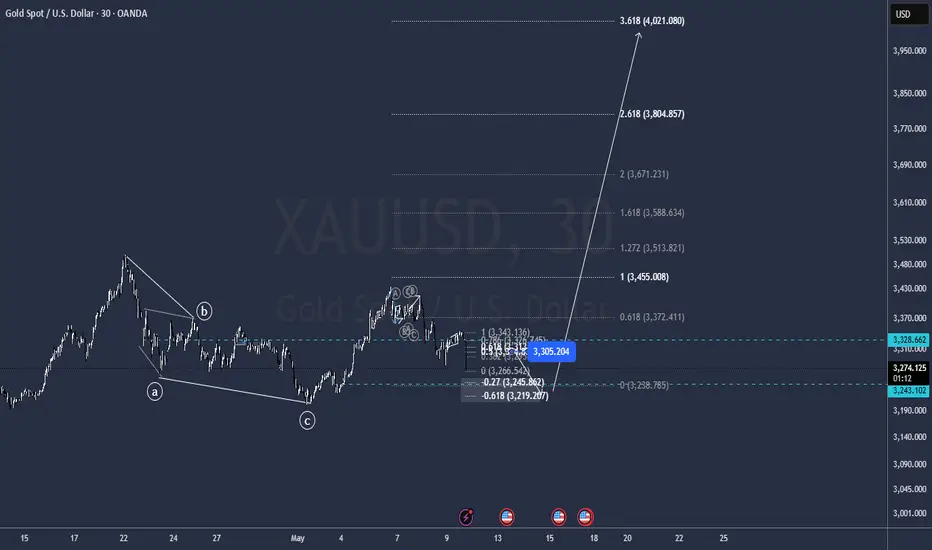
Wave pattern XAUUSDAfter a ABC correction I expect to see price rise again to complete wave five.
Keep your eyes in a good risk and management, use support level as entry points.
Follow and like so we can keep provide good analyses.

XAUUSD TO RETEST ALL TIME HIGH?After that we saw a correction, I expect that the main trend resumes.
I take 20 to 40 pips in each order.
Today is last week day take caution and keep your eyes in a good risk and management.

xabcd on gold
After the strong move bullish on 6 may yesterday
gold is obviously move to D point based on XABCD pattern
in my oppinion for this day gold will be bearish.
i might be trade for intra just to make sure my strategies.
Target for XAUUSD ; 3.328

Gold prices pulled back. Will prices continue to fall?Latest news: Trump announced a trade deal with the UK, which boosted market risk appetite; coupled with a sharp rise in the US dollar and US bond yields, gold prices plummeted in the Asian morning trading session.
US President Trump and British Prime Minister Starmer announced a "breakthrough agreement" on trade, which made market traders predict that the United States would also reach such an agreement with other countries. This prediction has made market buyers lose motivation.
Quaid believes that if the United States and China reach an agreement, gold prices will face great resistance to rise, and gold prices should fall back to $3,200/ounce.
Market trading analysis:
The upward trend of gold paused and started a sharp decline.
As described by the RSI, buyers are losing momentum. This is not good for gold, and the price has now fallen below $3,300/ounce. Quaid believes that it will continue to fall and may fall to the cycle low of $3,202/ounce.
Short-term trading strategy:
Short at 3280, stop loss at 3290, and take profit at 3260.
Quaid believes that if the price of gold falls below the downward resistance level of 3275, you can continue to hold your position and choose the right time to trade.
