XAUUSD – 1h Fib Premium Rejection Setup + Liquidity Sweep📉 XAUUSD SHORT SETUP – May 8, 2025 | SMC Confluence Mastery
Gold is showing a high-probability short scenario off a premium Fib retracement zone with rejection from key structure and Smart Money reversal patterns.
Here’s why this 1h setup could be the next sniper entry for Chart Ninjas:
🧠 KEY CONFLUENCES IN THIS TRADE:
🔺 Entry in Premium Zone: Price retraced into 70.5%–100% zone and rejected cleanly
🧊 Liquidity Above: Engineered buy-side liquidity was swept before reversal
📉 Bearish Order Flow: Consecutive lower highs + break of structure (BOS)
🛠️ Entry at 78.6% zone (~$3,416.99), stop above swing high
🕳️ Targeting Deep Discount: TP at ~-62% Fib level, near $3,262.01
🚨 Risk-Reward: Approx. 1:4.5 RR — clean structure with low risk
⚙️ Trade Execution Strategy:
Look for rejection candles / breaker blocks in the 78–100% zone
Set SL just above the swing high (~$3,420)
Target full imbalance fill into deep discount zone
Manage with trailing stop after price hits 0% or -27%
📊 Setup Summary:
Timeframe: 1H
Bias: Bearish
Entry: Premium Fib Rejection
TP: -62% Fib Extension
SL: Above 100% level
RR: 1:4.5+
Confluences: Fib, Liquidity Sweep, BOS
💬 Chart Ninja Insight:
“Smart money never sells lows or buys highs. They sell where liquidity is hiding—just like this.”
XAUUSD trade ideas

XAUUSD GOLD - CLEAN SETUP FOR SHORT. XAUUUSD 1D TF
Gold is looking for correction and seems to follow technical EMAs.

Gold Long – Patience Paid OffBeen stalking this setup all session…
Price swept 30M liquidity and gave that clean CHoCH. I locked in once 5M confirmed with a juicy liquidity grab + OB mitigation. Classic SMC flow—no rush, just precision.
This is that type of move where you sit back and let the market come to you.
Entry locked, targeting those 30M highs.
Let’s ride this wave.
#XAUUSD #Gold #SMC #SmartMoney #Forex #Liquidity #OrderBlock #CHoCH #DayTrading #FundedTraderGrind
Bless Trading!


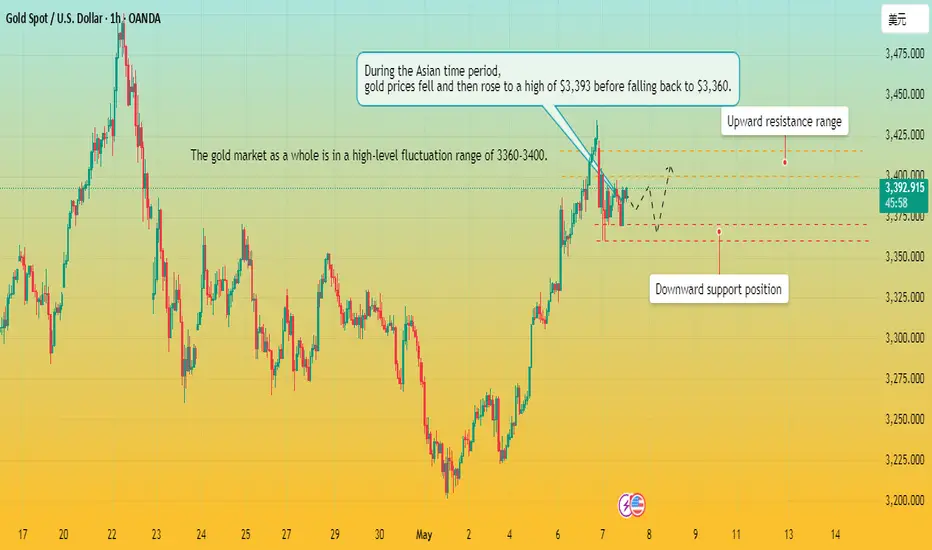
Gold operating range oscillation: 3360-3400Gold operating range oscillation: 3360-3400
Current market dynamics:
Geopolitical risks subsided, and the Asian market implemented the policy of reducing reserve requirements and interest rates: gold prices fell sharply by $70 to 3360 during the day.
Risk of the Fed's decision: The interest rate decision in the early morning is the core variable.
No interest rate cut or a tough statement may suppress the gold price to 3320-3300;
Unexpected interest rate cuts or dovish signals may push the gold price to rebound above 3430 points.
Key technical points:
4-hour chart:
Resistance level: 3436 points (78.6% Fibonacci retracement level), 3400 points (middle track pressure level).
Support level: 3386 (61.8% Fibonacci), 3350 (50% Fibonacci, key node).
Hourly chart level:
Range oscillation: 3400-3360, double bottom support at 3360 (lower channel rail), breaking through 3400 will open up the upside space.
Operation strategy:
1. Short-term short order:
Entry point: short near 3398, stop loss 3410.
Target: 3383 (initial support level), 3375 (lower edge of hourly line oscillation), final target 3360.
Logic: The market may remain cautious before the Fed's decision. If the 3400 resistance is effective, the technical retracement will be effective.
2. Long layout conditions (need to wait for confirmation):
Hold the 3360 double bottom, and go long with a light position after stabilization. The stop loss is set below 3350, and the target is 3400+.
Logic: If the Fed releases easing signals, technical resonance may trigger buying.
3. Breakthrough follow-up strategy:
Break above 3400: chase long, stop loss 3380, target 3430-3450.
Break below 3350: chase short, stop loss 3370, target 3320-3300.
Summary:
Gold is at a critical node of the game between technical aspects and news aspects.
Short-term recommendation is to focus on high-altitude below 3400, but be wary of unexpected reversals caused by the Federal Reserve.
Prudent people can wait and see for the time being, and intervene after the trend becomes clear after the decision.
If the price fluctuates rapidly, give priority to protecting the principal and avoid carrying orders.
Gold bides its time. Bulls are suppressed at high levels?
Gold is waiting for the Fed's interest rate decision.
analysis in Asian time period:
Gold opened with a sharp drop due to international news, and continued to fluctuate at a high level in the 3360-3400 range predicted by Quaid. I predicted in the early Asian session that the price of gold would rise to around 3390 and then fall back to around 3370-3360. And its trend is just as Quaid predicted and analyzed, with a correction after the predicted high point.
Now it seems that gold has fallen into a high-level fluctuation range after a sharp drop in the early Asian session, which is in line with my expectations. Quaid believes that the trend direction of the European session is very important. The current upward suppression range is between 3400-3415, and the downward support level is between 3360-3370;
On the contrary, if the European session falls below the downward support range, it may continue to fall.
But Quaid believes that the overall upward trend of gold prices has not changed. Gold prices are just accumulating strength now, and will continue to rise after the adjustment.
Overall trend analysis:
Quaid recommends that the long strategy is still the main one. If the support range of 3360-3370 can resist the downward trend, then we can still carry out the long strategy after the price falls back.
Operation strategy:
Long strategy: Go long when the price falls back to 3365, stop loss 3350, take profit range 3400-3415.
Short strategy: Go short at 3395, stop loss 3405, take profit 3360.
XAUUSD bounce?Hello traders, this is a complete multiple timeframe analysis of this pair. We see could find significant trading opportunities as per analysis upon price action confirmation we may take this trade. Smash the like button if you find value in this analysis and drop a comment if you have any questions or let me know which pair to cover in my next analysis.

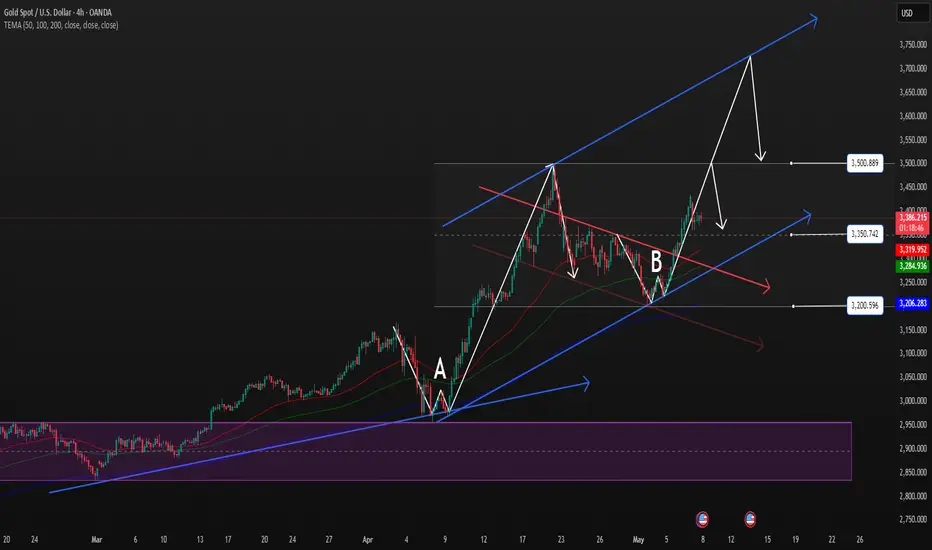
Gold Trend Analysis – Potential Movement ForecastThe recent price action suggests a potential turning point in gold’s trend. While the market has maintained an ascending trajectory , the latest pullback introduces a level of caution. The structure remains intact within the trend channel , but the rejection near resistance indicates that bullish momentum may be cooling off.
Key price zones such as 3800.796, 3549.659, and 3238.064 will be decisive in determining the next movement. If buyers defend these levels, a rebound towards higher resistance is likely. However, a break below support could accelerate a deeper correction.
Market sentiment currently leans towards buy-side accumulation , as marked across the chart, yet a confirmation signal from price behavior is required before engaging further in longs. Managing risk effectively in these conditions will be crucial to navigate the upcoming price movements.

Still in upside channel H1 & H4 updated
Market still in the parallel channel
What possible scenario we have?
Bearish scenario:
-if h4 remains below 3375 stay bearish side and target will have 3330- 3290
Bullish scenario:
-if market able surpass 3385 and (candle closes above)then buying up to 3430 and 3445
Key area:
-3385 (above bullish)
-3370-3375( Below bearish)

GOLD BUY NOW!!!!!Gold made a strong rejections off the VAH level price is heading for new highs am still targeting 3,500 still buy only

Gold price breaks through 3400. Bulls take control?Gold price breaks through the 3400 resistance level I predicted. And there is a trend of continuous rise.
Next, Quaid will comprehensively analyze the current market situation for all traders.
Technical analysis:
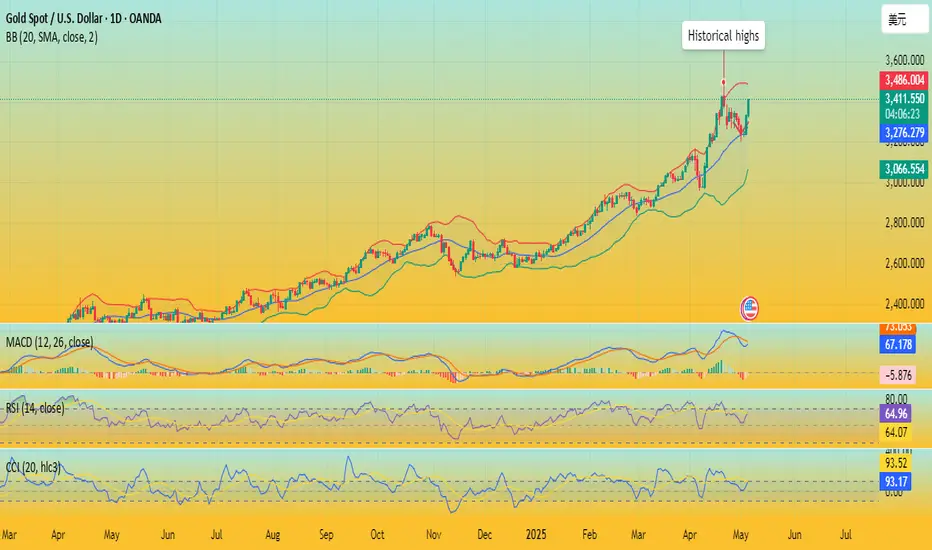
From the daily chart, the gold price has broken through the important resistance level and formed a strong upward trend. Currently trading above $3400, it has successfully broken through the key resistance range of $3385-3400. The Bollinger Band indicator shows that the middle track is at 3231.01, the upper track is at 3485.06, and the lower track is at 2976.97, indicating that the current price is near the upper track of the Bollinger Band, showing strong upward momentum.
The RSI indicator shows that the current value is 64.8, which is in the neutral to strong area, and has not yet reached the overbought level, and there is still room for growth.
Quaid believes that in the short term, if gold stabilizes above $3,400, it may hit $3,430-3,450. Once it breaks through, it will open up the possibility of a higher price.
Market sentiment observation:
The current market sentiment is clearly biased towards risk aversion, and global geopolitical tensions have become the main driving force for gold to rise. The continued tension of geopolitical conflicts and political uncertainty in Germany have prompted market participants to seek safe assets. At the same time, expectations for the Fed's future monetary policy shift are also increasing. Although the possibility of a rate cut in May is extremely low, the probability of a rate cut in the June meeting is close to 30%.
Liquidity indicators show that the trading activity in the gold market has increased and institutional funds continue to flow in, indicating that bullish sentiment in the market has the upper hand in the short term. Technical indicators have not shown obvious overbought signals, which means that the current rally still has room to continue. Compared with other asset classes, gold's relative strength is outstanding, especially in the context of the possible challenges to the status of the US dollar as a safe haven asset.
Outlook for the future
In the short term: Gold prices may continue to rise to test the $3,400-3,500 area. The Fed's decision will be a key trigger for gold prices in the near term. If the Fed shows a dovish attitude, gold prices are expected to further break through historical highs.
Medium term: Global geopolitical uncertainty is expected to continue to support gold prices. If geopolitical conflicts escalate further or the situation in the Middle East deteriorates, safe-haven demand may push gold prices to hit the $3,600 level. At the same time, market expectations of a shift in the Fed's monetary policy will be another key factor affecting gold prices.
Long term: From a macro perspective, the current combination of slowing global economic growth and geopolitical tensions will continue to provide support for gold.
GOLD- alternate scnerios, what's next??#GOLD.. market behave volume drop above 3387
So again our area is 3381-87
And we will go for CUT n reverse below
Good luck
Trade wisely
Gold Eyes $3,418 as Bullish Channel Holds Gold (XAUUSD) Analysis – May 6, 2025
📈 Technical Outlook: Gold Eyes $3,418 as Bullish Channel Holds
Gold continues to trade within a rising channel on the 30-minute chart, with price currently near the mid-range around $3,373.
Two likely scenarios:
Bullish breakout toward $3,418 if minor resistance fails.
Or a healthy pullback to $3,360–$3,345 support zone before resuming upward.
Support levels: $3,370 (minor), $3,345 (strong).
Resistance: $3,418, a key decision zone at the channel top.
Short-term bias: Bullish, unless the price breaks and closes below $3,345.
🔍 Headline: “Gold Holds Above Key Support, Eyes Fresh Highs Toward $3,418 Within Bullish Channel”
🌍 Fundamental Outlook: Gold Supported by Fed Dovishness & Geopolitical Tensions
Fed Policy Watch: Traders anticipate potential rate cuts later in 2025. Any dovish commentary this week will boost gold.
U.S. Dollar Pressure: A softening dollar adds tailwind to gold prices.
Bond Yields: Moderating U.S. Treasury yields reduce gold’s opportunity cost.
Safe Haven Demand: Ongoing tensions in Ukraine, Middle East, and uncertainty in global equities maintain demand for gold.
Central Bank Buying: Continued accumulation by central banks (e.g., China) lends structural support.

GOLD PLAN UPDATE 06/05/2025 - 2PM UTC• Gold surges to $3,38x/oz on dovish Fed bets, geopolitical risks, and safe-haven demand.
• Fed pivot hopes fuel upside as weak data boosts rate cut odds.
• U.S.-China trade tensions and Middle East unrest lift safe-haven flows.
• Weaker USD adds support; central banks continue strong buying.
• Growth and inflation fears keep gold bid.
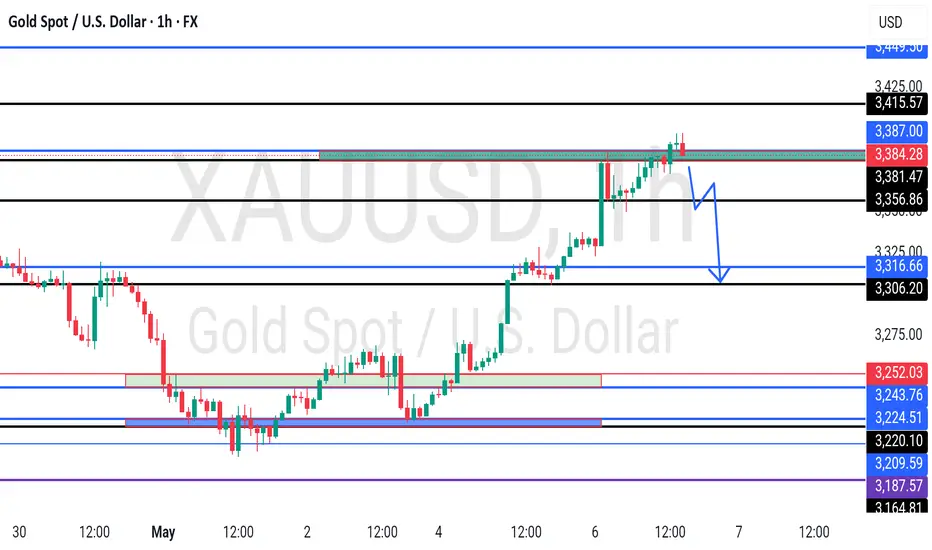
🎯 Key Levels:
• Resistance: $3,400–$3,420
• Support: $3,300–$3,310
🟢 Buy Zone 1: $3,355–$3,360
- SL: $3,350
- TP: $3,380–$3,385
🟢 Buy Zone 2: $3,300–$3,320–$3,330–$3,340
- SL: $3,320–$3,280
- TP: $3,390–$3,400–$3,450–$3,500
🔴 Sell Zone 1: $3,395–$3,400–$3,410
- SL: $3,405–$3,420
- TP: $3,370–$3,365–$3,350–$3,340
🔴 Sell Zone 2: <$3,300
- SL: $3,320
- TP: $3,250–$3,200
• Use tight stop-losses tailored to timeframe (5–10 prices for scalping; 20–30 for intraday/swing).
• Limit risk per trade to 1–2% of account equity.
• Stay alert to real-time Fed commentary, tariff news, and geopolitical headlines for sudden volatility spikes.

Gold 3386 is under pressure, don't worry
Gold rose rapidly today. At present, the price of gold has reached the 3386 line. There will be pressure to fill the gap and choose to bear the pressure.
Now that gold is adjusting and falling at 3386, don't rush to gamble and enter the market. Wait for time + point + harmonious position. The market will find support in an effective time. Now the effective support point of gold is about 3346/36. The price fluctuates violently. It is recommended to take a stop loss in time after entering the market to avoid a sudden accident in the market and cause unnecessary losses. Today's rising cycle can be seen in the 3400/3420 range. On the downside today, if the market changes and recovers the opening price, just wait and see. This kind of market is unlikely to occur, but if it occurs, you have to wait and see and don't be stubborn in your thoughts.
Market contradictions and potential risks:
Fed policy expectations: The market's probability of a rate cut in June has dropped to 37%. If the Fed releases hawkish signals this week, it may suppress gold prices.
ETF holdings diverge: Despite the rise in gold prices, the world's largest gold ETF (SPDR) holdings decreased by 4.87 tons, reflecting that some institutions sold off their holdings at high prices.
Geopolitical variables:
Middle East conflict escalates: If the friction between Iran and Israel intensifies, gold may hit $3,450; on the contrary, if the situation eases, the gold price may fall back to $3,300

XAUUSD – The Setup’s Already BreathingFlipped to the 15M so they don’t see the precision… but this is 5M business.
IDM below that HH is baiting price back in—liquidity needs to get swept.
Once the zone’s kissed, I’m hunting the micro LH to get smoked.
The move’s already loaded… just waiting on the trigger.
They watching. I’m waiting. That’s the difference.
Bless Trading!

Gold’s Got Its Groove Back: Morning Star Lights the Way to $3500Gold delivered a powerful signal pointing to a resumption of the bullish trend, completing a morning star pattern that saw it break out of the falling wedge it had been trading over the past fortnight. It would have been nice to catch the initial move, but all is not lost after the price broke above $3367 on Tuesday.
The price has run hard, so I’m reluctant to chase the move. But if we see a pullback and bounce from $3367, it would generate a bullish setup where longs could be established above the level with a stop beneath for protection. The obvious trade target would be the record high of $3500 set in April.
If the price were to reverse below $3367 and stay there, the setup would be invalidated.
Good luck!
DS

Buy GoldGood buy for retrace at 3345 area then a drop continuation; if not then we could possibly see a Double Top.

Upwards pullback Gold may pullback to the upside, after finding some stability above 3220 barrier. If it remains above 3220, a upward correction is possible. Simultaneously, the commodity has been facing bearish pressure as from last week, and if price action settles beneath 3220, a correction down may continue.

Gold is trading sideways, can the bearish trend continue?🗞News side:
1. China-US trade relations eased, suspending some tariffs and countermeasures
2. Russia and Ukraine suspended firing for 30 days, and the India-Pakistan conflict was temporarily mediated
📈Technical aspects:
The trading strategy given today, if brothers have reference and follow the trading strategy to participate in long orders, I think you should all have good gains on hand. At present, gold is in consolidation, the 4H moving average is in a short position, and the MACD dead cross continues to increase, so the short-term short momentum still exists. From a technical point of view, in the downward trend from last week's high of 3347 to the current low of 3207, 3260 is at a key position. Therefore, we pay attention to the possibility of gold rebounding to 3260 in the evening.
If you agree with this view, or have a better idea, please leave a message in the comment area. I look forward to hearing different voices.
OANDA:XAUUSD FX:XAUUSD TVC:GOLD FXOPEN:XAUUSD FOREXCOM:XAUUSD

Today, gold fluctuated at a low level after its declineAfter the opening gap down to around 3275 on Monday, it rebounded to around 3292 at its highest and then started the downward trend. By the afternoon of Monday, gold touched around 3207 at its lowest and then fluctuated upwards. Yesterday's analysis was largely in line with the market trend. Through the observation and judgment of the market, with the strategy of combining long and short positions, the entry timing was quite good, and the trading results were also satisfactory. 👉👉👉
Judging from the current trend of gold, pay attention to the support level of 3215-3220 below. Focus on the support at the level of 3200. Regarding the resistance above, pay attention to the short-term suppression at the level of 3270-3280, and the strong resistance is around the 3300 mark.
In terms of operation, the main strategy is to go long on the pullback. At intermediate positions, it is advisable to observe more and trade less. Be cautious about chasing orders and patiently wait to enter the market at key price levels.
XAUUSD trading strategy
buy @ 3215-3220
sl 3200
tp 3230-3240
If you approve of my analysis, you can give it a thumbs-up as support. If you have different opinions, you can leave your thoughts in the comments.Thank you!👉👉👉

Gold (XAUUSD) Daily Analysis -3646$Gold (XAUUSD) Daily Analysis – May 12, 2025
📈 Technical Analysis
🔹 Key Support Zone Holding:
Price is currently reacting at a confluence of Weekly and Daily trendline support, located near the $3,200–$3,220 area.
This zone is critical. As long as it holds, the bullish structure remains valid.
🔹 Bullish Continuation Pattern:
A falling wedge pattern (black trendlines) is forming, which is traditionally a bullish reversal pattern.
A confirmed breakout above the wedge could propel price toward the $3,646 resistance level.
🔹 Scenario Outlooks:
✅ Bullish Scenario (Primary Probability):
Price bounces from the support trendline.
Breakout above the wedge confirms bullish momentum.
Potential target: $3,646.
❌ Bearish Scenario (Contingency):
Breakdown below the $3,200 support area.
Price may retest the lower trendline of the ascending channel.
Potential downside target: $2,910.
🔹 Trend Structure:
The broader trend remains bullish, supported by the rising channel.
Pullbacks are healthy unless price breaks and closes below key structural support.
🌐 Fundamental Analysis
🏦 Federal Reserve Policy Outlook:
Recent Fed statements suggest a dovish tilt as inflation shows signs of cooling.
Any indication of rate cuts or a pause in hikes enhances the appeal of non-yielding assets like gold.
💵 US Dollar & Treasury Yields:
A weaker USD and declining yields support gold prices.
Watch for any shifts in dollar strength or macroeconomic data surprises.
🌍 Geopolitical Landscape:
Ongoing geopolitical uncertainties (e.g., Middle East tensions or potential conflict escalations) continue to fuel safe-haven demand for gold.
🏦 Central Bank Demand:
Continued strong demand from global central banks adds long-term support to gold prices.

XAU / USD 4 Hour Chart$3226.00 is the area to watch. I am watching the 4 hour and I peek at the 1 hour.. I need to see a break and close above and if a retest is successful, I would try to catch it from there. I am not trying to force or rush a trade. I can also see gold pushing down over the next few weeks to my area of inters marked on the chart. Patience is key. Big G gets all my thanks. Happy Monday.
