A larger corrective pattern is formingIn the previous analysis, a specific range was determined for the price to reverse, after reaching that price range, the price jumped upwards and the price grew by 1700 pips. However, considering that the structure of wave-c is not an impulse, the zigzag was not confirmed and it seems that a larger corrective pattern is forming.
It seems that the reverse contracting triangle pattern is forming, which is currently in wave-d of the triangle. With the completion of wave-d, we can better find the end point of wave-e.
XAUUSD trade ideas

XAUUSD: Strong Bullish (Intraday & Swing)Gold closed Friday with indecision, rejecting both 3230.00 and 3274.00 as NFP remained muted. That led to an explosive 936 pip candle yesterday, ripping straight through 3274.00 and closing just shy of the major 3333.00 level.
Today, price has already pushed 400 pips higher and is currently hovering around 3365 on the 4H chart.
Key Buy Setups:
Break above 3380 → Target 3428
Pullback & successful retest of 3333 as support → Target 3428
Pip Range Opportunity:
500 – 900 pips depending on the entry
Summary: Bullish bias remains intact on all timeframes. I’m watching for a clean break of 3380 to ride the next leg up, or a healthy pullback to 3333 before continuation.

XAUUSD – Calm Before the LaunchMarked this IDM sitting under the HH with clean structure flowing bullish on 4H and 30M.
Flipped to the 2H for a smooth Bird’s Eye view—just watching now, waiting for that sweep and micro shift to load up.
The market’s breathing, building up energy. Once it taps in and confirms, it’s game time.
Let the liquidity do the work. I’ll handle the entry.
Bless Trading!

XAUUSDWe have two scenarios in the analysis: either a rise in the form of a trend, a staircase, or a deep correction and taking the buy zone. We wait for the deep correction of the market and taking the buy zone. However, if it rises in the form of a staircase, we will renew the entry, but in the event of any entry, geopolitical situations end the analysis and we analyze another analysis or another renewal.

XAUMO x Heikin Ashi Chikou Fusion Strategy (Full Calibration)
Timeframe-Synced Strategic Confluence: XAU/USD
⸻
5M + 15M (Trigger Zone)
• EMA/HMA/SMA Stack: All bearish — price below EMA21, HMA5 rolling down = trend aligned.
• Ichimoku Cloud: Below Kumo, flat Kijun — choppy bearish bias.
• Stoch RSI: Crossover from oversold — minor bounce brewing.
• Chikou Span (HA): Still below price = bearish lag.
• Volume: Weak green = bounce lacks conviction.
Conclusion: Micro bounce trap. Stay patient for SELL SIGNAL from higher TF.
⸻
1H + 4H (Execution Timeframe)
• MA Confluence: Perfect bearish alignment (EMA21, SMA50/84/200 all above price).
• Ichimoku: Bearish TK cross, Chikou Span far under price (lagging confirmation).
• Stoch RSI: Just crossed from oversold on 1H — temporary pullback likely.
• MACD: Red, contracting — confirms bounce but no reversal.
• Fib Level: 61.8% & 78.6% = 3,260 - 3,275 resistance hot zone.
Conclusion: Perfect zone for sell trap. Wait for bounce toward Fib+MA confluence, then strike.
⸻
D1 (Trend Validation Layer)
• Chikou Span (HA): Bearish – lagging behind price, rejection at cloud = LONG-TERM SELL BIAS.
• Ichimoku Cloud: Price under cloud, future cloud bearish.
• Volume: Distribution spike from 3,500 = institutional sell.
• Stoch RSI: Near mid-zone = no help to bulls.
Conclusion: Downtrend intact. D1 confirms all signals. Time to hunt shorts.
⸻
Final Calibrated Hypothetical Trade Setup: XAU/USD (May 13, 2025)
Order Type: Sell Limit
• Entry: 3,263.00 (Fib 61.8%, SMA84 resistance, Chikou below)
• Stop Loss 1: 3,276.00 (Above SMA50 & Ichimoku Cloud)
• Stop Loss 2: 3,290.00 (Failsafe beyond Ichimoku Flat Kumo)
• Take Profit 1: 3,209.00 (Volume support, Fib minor)
• Take Profit 2: 3,183.00 (Daily Fib 100% AB=CD + institutional demand)
• Confidence Level: 91%
• Risk:Reward: 1:3.6
⸻
Execution Rules
• Only place order if Stoch RSI is above 80 on 15M/H1 at time of entry.
• Confirm Chikou Span still below Heikin Ashi price.
• Volume candle must not break upper band = no breakout.
⸻
Justification
This setup is the offspring of two powerful systems fused in battle:
• MA + Ichimoku + Fib give sniper zones.
• Stoch RSI and Chikou confirm killer timing.
• Volume shows us when the smart money exits — and we ride behind their smoke.
////////\\\\\\\
XAU/USD Tactical Kill Zones – Calibrated by Multi-System Fusion
////////\\\\\\\
1. RED ZONE – NO TRADE / TRAP AREA
Definition: Conflicting signals, exhaustion zones, or fake-out setups. Do not freaking touch.
• Price Above 3,290
• Overextended against higher timeframe trend.
• Chikou Span may cross price — invalidates bearish setup.
• FOMO-buyers get slaughtered here.
• Price Below 3,200 Without Breakout Volume
• Could be fake breakdown into accumulation.
• Stoch RSI may show oversold and HA reversal brewing.
• Potential for bear trap reversal.
⸻
2. YELLOW ZONE – WAIT & WATCH / REACTION ZONE
Definition: Transitional price zones. Wait for confirmation before engagement.
• Price Between 3,240 – 3,260
• Pullback rally zone. Price flirting with EMA21, SMA50, and Fib 61.8%.
• Stoch RSI climbing toward OB. Chikou still under price.
• Wait for Stoch RSI OB + HA candle rejection + volume spike for sell trigger.
• Price Between 3,209 – 3,200
• First support cluster.
• Watch for volume spike and RSI divergence. Decide whether it’s bounce or breakdown.
⸻
3. GREEN ZONE – HIGH PROBABILITY EXECUTION ZONE
Definition: Multiple timeframe confluence. This is where the kill shot is taken.
• SELL ENTRY ZONE (Green Box):
• 3,263 – 3,275
• Fib 61.8% – 78.6%
• SMA84, SMA50, EMA21 cluster
• Ichimoku flat Kumo rejection
• Chikou below price (Heikin Ashi candle)
• Stoch RSI must be OB with bearish crossover
• TP ZONE 1 (Green TP):
• 3,209 – 3,200
• Fib support + Volume support
• First liquidation level from sell pressure
• TP ZONE 2 (Green TP):
• 3,183 – 3,175
• Fib 100% AB=CD completion
• Strong volume absorption zone
• Potential D1 reversal point

XAUUSD Price Outlook – Bearish Setup in Play ??Asset Overview
The chart represents a price action analysis with support and resistance zones, along with EMA indicators (50 and 200), likely on a 4H or 1H timeframe.
Key Technical Levels
Resistance Zone: ~3,400 to 3,450
First Support Zone: ~3,230 to 3,250
Second Support Zone: ~3,090 to 3,130
Indicators
EMA 50 (Red): Currently around 3,340, acting as dynamic resistance.
EMA 200 (Blue): Positioned near 3,232, reinforcing the first support zone.
Price Action Insight
Price had a strong uptrend, peaking above 3,440 before pulling back.
A lower high may be forming, suggesting possible trend exhaustion.
The current bounce appears to be a retracement back toward resistance or EMA 50.
Projected Move (As Illustrated on Chart)
Short-term bullish move into the resistance zone (~3,400–3,450).
Failure to break above resistance leads to sharp rejection.
Price retraces to first support zone (aligned with EMA 200).
If support fails, deeper drop expected toward the lower support zone (~3,100).
Strategic Notes
📉 Bearish Bias if price fails to break above resistance.
🔍 Watch for bearish candlestick patterns or divergences near resistance.
🛡️ First support aligns with EMA 200, making it a critical level for bulls to defend.
🔻 Breakdown below 3,230 opens room for larger correction to 3,100–3,090.
Conclusion
Currently, the chart suggests a potential short opportunity if price confirms rejection at resistance. The EMA cross structure remains bullish long-term, but momentum is weakening, and failure to reclaim highs could shift sentiment bearish in the short to mid-term.

XAUUSD May 12 New York real-time trading strategy analysis.The normal plan is to trade in a unilateral falling market. However, Russia's negotiation agreement with Ukraine has not stopped. While the cashing sentiment has risen, the tax issues between the United States and China have declined. This is why the New York market continued to rebound to 3247 and then fell back to 3220.
If the price of the New York market cannot continue to break through the position of 3233 and stabilize. Then the price will continue to fall. The target is below 3190. There may be support at 3200, but it will not be too strong. But if the position of 3233 stabilizes and breaks through above 3348 again. Then we need to pay attention to the position of 3360-3375 again.

Gold Breaks Support Level – The Downtrend May Not StopAfter peaking at $3,500/ounce in April, gold is in a clear correction phase. On the H4 chart, the price has broken through both the EMA34 and EMA89, indicating that a short-term downtrend has been established. The most recent session closed at $3,223, losing nearly $130 in just a few sessions.
The sharp decline appeared after a long rally and the peak was rejected many times. The break through the EMA89 support has triggered technical selling pressure, reflecting the psychology of profit-taking after failing to surpass the old peak.

XAUUSD - Is Gold Going Down?!Gold is trading in its descending channel on the four-hour timeframe, between the EMA200 and EMA50. A downward correction in gold will open up buying opportunities from the demand areas.
Investors in the precious metals market witnessed another week of gold’s strong performance. Although overall optimism about a potential reduction in trade tariffs slightly slowed gold’s momentum, robust demand from Asia and other global regions provided solid support, preventing any major market correction.
At the beginning of the week, gold prices fell by over 1% on Monday as news of a trade agreement between the U.S. and China prompted investors to shift toward riskier assets. This drop occurred alongside easing geopolitical tensions between India and Pakistan, which also contributed to a calmer market atmosphere.
U.S. Treasury Secretary Scott Bessent and Trade Representative Jamison Greer announced that the two nations had reached an agreement during negotiations in Geneva, Switzerland. The deal, which is expected to be released as a joint statement, signals a reduction in trade tensions that had escalated in recent weeks with tariffs reaching as high as 145% on Chinese imports.
As part of the agreement, the U.S. and China plan to establish a joint economic and trade consultation mechanism to continue discussions on tariffs. President Donald Trump hinted last week at a potential reduction in tariffs to 80%, although the official details of the deal have yet to be disclosed.
Adam Button, Chief Currency Strategist at Forexlive.com, commented that in the current market environment, it is difficult not to be bullish on gold. However, he warned that any de-escalation in U.S.-China tensions could dampen the strength of gold’s rally. He added, “Even though a 50% reduction in tariffs wouldn’t be the final chapter, if implemented, it would represent fairly rapid progress and a positive sign for both parties.”
In addition to trade developments, the easing of tensions in Kashmir and a ceasefire agreement between India and Pakistan have also reduced demand for safe-haven assets like gold. The ceasefire, brokered by the United States, remained largely intact over the weekend.
Adrian Day, CEO of Adrian Day Asset Management, stated that his outlook on gold remains unchanged. He explained, “Rising concerns over a potential U.S. recession, coupled with cautious optimism about easing trade tensions—especially between Washington and Beijing—could exert pressure on gold. However, gold’s notable resilience against price declines indicates underlying demand that has not yet fully entered the market.”
Meanwhile, Darin Newsom, Senior Market Analyst at Barchart.com, firmly maintained a bullish view on precious metals. He said, “If I had to write one analytical sentence on the market board, it would be: Precious metals must rally. I emphasize ‘must’ because nothing is certain in the markets. My bearish call last week was wrong, and it’s clear that technical analysis has become almost obsolete—especially in today’s world where algorithm-driven trading dominates.”
After a week largely influenced by the Federal Reserve’s meeting and tariff-related headlines, market focus now shifts to a data-heavy week featuring a broad range of U.S. economic indicators. The action kicks off Tuesday with the release of the April Consumer Price Index (CPI), a report that could offer insights into whether the Fed might cut interest rates in its June meeting.
The real highlight, however, is expected on Thursday, when key reports are scheduled to be published, including the Producer Price Index (PPI), retail sales figures, jobless claims data, and two major regional indices—the Philadelphia Fed manufacturing survey and the Empire State manufacturing index. Amidst this flood of information, Fed Chair Jerome Powell is also set to deliver a speech in Washington, which could serve as a major catalyst for market movement.
To wrap up the week, markets await Friday’s release of the preliminary University of Michigan Consumer Sentiment Index for May—a report often viewed as a psychological gauge of American consumer behavior.

XAUUSD 12/5/25Following our change in bias last week on gold, we continued to follow the bearish narrative into new lows after taking out the highs we identified at the beginning of the week. Now, we're looking for a similar setup — a potential pullback into those previous highs to give us the shift downward we’re anticipating.
That said, I believe gold may have more potential to move directly into our target zones without a significant pullback. Still, we keep that scenario on the table, as it's part of the trading plans we build from these key levels.
Of course, we don’t expect price action to simply go bullish and hand us perfect shorting opportunities. But we do believe that if price pulls back into certain areas, it could continue to deliver the downside movement we’re expecting.
Remember, we’re following a rule set. We’re sticking to our risk parameters and allowing the system to guide us. We’re not trading just because price moved down — we had a clear understanding of what we wanted to see, and price continues to respect that structure.
Stick to your plan, follow your risk, and let Orion lead the way.
Orion is bearish, and so are we.
Trade safe. Stick to your plan. Always follow Orion.

GOLD 4HR BREAK AND CLOSE as earlier advised saw quick drop in price.the break of structure came for retest and selling.


GOLD next moveContinuation buy is likely from that entry point to target those highs. Trade with Prm

XAUUSD SIGNAL READ THE CAPTAINxauusd signal technical analysis satup 👇🏼
(xauusd) buy zone
( TRADE SATUP)
ENTRY POINT (3331) to (3333) 📊
FIRST TP (3340)📊
2ND TARGET (3350) 📊
LAST TARGET (3356) 📊
STOP LOOS (3323)❌
FALLOW RISK MANAGEMENT

XAUUSD | Bullish | Fib RetracementGold has given yet another breakout after a brief accumulation.It has made a good bullish engulfing candle as well at breakout.Mpreover Fib retracement tool is also indicating its bullish run.

XAUUSD Macro & Equity Market Overview:
Global equities are showing signs of fragility following a strong rally, with the S&P 500 down 0.8%, the Nasdaq 100 off 0.9%, and the Dow Jones losing nearly 390 points. Weakness was broad, with Russell 2000 (-1.1%) underperforming, indicating rising risk aversion toward small caps. The CBOE Volatility Index (VIX) spiked 4.7% to 24.76, reinforcing the shift to defensive positioning.
Key drivers include renewed concerns over Trump’s tariff rhetoric, which hit pharma and trade-sensitive sectors, and an apparent stall in momentum after a multi-session rebound. Fed rate expectations remain a key overhang — traders are waiting for the Federal Reserve’s next move while the U.S. 10Y yield holds above 4.31%, showing sticky long-term inflation expectations. Germany’s political instability adds to risk-off sentiment in Europe.
------------------------
Oil (WTI/Brent) – Day Trading Outlook:
Crude oil (WTI) is trading around $58.67, having bounced 4% from recent multi-year lows triggered by OPEC+ supply announcements and economic concerns. The U.S. shale outlook has turned structurally bearish, as noted earlier, with capital expenditure and rig count cuts signaling a near-term production rollover. This underpins a medium-term bullish case.
For intraday traders, today's move matters because oil has recovered above the psychological $58 level, with Brent back at $62.59. Volatility is elevated, and the price action suggests a reversal from oversold conditions. Energy sector ETFs (XLE) were flat despite market-wide weakness, signaling possible rotation back into oil stocks. Watch for upside continuation above $59.50 WTI, with a likely target zone around $61.20–61.80 intraday if risk appetite stabilizes.
-------------------
S&P 500 – Day Trading Outlook: Technically Heavy, Breadth Deteriorating
The S&P 500 closed at 5,606, down 43 points, with negative breadth across almost every major sector. The only strength came from Utilities (XLU +1.2%), underscoring a defensive rotation, while Technology (XLK -0.8%), Financials (XLF -0.6%), and Health Care (XLV -2.8%) led to the downside.
Market internals suggest further downside is likely unless bond yields soften or volatility retreats. The S&P 500 is struggling at 5,600–5,640, and intraday resistance sits at 5,630–5,650. A break below 5,585 opens downside toward 5,545–5,500 in the short term.
Key bearish indicators:
High-yield credit (HYG) is flat to negative.
Small-cap underperformance.
U.S. equity factors: value, core, and growth all showing -0.8% to -0.9% performance in every size bucket.
----------------
XAU didnt change from weekend.
The U.S. 10Y and 30Y yields remain above 4.3% and 4.7% respectively, capping gold’s upside, but risk-off sentiment and volatility (VIX > 24) are providing strong tailwinds.

Gold if..What if Gold get rejected from this trend line again this week? that might be a bearish sign.

GOLD China’s massive gold purchases carry significant geopolitical implications that reshape global economic and financial power dynamics:
1. Dedollarization and Reduced US Dollar Dominance
China’s aggressive gold accumulation is a core part of its strategy to reduce dependence on the US dollar amid rising geopolitical tensions and economic decoupling. By increasing gold reserves-while sharply cutting US Treasury holdings-China aims to insulate itself from dollar-related risks such as sanctions or asset freezes, as highlighted by the 2022 Russia-Ukraine conflict experience. This shift undermines the dollar’s global reserve currency status and supports the emergence of a more multipolar currency system.
2. Enhanced Sovereignty and Financial Security
Gold provides China with a tangible, sovereign asset that cannot be frozen or devalued by foreign powers. This strengthens China’s economic autonomy and resilience against external pressures, especially amid ongoing US-China trade conflicts and Taiwan tensions. Physical gold reserves bolster confidence in China’s currency (yuan) and financial system, helping to back efforts to internationalize the yuan and reduce reliance on Western financial infrastructure.
3. Geopolitical Influence and Economic Restructuring
China’s gold market dominance is part of a broader “economic divorce” from the West, reflecting deglobalization trends and the formation of alternative trading and financial systems led by BRICS and allied nations. By controlling significant gold supplies and refining capacity, China gains leverage in global commodity markets and strengthens its geopolitical influence, challenging US-led economic order.
4. Impact on Global Financial Markets and US Economy
China’s gold buying fuels a “virtuous cycle” for itself but a “vicious cycle” for the US: rising gold prices in dollar terms signal dollar weakness, prompting further diversification away from dollar assets, reducing demand for US Treasuries, pushing US bond yields higher, and increasing US borrowing costs. This dynamic pressures US fiscal stability and economic growth.
5. Strategic Resource Control and Long-Term Planning
The recent discovery of a massive gold deposit in China’s Hunan province (over 1,100 tonnes) further strengthens China’s position, potentially boosting reserves by 44% and reducing reliance on imports. This strategic resource control enhances China’s ability to influence global gold supply and pricing, reinforcing its geopolitical and economic ambitions.

Gold Swing Short Trade Setup**Gold Market Analysis: Potential Reversal Formation**
Gold is finally showing strong signs of a potential top formation after an extended bullish run. After weeks of anticipation, yesterday's price action delivered a significant rejection candle at the psychologically important 3500 level, which could indicate the reversal signal we've been waiting for.
It's essential to recognize that in a robust bullish rally, tops can take longer to form than initially expected, as we've observed recently. The market often exhibits both time and price extensions in such conditions. Nevertheless, the rejection at 3500 in conjunction with the current technical setup suggests that we may be seeing a reversal pattern taking shape.
**Trading Perspective:**
From a trading standpoint, I am currently awaiting a confirmation candle (a follow-up to yesterday's rejection) to validate that the top is in place. If we witness follow-through selling pressure today or tomorrow, it could present an excellent swing short opportunity, with the following targets established:
- **Target 1 (TP1):** 3295
- **Target 2 (TP2):** 3250
- **Target 3 (TP3):** 3200
- **Target 4 (TP4):** 3170
- **Target 5 (TP5):** 3070 (psychological support level)
Stay vigilant and ready for potential short opportunities as the market unfolds. Let’s see if the signals align for a successful trade. Happy trading! OANDA:XAUUSD OANDA:XAUUSD EIGHTCAP:XAUUSD EIGHTCAP:XAUUSD

Gold is once again affected by tariffs and rises sharplyNews: Gold rose sharply, mainly because Trump announced a 100% tariff on all films produced abroad and entering the United States, which once again triggered global trade tensions. At the same time, the conflict between Russia and Ukraine is still ongoing, and the situation in the Middle East has become tense again. For example, Israel’s missile attacks retaliated against the Houthi armed forces in Yemen and Iran. These have stimulated gold’s safe-haven properties and pushed up gold prices.
Technical aspect: Gold bulls are strong, so there is a certain risk in shorting gold. The point of concern below is the low of 3323. If gold continues to maintain its strength, it is impossible to fall below the 3323 line again.
Trading ideas: Buy gold near 3338, stop loss 3330, target 3360

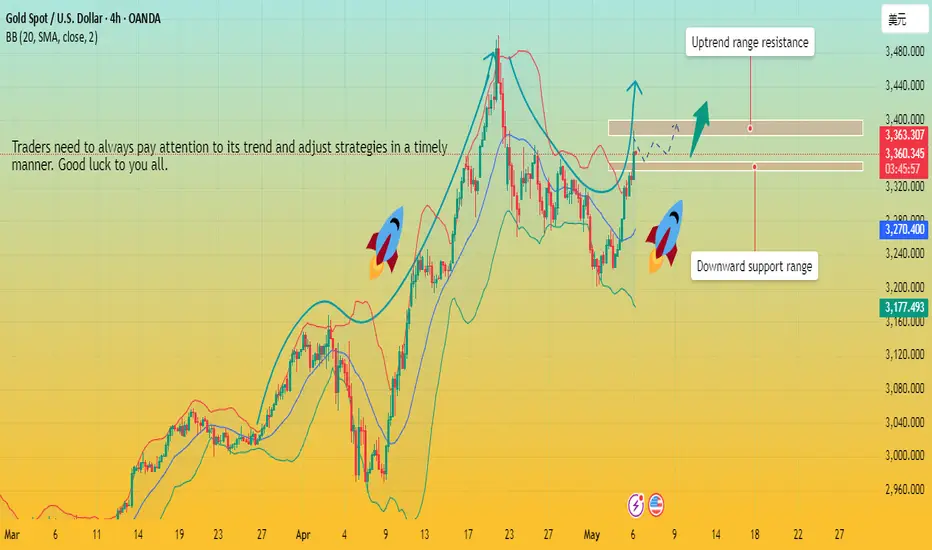
Gold is rising strongly. What is the reason?Analysis of today's market in Asian session:
Last week, the price of gold rebounded to above 3240, the lows were constantly rising, and the highs were broken; such a rebound is tempting traders to short.
In the morning of Asian session, the price of gold rose rapidly from 3320 to 3385 US dollars. In just two days, the price of gold recovered the decline during the Asian holiday. In the current market situation, it is not far away to rush back to the high point. The key to the price increase in the morning of Asian session may also support the European session and the US session. You can use a long strategy during this period.
However, you must pay attention to the continuity of the gold price. If there is an attack in the market transaction, there must be a defense; the downward or upward resistance level must be clear after the breakthrough position, how to operate to maximize the benefits and minimize the losses.
Quaid believes that if gold pulls back, its support point needs to focus on the 3340-3350 range, and the defense position is 3320; the position of the Asian morning rise should be paid attention to. If it falls below this position, you need to adjust the strategy in time.
Quaid believes that the upward trend is currently focused on $3380-3400.
GOLD - Bullish - Fundamentals safe haven for inflationary times.The trend is long on the weekly, daily, and 4hr charts.
-Dly 21 held as support.
-Fundamentals - USD inflation may increase. Gold is a haven when or if risk-off occurs.
-Look to buy at Tokyo from the 1st area, then if we fail to make a HH, then price may make a deeper pullback to the 2nd area that I have indicated.
Targets are calculated using Fibonacci extensions depending on where price holds and extends from.
This is just what I am doing and not financial advice!
