Analysis of gold operation strategy next week
The latest April non-farm payrolls report released by the U.S. Bureau of Labor Statistics (BLS) has attracted much attention from the market. The report shows that the U.S. economy added 177,000 jobs that month, higher than the market expectation of 130,000, indicating that the U.S. labor market still shows strong resilience. At the same time, the unemployment rate remained at 4.2%, in line with market expectations, while the previously released March data was revised down from 228,000 to 185,000. This data adjustment is an official routine operation. In terms of wages, the average hourly wage increased slightly lower than the market expectation of 0.2% month-on-month, and fell short of the expected 0.3%; however, the year-on-year growth rate remained at 3.8%, higher than the current inflation level, suggesting that real income is still showing an upward trend.
After the release of the non-farm data, the market reacted quickly but the trend was divided. Spot gold fell about $9 to $3,250/ounce within a minute after the data was released, but then quickly rebounded to $3,255/ounce, with an intraday increase of 0.56%. In the short term, the two price levels of 3,260 and 3,265 have become the resistance levels of market attention. Overall, the unexpected performance of the non-farm payrolls in April has boosted the market's short-term confidence. However, the downward revision of historical data and external uncertainties still keep investors cautious. Risk assets may still have some room for growth in the short term, but in the medium and long term, downside risks are gradually accumulating.
After the release of the non-farm payrolls, the price of gold fell as expected, but then quickly bottomed out and rebounded, continuing to fluctuate. The impact of recent non-farm payrolls on the gold market seems to be gradually weakening, and its volatility is even less than usual. The gold 1-hour moving average crosses the downward short position arrangement, and eventually continues to diverge downward. Gold is now under pressure to fall back at the 3270 line, so next week, around 3270 will still be the key turning point for gold bulls and bears. Although gold has rebounded, the decline is not large. If gold is under pressure at 3270 next week and does not break, it will be a shock at most. Gold bulls will not reverse easily for the time being.
Operation strategy:
1. It is recommended to short gold near 3260 next week, with a stop loss at 3270 and a target of 3240
Hello traders, if you have better ideas and suggestions, welcome to leave a message below, I will be very happy
XAUUSD trade ideas


XAU/USD: Weak Support and Potential Reversal in FocusKey Features of the Chart:
Volume Profile Analysis:
The highlighted volume profile on the left shows concentrated trading activity around the 1D POC (Point of Control) at $3,272.200. This suggests the POC is a critical pivot level for the market.
Support Insights:
The horizontal yellow line labeled "Weak Support Because It Has Been Hit So Many Times" at $3,272.200 indicates a crucial support level. However, repeated tests of this level may weaken it, making it susceptible to a breakdown.
Market Sentiment:
The blue arrow suggests a potential upward movement from the current price. This could indicate a bullish bias if buyers defend the support at $3,272.200.
Current Price Action:
The price seems to hover near the weak support, showcasing market indecision. Traders are likely waiting for a clearer breakout or bounce signal.
Trading Plan:
Bullish Case:
If buyers manage to defend the weak support at $3,272.200, a potential rebound could occur.
Traders might consider long positions targeting resistance areas near $3,300 or higher.
Use a stop-loss just below the $3,270 level to manage risks.
Bearish Case:
If the price breaks below the weak support of $3,272.200, expect a bearish continuation toward lower levels, such as $3,250 or $3,200.
Short positions could be considered here, with a stop-loss above the POC.
Closing Thoughts: This chart provides a clear focus on critical support and volume zones. Traders should monitor price action around the 1D POC and weak support level for reliable signals.
Remember: Consistency | Discipline | Perseverance are the keys to staying ahead.

Lingrid | GOLD Market COMPRESSION: Coiling Up Before BREAKOUTOANDA:XAUUSD is forming a potential triangle pattern after bouncing from support near 3,220, where multiple key levels converge. The price is holding above the short-term upward trend-line, showing signs of compression. If buyers defend this area again, we could see a breakout toward the 3,380 resistance. Until then, the pair remains in a consolidation phase.
📈 Key Levels
Buy zone: 3,280 – 3,290
Buy trigger: bounce from trend-line
Target: 3,380
Sell trigger: break below 3,280 with confirmation
💡 Risks
Gold remains sensitive to USD news — strong data can limit upside.
A sudden break of the triangle base may shift bias to bearish.
Volatility expected ahead of key macro releases this week.
Traders, if you liked this idea or if you have your own opinion about it, write in the comments. I will be glad 👩💻

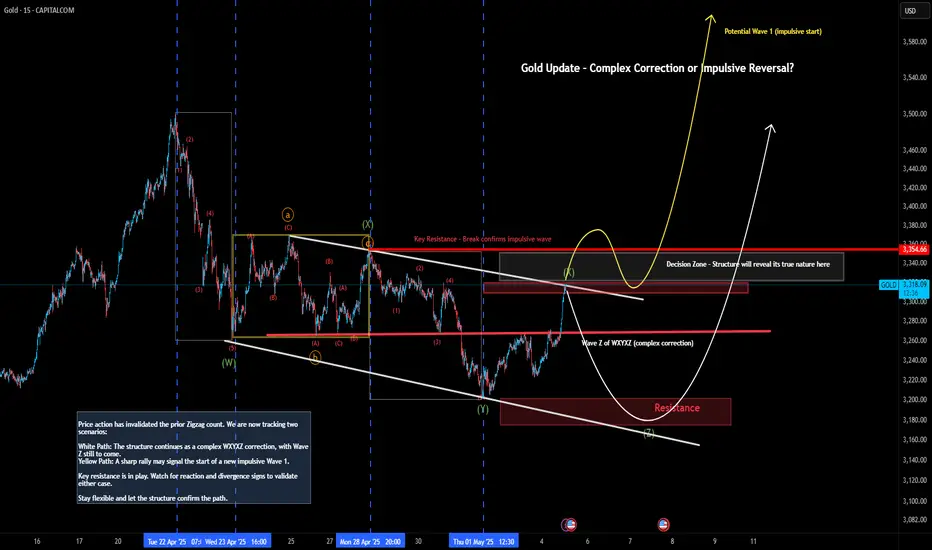
Gold Update – Complex Correction or Impulsive Reversal?
Price action has invalidated the prior Zigzag count. We are now tracking two scenarios:
White Path: The structure continues as a complex WXYXZ correction, with Wave Z still to come.
Yellow Path: A sharp rally may signal the start of a new impulsive Wave 1.
Key resistance is in play. Watch for reaction and divergence signs to validate either case.
Stay flexible and let the structure confirm the path.
Gold Stuck in Limbo- Sell Rallies, Ride the DropAfter the explosive rally that pushed Gold up to the 3500 area, the market quickly reversed with a sharp sell-off on April 22–23, dropping almost 2500 pips.
Since then, price has entered a consolidation phase.
Initially, the range was between 3270 and 3370, but since yesterday, the range has started to tighten — a classic sign that a breakout is approaching.
Looking at the structure, we’re dealing with a blow-off top followed by a range with clear support and resistance levels. In this context, I lean toward a downside breakout.
The key support is now at 3300 — and a break below it would likely expose 3270 again.
However, I don’t expect the move to stop there. If 3300 is broken, a continuation toward the 3200 zone becomes very likely.
🔹 Trading Plan:
As long as price stays below the 3360–3370 resistance zone, the strategy is to sell rallies, especially when price approaches the upper boundary of the range. Entries can be taken on rejection candles or confirmation patterns near resistance, with stops just above 3370. If 3300 breaks, watch for continuation setups toward 3200.
Only a sustained breakout above 3370 with strong bullish momentum would invalidate the bearish scenario and call for a reassessment.
Disclosure: I am part of Trade Nation's Influencer program and receive a monthly fee for using their TradingView charts in my analyses and educational articles.

Short Opportunity📉 XAU/USD SHORT IDEA – Bearish Breakdown Incoming?
Gold is currently testing resistance near the $3,313 level after multiple rejections, with visible supply zones (highlighted in yellow on the volume profile) above current price. The market is showing signs of exhaustion after failing to break recent highs.
🔻 Entry: $3,313
🎯 Target: $3,195 – Clean level supported by volume profile gap and previous demand zone.
🛑 Stop Loss: $3,355
📊 Risk/Reward Ratio: 2.80
📆 Estimated Target Date: May 6, 2025
📉 Projected Move: –3.58% or –$118.59

Gold weekly outlookUsing Fibs and regression trend channel, we should see a continuation to the downside with a possible buy in the fibs buy zone potentially rising towards the sell zone.

Market Analysis – Labor Day Sell-Off & Key Levels [4h]TFMarket Analysis – Labor Day Sell-Off & Key Levels
Labor Day kicked off with a major sell-off during the Asian session, breaking structure as price plummeted from 3292.88 to 3221.40 before the EU session’s opening bell (2025-05-01). Whether this shocked traders or not, one thing became evident—3292 is a critical level, coinciding with the monthly Fibonacci level.
An overstretched price rise inevitably needs correction, and that confirmation has arrived. For a meaningful bull run, price must breach 3292 with strong momentum to signal recovery. Failure to reclaim this level will keep bearish sentiment alive for a while longer.
Key Levels to Monitor – 4H Timeframe
Bullish Signals
Watch for 4H candle closes at:
🔹 Above 3243 → Potential short-term bullish opportunity, range 3243-3263.
🔹 Above 3263 → Swing opportunity toward 3322, though consolidation may still form as bulls resist further decline.
🔹 Recovery attempt? Key bullish ranges to monitor: 3322 / 3332 / 3339 / 3342 / 3356 / 3363 / 3403. Stay tuned.
🔹 Major upside continuation → If price holds above 3403, broader global economic conditions may not be in great shape, potentially contradicting gold’s safe-haven narrative.
Bearish Signals
On the downside, bears haven’t shown full conviction yet—but keep an eye on:
🔻 Immediate important levels: 3200 / 3167 / 3134 / 3080 / 3057 / 3030 / 3005 / 2999 / 2966 / 2961 / 2952
🔻 Short-term bearish opportunities: 3253 / 3242 / 3232 / 3227 / 3211 / 3209 / 3200 / 3195 / 3185 / 3181 / 3178 / 3169.
🔻 While many traders favor these ranges, personally, I prefer locking in on key levels.
Final Thoughts
Markets tell a story—we just need to show up early to catch the best opportunities.
✅ Be independent. Be smart. Be confident.
✅ Trade with clarity—no rush, no noise, no distractions.
✅ Wait for confirmations. Then act.

Gold is stimulated to rise stronglyGold has risen strongly as a safe haven, breaking the shock of last week. The current 3328 line is under strong pressure again, and it is recommended to short. Gold has risen and reached the key resistance level in the previous period. Gold has broken through upward without falling back, which means there is no opportunity to go long. First look at the short side to see if it will fall back and adjust. Gold operation is recommended to short on rebound and go long on pullback. Focus on the resistance level of 3330 and the support level of 3260.

Gold rises strongly and bulls restart!At present, the support of the 4-hour cycle is around 3330. If there is a chance of a decline, you can follow the bullish trend. In terms of short-term gold operation ideas, it is recommended to do more on pullbacks and short on rebounds. The upper short-term focus is on the 3415-3420 line of resistance, and the lower short-term focus is on the 3330-3350 line of support. Friends must keep up with the rhythm. It is necessary to control the position and stop loss, set stop loss strictly, and do not resist single operations.

Gold Price ActionHello traders! This is almost same setup or pattern as BTCUSD
If you look closely at the left side of the chart, you’ll notice multiple rejections from the same zone — forming a head-and-shoulders-style distribution. This area has now become a strong supply zone.
📌 What to Expect:
This is a high-probability short setup. If price taps into the supply zone again, it could trigger a strong move down, especially with liquidity already swept.

Gold Pullback Incoming!Gold has struggled to break through its daily highs for the past week. I am looking for another push up to the $3360-$3370 range. If it fails to break that level again, we may see support levels around $3200 being retested. In my opinion, there is even potential for it to go lower. I'd love to hear your thoughts in the comments!
*Side note:* With the U.S. dollar falling in value and ongoing economic uncertainty, I believe gold has tremendous upside potential over the next 12-18 months. FX:XAUUSD

Non-agricultural prospective data analysis Operation suggestions📌Fundamentals:
📊Technical aspects:
Technically, spot gold is in a downward trend in the short term, and there is a certain rebound or shock at the key support level. At the 4-hour level, the gold price is running above the lower track of the Bollinger Band, and the opening shows signs of contraction. The MACD indicator dead cross is gradually closing, and the RSI indicator is running in the 35-45 range, showing that the long and short forces are relatively balanced.
🎯Practical strategy:
3260-3270 light position short, target 3225-3200. When it reaches 3225-3200 and stabilizes, try to go long, target 3250-3270.

XAUUSD UPDATE 06/05/25After a correction to 3200 level, Gold make a strong bullish rally to continue it trend.
Target breakout 3500 / new ATH.
And this is it, wave 5
Good Luck !

Gold Head & Shoulder PatternThe completion of a head and shoulders pattern in the gold market suggests the potential commencement of an upward trend.
Current market conditions indicate that we are presently situated within the right shoulder formation of this pattern, an observation that warrants careful monitoring for confirmation of the bullish reversal and subsequent price appreciation.


THE KOG REPORT - UpdateEnd of day update from us here at KOG:
We wanted this to test that high and give us the short which worked well and gave us a good start to the week. While price came into the lower range level our indicators kept suggesting this was going up so we said we would protect and manage, and the those who wanted to trade the red boxes
Now we're at crucial resistance, and because the daily range is so large it's a zone of 3348-58. That turns support into the 3325-30 which will need to hold in order for price to go up! That double bottom was concerning as mentioned in the KOG Report, however, we did want lower to come back up here, unfortunately, that swing turned into scalping.
We'll stick with the chart as it is, break above and we'll look for higher, otherwise, this is the region to keep an eye on!
RED BOXES INDI LEVELS:
Break above 3320 for 3327✅ , 3330 ✅ , 3335✅ , 3345✅ , 3347✅ and above that 3362 in extension of the move
Break below 3310, for 3306✅ , 3297✅ , 3295✅ , 3280✅ , 3266 and 3255 in extension of the move
As always, trade safe.
KOG

XAUUSD DAILY PLAN & MARKET UPDATE — APRIL 30, 2025Not predictions. Structure. Logic. Execution.
📍 What Happened:
🔻 3315–3325 SELL → Perfect rejection → Drop of 200+ pips
🔁 Retest at 3314 → Confirmed OB rejection zone
❌ 3284–3288 BUY → Invalidated, BOS clean
✅ 3260–3270 BUY → Real reaction zone. OB + FVG + full discount → Delivered bounce
👁🗨 Eyes On (Into NY Session & May 1):
3315–3325 = Decision zone
→ Break = bullish reversal
→ Rejection = new short trigger
3260–3270 = Key support. If holds = bounce continuation
3252–3244 = Next strong buy zone if 3260 fails
3350 / 3385 = Targets only if bullish breakout occurs post-news
🧠 Current Bias:
🔸 HTF Trend: Consolidation under ATH → bearish-leaning
🔹 LTF Flow: Bearish structure unless 3315 flips
🎯 Bias: Neutral-bearish → shifting bullish only above 3325
📊 KEY LEVELS TO WATCH:
Zone Type Level(s) Commentary
🔻 Resistance 3385 HTF FVG zone / reversal risk
🔻 Resistance 3350 Clean target above breakout
🔻 Resistance 3325 Final barrier before shift
🔻 Flip Zone 3315–3320 Must flip to validate bulls
🔁 Retest 3308–3312 Last OB rejection
⚖️ Mid Zone 3286–3292 Retest structure, weak
✅ Support 3260–3270 Confirmed bounce zone
🟩 Demand 3252–3244 Next high-conviction buy zone
🟢 Discount 3220–3235 Long-term OB zone
🟢 Discount 3192–3205 Extreme discount + FVG
🗓️ MACRO FOR MAY 1:
🗣️ 15:30 Trump Speech
📉 15:30 Unemployment Claims (forecast: 224K)
🏭 15:45 Final Manufacturing PMI
🏭 17:00 ISM Manufacturing PMI + Prices
⚠️ Expect high volatility. Prepare for breakout setups only after structure confirms — not before.
🎯 Final Note:
If 3315–3325 breaks cleanly → we’re heading to 3350 / 3385.
If it holds → we hunt reentry shorts with sniper precision.
This is not a place to guess. It’s where real traders wait.
—
📌 Like plans built on logic, not luck?
Drop a 🧠 if this structure helped you.
🔥 Follow if you're done with signal-chasing and ready to trade like a sniper.

XAUUSD- 1H UpdateChart Description – XAUUSD 1H (Gold Spot vs. USD)
This is a multi-scenario Smart Money Concept (SMC)-based projection chart for Gold (XAUUSD), focusing on potential bullish retracements and major bearish continuations, incorporating Buy Zones, Sell Zones, and Change of Character (CHOCH) areas.
🔍 Key Components:
🟣 Sell Zones
Two sell zones are identified, with the highest near the All-Time High (ATH) around the $3,500 mark.
These are areas of expected bearish reaction if price retraces upward after a low.
🟢 Buy Zones
Located between $3,200 – $3,160 and another deeper one near $2,960, where potential bullish reactions may occur.
🔵 CHOCH - 4H
Marked in red around $3,260 area, indicating a 4-hour Change of Character, suggesting a potential shift from bullish to bearish sentiment.
🔸 Key Price Levels
$3,120: Historical support/resistance.
$2,956.20: Major swing low and key demand zone.
📊 Projected Market Path (Colored Waves)
🔹 Blue Path (Bullish Retracement Scenario)
Price is expected to retrace into a sell zone around $3,400–$3,460 after testing the current demand.
From there, a major sell-off is anticipated.
🔷 Cyan Path (Bearish Continuation)
Following the retracement, the market is projected to break below the recent low and head toward lower buy zones, potentially near the $3,120 and $2,960 regions.
Shows lower-high and lower-low formation, consistent with a bearish trend.
🧠 Market Sentiment
This chart suggests a bearish outlook for Gold unless a structural shift invalidates the CHOCH zone and supply levels. The chart highlights the importance of:
Waiting for confirmation in the supply zones before shorting.
Considering buy opportunities only in valid buy zones with bullish reaction confirmation.

Bearish and bullish possibility The market created a 4h descending triangle and it broke out and retested but now it seems to be creating an ascending triangle pattern below, if the descending triangle plays out we could see the market reach within the weekly fvg at the 3185 area which will present buying opportunities and if the ascending triangle plays out we could reach the 3387 area, overall we just have to wait and react accordingly

Gold (XAUUSD) - Bullish Breakout from Bearish Pennant | 4H ChartTechnical Analysis: On the 4-hour chart, Gold has completed a bullish breakout from a Bearish Pennant formation, defying its typical continuation pattern to the downside. This breakout is supported by a strong bullish candlestick close above both the pennant's upper boundary and the Ichimoku Cloud, indicating a potential trend reversal and shift in momentum.
Key Highlights:
Pattern: Bearish Pennant invalidated with bullish breakout.
Breakout Confirmation: Price closed above the upper resistance trendline and Ichimoku cloud.
Next Resistance Zone: Targeting 3,362 – 3,381 based on the measured move and price structure.
Support : Immediate support at 3,286 in case of a pullback.
Fundamental Context: Gold prices are rebounding amid renewed geopolitical concerns, weaker U.S. dollar performance, and increased central bank gold buying activity. This aligns with a short-term bullish narrative despite recent corrections. Any dovish signals from the Federal Reserve or weaker macroeconomic data could further fuel upward momentum.
Trend Outlook: Short-to-mid term trend is bullish following the breakout. Traders should look for bullish continuation signals and volume confirmation. A sustained move above 3,340 would further validate upside potential.
Must Support Me Share My Idea With Your Firends Mention Your Feed back Comment Section
Note: This is not financial advice. Please conduct your own research and manage risk accordingly.

Summary of the Gold Market This WeekThis week, the gold market showed a clear downward trend, with spot gold accumulating a 2.43% decline.👉👉👉
The economic data had a significant impact on the gold market this week. Data released by the US Department of Labor on the 2nd showed that the non - farm payroll employment in the US increased by 177,000 in April, much better than the expected 138,000, and the growth data for the previous two months were revised downwards. The US unemployment rate was 4.2% in April, in line with market expectations. The strong non - farm payroll data reduced the possibility of the Federal Reserve cutting interest rates in June. Under normal circumstances, the reduction in the interest rate hike expectation should be bullish for gold. However, the gold market did not rise sharply this time, mainly because the gold price had risen significantly in the early stage and the long - term investors had a strong sentiment of taking profits. At the same time, the relatively good employment data also reflected the resilience of the US economy to a certain extent, weakening the appeal of gold as a safe - haven asset. As a result, the gold price did not show an obvious upward trend immediately after the data was released. Instead, it remained volatile in the short term.
From a technical perspective, although the gold price has declined this week, the futures price still has certain technical advantages in the near term. On the daily chart, although a negative candlestick was recorded this week, the previous upward trend has made the moving average system still show a long - term arrangement. From the perspective of the RSI, the current value is hovering around 50, indicating that the market's long and short forces are temporarily relatively balanced, and neither side has an obvious advantage. Therefore, the gold price has entered a consolidation stage.
With the economic development in Asia and the changes in consumers' demand for gold investment and jewelry, Asia's influence in the global gold market has become increasingly prominent. If the demand in Asia remains strong in the future, it will provide strong support for the gold price. On the contrary, if the demand weakens, it may increase the downward pressure on the gold price.
Looking ahead to next week, the gold market still faces many uncertainties. On the one hand, the continuous changes in economic data and the direction of the Federal Reserve's monetary policy remain key factors. If the subsequently released data continue to show the resilience of the US economy, it may further reduce the market's expectation of a rate cut by the Federal Reserve, thereby suppressing the gold price. On the other hand, any new development in the international trade situation may trigger fluctuations in the market's risk - averse sentiment, thus affecting the supply - demand relationship and price trend of gold.
