Gold (XAUUSD) 4H Chart – Key Resistance Test: Breakout or RejectSimple Analysis:
Price is currently at a resistance zone (~$3,335).
Two possible outcomes are drawn:
Bullish scenario: Break above current resistance → move toward the next resistance (~$3,500+).
Bearish scenario: Rejection from current resistance → fall back to the support zone (~$3,240).
EMAs:
50 EMA (red) is above 200 EMA (blue) = bullish bias, but price must break resistance to continue upward.
Summary:
Watch for a breakout above ~$3,335 for bullish continuation, or a rejection for a potential drop to support near ~$3,240.
XAUUSD trade ideas

XauUsd bullish outlook✅ Reasons for Entry:
✅ Third Touch on H4 Extreme Trendline confirms clean anchor & rejection
✅ Strong RBS zone at 3235 — previously supported upward impulsive move
✅ Visible demand rejection wicks on H1 and M15 — signs of buyer defense
✅ Bullish market structure still intact on D1 (trend continuation bias)
✅ Extreme Trendline + Structure + Rejection = High-probability setup
Auto Generated by Custom Smart Trading Chart AI

GOLD → Consolidation ahead of news. What to expect?FX:XAUUSD is consolidating. Focus on 3370 - 3269. Economic data is expected tomorrow, and gold is likely to trade within the consolidation range for several days.
Optimism about US trade talks with key partners boosted risk appetite and supported the dollar. The US Treasury Secretary reported progress with India, while President Trump softened his rhetoric on China, which also strengthened the dollar. At the same time, traders took a wait-and-see stance ahead of the release of US GDP data for the first quarter. If the figures turn out to be weak, gold could rise sharply as a safe-haven asset. Thus, the gold market remains sensitive to trade news and macro data, especially against the backdrop of rebalancing at the end of April.
At the moment, as part of the current momentum and correction, I expect prices to recover from the 0.5 - 0.7 Fibonacci zone. Gold may test 3323-3325 before resuming its correction within the consolidation.
Resistance levels: 3323, 3352, 3370
Support levels: 3290, 3270
Traders are waiting for a resolution in the tariff dispute as well as economic data due tomorrow. However, while the price is consolidating, I expect a rebound from support. BUT! If the price continues to squeeze towards any boundary, with priority to support, then the chances of a breakout from the consolidation base may increase.
Best regards, R. Linda!

xauusd:sell@3315-3320After the opening of the gold market today, it started to rise. After breaking through 3270, the market has been in an upward trend. Currently, it has reached the resistance area of 3310-3320. You can start short selling when it reaches this area.
All the signals I sent have been profitable, and I will continue to send accurate signals.
Today's trading strategy for gold:
xauusd sell@3315-3320
tp:3280-3270

Gold Technical Analysis Update:(XAUUSD)OANDA:XAUUSD
Not much has changed since my last update—gold remains stuck in the same range-bound, triangle pattern we've been tracking. The price action is definitely tightening, which usually means we're getting closer to a decisive breakout.
Key Levels:
- Support: 3300 is holding firm as a strong support level.
- Resistance: 3350 continues to cap the price as a major resistance, keeping gold within a wide range.
My outlook remains bearish for the short term, especially as gold is still trading below the golden Fibonacci zone (3375-3420). The weekly close also confirmed that sellers remain in control for now.
Today’s monthly close is particularly important and could set the tone for the next move:
- If gold finishes below 3330, this will strengthen the bearish outlook and open the door for a drop towards 3250, 3200, 3150, and even 3070.
- However, a breakout above the triangle and 3350 would force a reassessment of the short-term direction.
For now, I’m waiting for a clear breakout from this range to confirm the next major move.
Personal trade plan:
- I believe we can enter a sell trade here, with targets at 3250/3200/3150/3070.
- My stop loss is set at a 4-hour candle close above 3335.
As always, manage your risk and trade wisely. Good luck, traders! 🏆💰

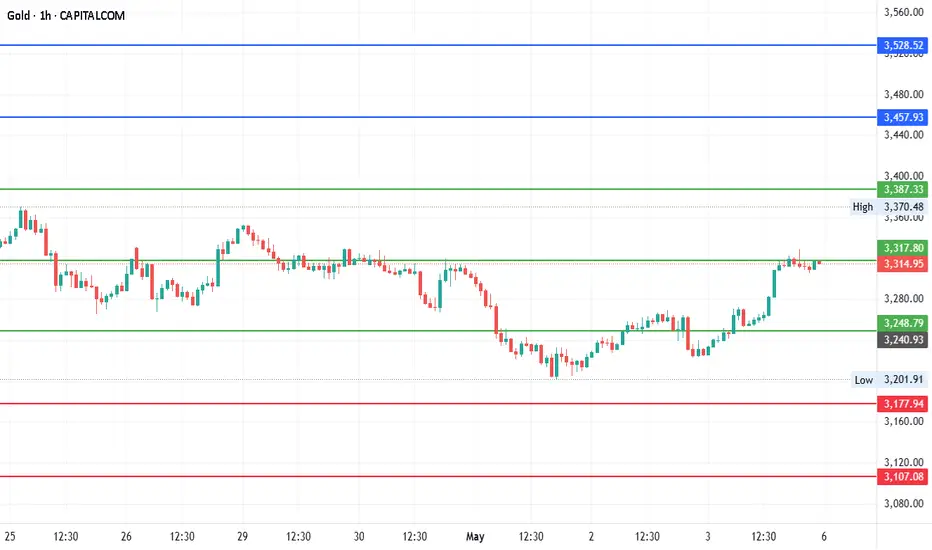
GoldCurrent Price: $3317
Mid-point: $3317.80
Upside: $3457.93, $3528.52, $3607.54 and $3686.56
Downside: $3177.94, $3107.08, $3028.06 and $2949.04
Resistance: $3387.33
Stoploss: 3248.79
#Gold
#GoldChartAnalysis
XAUUSD Analysis: Make or break
Price is currently approaching a key Level.
Upside Scenario: If XAUUSD breaks above 3270 and holds, we may see a bullish move towards the 3310 target.
Downside Scenario: If price fails to break above and instead breaks below the trendline, it could trigger a downside move toward 3200.
Watch for confirmation before entering any position.
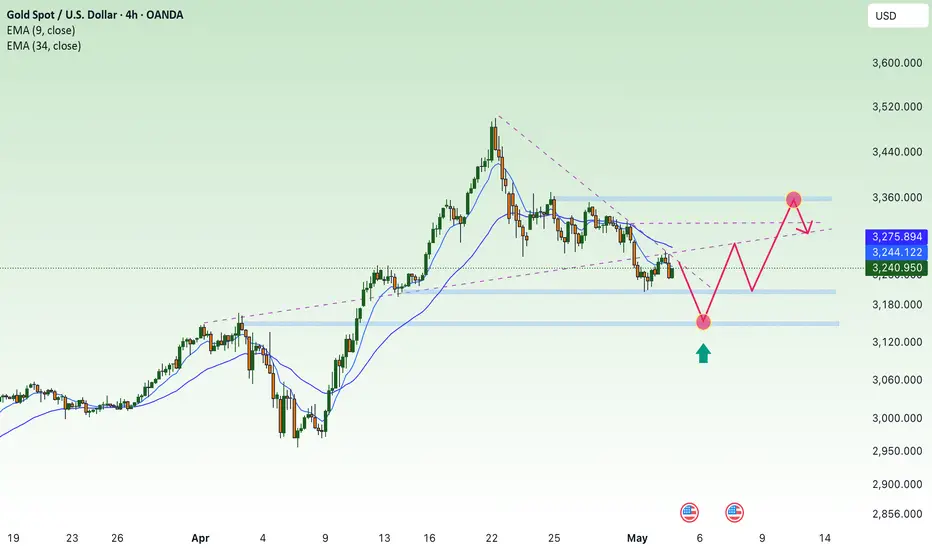
GOLD ROADMAP Impultse to Trade Within this Big CorrectionI think Down force its not done just yet, then, looks like its in Wave C a clear Impulse whithin the Correction so..
Selling level @ 3.400 Target 3.310
Buyin Level @ 3.310 Target 3.450 / 3.465
Selling Level 2 @ 3.450 / 3465 Target 3.165
GG!


GOLD - Is this the end of the Bull Run?Gold has once again followed my previous analysis — turning bearish right at key levels! 🚩 After an incredible bull run where price kept making new highs, signs are now pointing to a possible top. We could be entering a short-term bearish phase here, with potential for a deeper correction if momentum builds.
Right now, I’m holding a bearish bias. I’ll be watching for solid sell setups, especially around those well-defined resistance zones. There’s also an unfilled gap below that could attract price action — keep an eye on that level (chart shows the zone clearly 🔎).
I’ll be looking for confirmation through structure breaks and clean retests before entering shorts.
What’s your take — are we seeing a reversal brewing, or is this just a dip before the next leg up? Drop your thoughts below!
If this analysis helps, a boost or follow would mean a lot — and keeps you in the loop for the next moves! 🚀

Lack of bullish momentum, gold price waits, slight decrease✍️ NOVA hello everyone, Let's comment on gold price next week from 05/05/2025 - 05/09/2025
🔥 World situation:
Gold (XAU/USD) slipped by more than 0.35% on Friday and is on track to close the week with a decline exceeding 2.5%, as easing trade tensions and upbeat US labor market data boosted investor risk appetite. This shift in sentiment encouraged profit-taking ahead of the weekend, weighing on the safe-haven asset. At last check, XAU/USD was trading around $3,226, pulling back from an intraday peak of $3,269.
Adding to the improved market mood, China’s Commerce Ministry confirmed that the US has shown a willingness to resume discussions on tariffs, while reiterating that Beijing remains open to dialogue.
🔥 Identify:
Gold price continues to adjust down, lacking momentum to increase price. around price range 3200 - 3350
🔥 Technically:
Based on the resistance and support areas of the gold price according to the H4 frame, NOVA identifies the important key areas as follows:
Resistance: $3285, $3316, $3355
Support : $3202, $3155
🔥 NOTE:
Note: Nova wishes traders to manage their capital well
- take the number of lots that match your capital
- Takeprofit equal to 4-6% of capital account
- Stoplose equal to 2-3% of capital account
- The winner is the one who sticks with the market the longest
The latest trend of the gold market and operation suggestionsAt present, on the daily chart, gold closed with a medium-sized bearish candle. In the early trading session, it directly broke below the crucial defensive level of 3,370, thoroughly opening up the adjustment range. Meanwhile, it triggered the MACD indicator to form a death cross. Now that the gold price has reached a new low, the dominant strategy for the early trading session is still to sell on rallies.
On the 4-hour chart, in today's early trading session, the price directly broke down and smoothly pierced through the support area ranging from 3,270 to 3,260, realizing the transformation between the top and the bottom. At the 1-hour level, not only has it broken below the previous low of 3,260, but the moving averages have also formed a death cross, indicating strong bearish momentum. It is advisable to sell decisively when the gold price rebounds to around 3,270, which is the densely traded area at the lower part of the recent box consolidation. If the rebound fails to even reach the vicinity of 3,260, in an extremely bearish market situation, the downward space for the gold price will be further expanded.
Overall, for short-term trading of gold, the operation strategy should mainly focus on selling on rallies, supplemented by taking light long positions on pullbacks. Pay close attention to the resistance range from 3,235 to 3,245 on the upside, and closely monitor the support levels from 3,200 to 3,190 on the downside.
XAUUSD
sell@3225-3230
tp:3210-3200
Investment itself is not risky; it is only when investment is out of control that risks occur. When trading, always remember not to act on impulse. I will share trading signals every day. All the signals have been accurate without any mistakes for a whole month. No matter what gains or losses you've had in the past, with my help, you have the hope of achieving a breakthrough in your investment.

Sideway range, gold price accumulates below 3302⭐️GOLDEN INFORMATION:
Gold price (XAU/USD) kicked off the week on a positive note, rising toward the $3,271 level during Monday’s Asian session as a blend of geopolitical and economic concerns fueled demand for the safe-haven asset. The prolonged Russia-Ukraine conflict, coupled with renewed tensions in the Middle East, continues to elevate global risk sentiment. Meanwhile, lingering uncertainty surrounding US President Donald Trump's tariff agenda has added to investor caution, further supporting the appeal of gold as a hedge in times of instability.
⭐️Personal comments NOVA:
Gold price continues to accumulate, low amplitude at the beginning of the week, waiting for the most important interest rate information this week
⭐️SET UP GOLD PRICE:
🔥SELL GOLD zone : 3302- 3304 SL 3309
TP1: $3290
TP2: $3280
TP3: $3270
🔥BUY GOLD zone: $3204 - $3206 SL $3199
TP1: $3215
TP2: $3224
TP3: $3240
⭐️Technical analysis:
Based on technical indicators EMA 34, EMA89 and support resistance areas to set up a reasonable SELL order.
⭐️NOTE:
Note: Nova wishes traders to manage their capital well
- take the number of lots that match your capital
- Takeprofit equal to 4-6% of capital account
- Stoplose equal to 2-3% of capital account

Gold Hits Key Resistance – Will It Break Out or Pull Back? Gold has been moving in a downtrend, and there's a clear descending trendline marked in red. The price has just reached that trendline right around the 3316 level, which also aligns with a horizontal resistance at 3329 — making this a very strong resistance zone.
The price surged from the support area near 3224, breaking through minor resistances until it reached the current level. But what we need to keep an eye on is that momentum indicators like MACD and Stochastic below the chart are starting to show overbought signals, which could mean the price might pull back or at least slow down.
🎯 Expected scenario now:
If the price fails to break above 3329 and can't push through the trendline, we might see a corrective drop toward 3269, and possibly down to 3224 again.
However, if the price breaks above this zone with strong volume and holds above it, we could see a continued bullish move toward 3352 — which looks like an ideal selling zone.

Weekly Analysis on GOLDFor next week trading sessions i will be looking for both buy and sell trade opportunities since price shows a bearish retracement which likely to continue for a couple of days and look for buying trade based on the significant zones.

xau bearish?Technical analysis imo shows xauusd is creating a bearish channel. Important to follow fundamental factors as this could change the outlook. Support levels at 3160 and 3100 important on the short to longer term trend.

Risk aversion in the international situation is escalating! Gold has risen strongly again, breaking the shock, and there is basically no pullback. It is very likely that the risk aversion sentiment will be released directly, and gold will start to adjust again. Therefore, it is not suitable to chase more at this position now. It is better to wait patiently for the opportunity to fall back. Gold may rise and fall at any time. In the shock rise, it is very likely that the price will return to the starting point or lower in the later trend, but it can continue to rise. This is a feature of the shock. At the same time, the current market is not extremely strong and is still in the shock rise. Therefore, don't chase more, but retrace to support more.
Investment strategy: Gold 3340 short, stop loss 3050, target 3200

Gold - All eyes on Wednesday 08 May - FED🟡 Gold Traders: Nothing Matters Until Wednesday! ⏳💤
Hey traders! 👋
This week, all eyes are on Wednesday... and everything before that? Mostly noise.
Let me break it down for you. 👇
📊 Technical Outlook
Gold is chilling above a key resistance level right now.
Trendlines suggest we won’t see any major moves before Wednesday unless big news drops. 📰
🕐 Asian session is kicking things off above resistance.
If bulls show up there, we could break Trendline 1 (Image below) and head towards the $3300 🎯 target.
📉 RSI across multiple timeframes? Pretty neutral.
If Asia trades flat or slightly bearish, gold might range between $3210–$3250.
Break below $3201, and things could get shaky... but the European session might push us back above that support.
U.S. session on Monday? Likely a sideways snoozefest 😴 (unless surprise news hits).
🎯 Trade Setup (Mon–Wed)
I’m looking to play the range between:
$3261 (Trendline 2) 🔼 and $3169 (Trendline 4) 🔽
That’s a comfy $90 window I’m aiming to trade before Wednesday's fireworks. 🚀
🔮 After Wednesday – The FED Factor 💣
Here’s the real catalyst:
Wednesday, May 7 at 2:00 PM EST – FOMC Rate Decision
If the FED cuts rates (not likely, but possible under pressure), gold could tank hard. 💥
I’m talking a potential drop to $3150 or lower 🕳️📉
That’d be a -$90+ move easy.
FED has been holding the line 💪, resisting pressure (especially from Trump back in the day), but if the economy flashes red, that rate cut might come sooner than expected.
🧠 Final Thoughts
FED paused hikes, but left the door open for 3 rate cuts this year.
Until we get more clarity, no strong bullish signals on gold.
My bias stays: Bearish unless proven otherwise. 🐻💬
Stay sharp out there, and watch those sessions. Wednesday’s the real deal! 💼📉
And last but not least, look at this and let us know what you think about please:
Some would say its impossible but as we know, gold can do everything!
-------------------------------------------------------------------------
This is just my personal market idea and not financial advice! 📢 Trading gold and other financial instruments carries risks – only invest what you can afford to lose. Always do your own analysis, use solid risk management, and trade responsibly.
Good luck and safe trading! 🚀📊

Trump's announcement signals the return of buyers🔔🔔🔔 Gold news:
➡️ U.S. President Donald Trump on Sunday announced a 100% tariff on movies produced outside the country. A move to reimpose tariffs by President D. trump. Gold prices are holding on to a recovery to $3,272 early Monday as buyers return to the boom amid uncertainty over potential trade deals between the United States and its trading partners. The US dollar is back in the red amid trade uncertainty and repositioning ahead of the Fed.
Personal opinion:
➡️ A surprise move by President Trump. And it shows us that the trade agreements are still uncertain and it is positive only at the level of cooling down between the parties involved
➡️ Analyze based on important support resistance and Fibonacci levels combined with trend lines to come up with a suitable strategy
Plan:
🔆Price Zone Setup:
👉Buy Gold 3204 - 3206
❌SL: 3199 | ✅TP: 3210 - 3215 – 3320
👉Sell Gold 3313 - 3316
❌SL: 3320 | ✅TP: 3309 - 3305 – 3300
FM wishes you a successful trading day 💰💰💰

Gold Rejection at Channel Resistance – Bearish Setup in Play"
🔍 Analysis Summary
Current Price: \~\$3,266
Indicators:
EMA 50 (Red): \~\$3,277 – price is slightly below this level
EMA 200 (Blue): \~\$3,180 – acts as a dynamic support
Trend Structure:
Previous Uptrend: Sharp bullish move within a rising wedge (now broken)
Current Pattern: Descending channel or flag-like consolidation after the strong bullish trend
Support Level: \~\$3,175–\$3,180 (highlighted zone with green arrows showing bounce)
Resistance Level (Target 1): \~\$3,277–\$3,300
Target Point: \~\$3,356
📈 Bullish Scenario:
Price bounced off strong support (around EMA 200 + horizontal level).
If price breaks above the descending channel and retests resistance, it could aim for **Target 1 (\~3,300) and possibly reach **Target Point (\~3,356)**.
📉 Bearish Scenario:
Failure to break above descending channel resistance could lead to a retest of the support zone.
If support breaks, the next possible stop could be below the EMA 200, triggering deeper correction.
🧠 Trading Idea
Buy Entry: On confirmed breakout above descending channel.
Target 1: \~3,300
Target 2: \~3,356
Stop Loss: Below \~3,175 support

Xauusd buyBuying gold , it's just signal for you ,enjoy and make money , do anylisis and learn ,gold was good today we hit 400 pips in 2 trades ,

Gold price suddenly accelerates, approaching the 3,300 USD/ounceAfter two consecutive weeks of decline, the world gold price is showing strong signs of recovery when it skyrocketed to 3,266 USD/ounce - an increase of 25 USD in just one session. Although still quite far from the peak of 3,500 USD/ounce, the increase this morning shows that investor sentiment has begun to change direction.
The increase occurred at the beginning of the session despite previous negative forecasts, reflecting the sensitivity of gold to geopolitical and economic information such as US-China trade negotiations or the strength of the USD. The daily chart shows that gold has bounced strongly from the EMA34 support zone and returned to the resistance zone around 3,320–3,340 USD, opening up an opportunity to retest the 3,400 USD mark if the current increase is maintained.

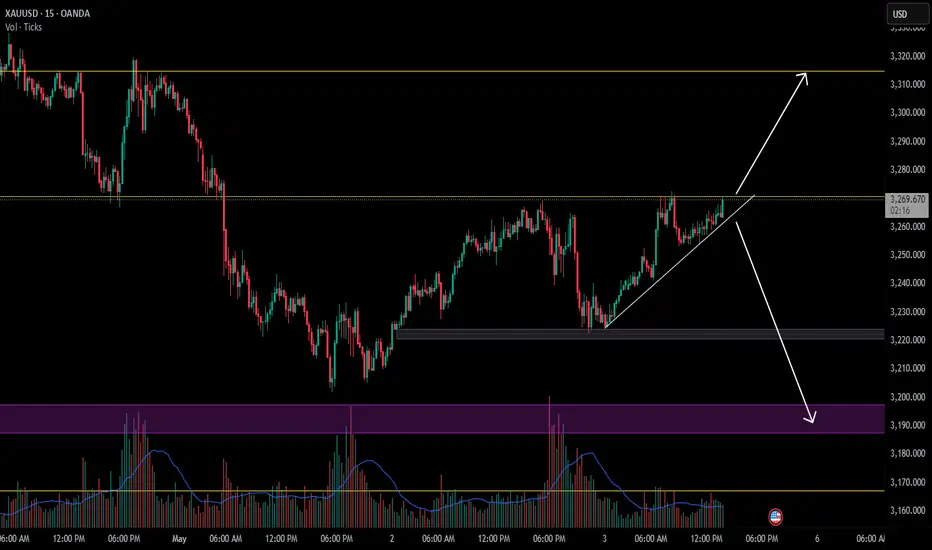
Gold new Update 🧠 Chart Analysis Summary:
Current Price: Around 3,240.610.
Resistance Zone: 3,256 – 3,264 (highlighted in orange).
Support Zone: Around 3,220 (highlighted with a green target).
Chart Pattern: Looks like a possible liquidity grab above before a potential sell-off (indicated by the hand-drawn zig-zag upward move and large downward arrow).
🎯 Trade Setup Suggestion (Short Position):
Entry: Around 3,256 – 3,264 (wait for price to enter this supply/resistance zone).
Stop Loss (SL): Just above 3,270, ideally at 3,273 (above the marked resistance).
Take Profit (TP): Around 3,220, as marked on the chart (support area).
⛳ Summary:
Risk: ~10–15 points.
Reward: ~35–40 points.
Risk-to-Reward: Roughly 1:3, which is favorable.
