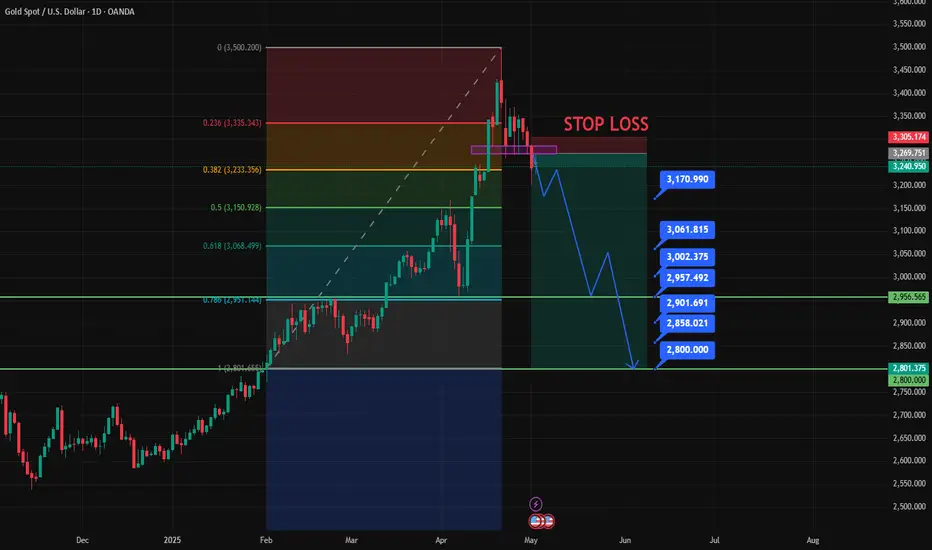
XAUUSD swing Analysis XAUUSD took support from support line,
All long targets are achieved.
this month taking rejection from major resistence,
Let's track the moves to down.
follow for more swing analysis on INDICES - CURRENCY - COMMODITIES
XAUUSD trade ideas

XAUUSDpossibility of a long position.
- a lot of bullish momentum
- retested upwards trendline
- market structure is in a upwards continuation
- bullish engulfing candles
- price broke through demand zone, now we wait to see if it breaks back through or changes direction (bearish)

GOLD WILL DROP MORE !!HELLO TRADERS
As i can see Gold break 3300 levles which was expected a Strong Support Zone for a new ATH
but its rejected and now we had saw a Trade War Talks on Going with US and China to be compromise soon on Friday we saw NFP results was good for Dollar and now after closing markets under 3260 is a clear sign for us for a more incoming drop in precious metals Gold Long Term View is still bullsih but markets always not move in one direction so it a great trade ida with a very low Risk and higher Rewards we need ur Support and comments Stay Tuned for more Updates ....
Latest gold operation analysisFrom the daily level, the current price resistance is in the 3310 area, which is the key watershed of the band trend. If the price is below this position, the subsequent band will be shorted. At the same time, for the short-term four-hour price resistance, it is in the 3253 range. The gains and losses of this position determine the key to the short-term trend. The price will consolidate up and down at this position in the short term. Pay attention to the support of this position and further test the daily resistance area before looking at the pressure.

A Clear Bearish Structure (READ CAPTION)1. Overall Trend: The chart shows a clear bearish structure for XAU/USD (Gold vs. US Dollar) on the 1-hour timeframe. Price is making lower lows and lower highs, suggesting strong downward momentum.
2. Key Zones:
• Support Area (Blue Zone around 2321): Price is reacting to this level with a potential bounce forming an ‘M’ structure (double bottom). This could indicate a short-term support or potential reversal area.
• Resistance Area (Pink Zone): Marked as a critical zone. The note “IF GOLD BREAKS THIS AREA WE CAN CLOSE OUR BEARISH TRADES” implies this is a key invalidation level for bearish bias.
• Target Point (Below 3190): Indicates a bearish target if price breaks the support and continues downward.
3. Trade Setup:
• It looks like a continuation short trade is being considered with the expectation that price will break the support zone.
• Good risk management is shown with a clear stop-loss area (above the pink zone) and target level.
4. Additional Thoughts:
• Watch how price reacts at the support zone. If it shows bullish momentum or fails to break strongly, the setup might become invalid.
• Confirmation with a bearish candlestick pattern at the support break could add confluence.

Buy gold, it will continue to 3350!Fundamentals:
Focus on Trump and the Fed;
Technical aspects:
Currently, gold is moving in a fluctuating upward manner, and in the short term, the effective double bottom structure constructed in the area around 3200 and 3220 supports the continued upward movement of gold. In the short term, gold is not very willing to fall, and it has not even been able to fall back below 3300 again. If gold breaks through the 3330-3335 area during the rebound, then gold will inevitably continue to rise to the area around 3350, or even the area around 3380.
Trading strategy:
If gold retreats next, we will mainly focus on the opportunity to go long on gold in the 3315-3305 area; TP: 3350

Daily Analysis- XAUUSD (Tuesday, 6th May 2024)Bias: Bullish
USD News(Red Folder):
-None
Analysis:
-Strong bullish momentum
-Looking for price to reach 0.618 fib level
-Potential BUY if there's confirmation on lower timeframe
-Pivot point: 3300
Disclaimer:
This analysis is from a personal point of view, always conduct on your own research before making any trading decisions as the analysis do not guarantee complete accuracy.

Sell Probably!Hello guys. Do you agree? Market will falling ASAP? I think it is a good option. it maybe a risky position, but lets see.(wink)

Bank Holiday Set up🚨 High Risk Alert!
Seeing unusual volume today — already 50 pips in play from this zone. 👀
Targeting that bullish order block for a potential full reversal into higher highs & premium sell zone. 🌀
Waiting on extra confluences before pulling the trigger on a buy setup.
Let’s see what the New York open brings! 🗽📈
#Forex #TradingUpdate #MarketWatch #NYOpen #PriceAction

Gold update next weekI really wanted to sell at a higher price.
But the selling pressure was very strong, not overcoming the resistance, so I came up with a new strategy to sell gold at a lower price. Do you have any other ideas? Leave a comment.
Limit sell 3255 sl65
Limit sell 3272 sl 82 ( fake break)
Take profit 3178- 3070
---
Limit buy 3070
SL 3048.5 TP 3178
---
Limit buy 2994- 2982
SL 2972 TP 3090- 3170

GOLD 45M CHART PATTERNChart Pattern: Descending Triangle
A Descending Triangle has formed on the 45-minute timeframe — a powerful bearish continuation pattern that reflects a battle between weakening buyers and increasingly aggressive sellers.
Key structure:
The triangle narrowed over time, indicating volatility compression and building pressure.
Pattern Psychology: As price continued to compress, sellers consistently undercut each bullish rally. Buyers held the line — until they couldn’t. The break below the support level marked the moment of surrender, triggering a wave of selling pressure and confirming the descending triangle’s bearish bias.
Resistance Level: Around $3,270
Post-breakdown, the previous support zone near $3,253–$3,270 has now become resistance. This level also aligns with:
The descending trendline from the pattern.
The recent retest zone where price attempted to recover but failed to break higher.
This area is now a critical ceiling — unless broken with force, it reinforces the bearish outlook and invalidates any short-term recovery attempts.
Target Point: $3,150
Based on the measured move technique, the target for this descending triangle is calculated by taking the vertical height of the triangle and projecting it downward from the breakout point.
Breakout Point: ~$3,265
Extended Target: With increased bearish momentum and no significant support until next structure, price is projected toward the key psychological and technical level of $3,150

Start shorting gold and seize the opportunity to make a profit!!Fundamentals:
Focus on Trump and the Fed
Technical aspects:
Gold fell back to around 3253 and then rebounded, and continued to rise to around 3318. The upward momentum in the short term looks particularly strong. According to the current structure, as gold gradually rebounds, off-market buying funds gradually enter the market, pushing gold further up. However, when facing the previous turning point position area of 3325-3335, the market is cautious and it is difficult to break through this area in a short period of time. Therefore, when gold gradually approaches the 3325-3335 area, gold may usher in a wave of retracement in the short term; obviously, the retracement area we can foresee is the 3295-3285 area first.
Trading strategy:
Consider shorting gold in the 3315-3325 area, TP: 3295-3285

XAU/USD For Bullishwait for pull-back near by entry point and then go long
general trend is up trend
have fun :)

XAUUSD (LONG)
Day Trade
Had ABC move price has to come back to retest the breakout of consolidation.

The latest gold strategy analysis and operation guidance📌Fundamentals:
This week, the US economic data was released intensively, and ADP employment, unemployment benefits, GDP and PCE price index were all bullish, but some data showed signs of weakness after Trump's tariff policy. The unemployment rate remained the same as the previous value of 4.2%, while the expected new employment of 130,000 was significantly lower than the previous value of 228,000. The market's concerns about the cooling of the economy provided support for the gold price.
📊Technical side:
Although the 1-hour moving average is still in a dead cross short arrangement, there are signs of turning around. At the same time, after the rebound, gold began to consolidate at a high level instead of continuing to fall, so the momentum of the bears was weakened. So today's closing is critical. Today, gold fell back to around 3230 under pressure from 3270. In the short term, this is a balance range. You can see the shock in this range at night. If gold finally closes above 3270, then gold will most likely continue to rise next week. If it closes below 3240, then gold bears still have a great chance. If you want to operate in the short term, then don't chase it for the time being. Since it is a shock, you can go short first at a high level. If it breaks through 3270, then wait until next week. On the whole, today's short-term operation of gold suggests that the rebound is mainly short, and the callback is supplemented by long. The top short-term focus is on the first-line resistance of 3265-3270, and the bottom short-term focus is on the first-line support of 3200-3197.
🎯Practical strategies:
Strategy 1: Go short when gold rebounds around 3263-3266, with a target around 3230-3210.
Strategy 2: Go long when gold pulls back around 3197-3200, with a target around 3220-3230.

GOLD recovers to initial target, confirmation point continuesOANDA:XAUUSD surged in the first half of trading on Monday (May 5), briefly surpassing the $3,270/ounce mark and marking a daily gain of more than $30. as uncertainty over U.S. tariffs spurred safe-haven flows, supporting gold prices. The Federal Reserve’s interest rate cut in June is also boosting the appeal of non-yielding gold.
Bloomberg reported on Monday that US President Donald Trump plans to impose a 100% tariff on all foreign-made films, which is not a huge deal, but it does escalate the trade war. "I am authorizing the Department of Commerce and the United States Trade Representative to immediately begin proceedings to impose a 100% tariff on all foreign-made films imported into the United States," Trump wrote on his Truth Social social media platform. "We want our movies made in the USA again!"
Gold prices have risen nearly 25% this year, hitting a record high above $3,500 an ounce in April, but have retreated in recent weeks. Bloomberg notes that factors driving gold’s recent rally include safe-haven buying fueled by Trump’s destructive trade and geopolitical policies, as well as speculative demand from China and buying by global central banks.
According to CME's "Federal Reserve Watch" on May 5: The probability of the Federal Reserve keeping interest rates unchanged in May is 96.8%, and the probability of cutting interest rates by 25 basis points is 3.2%.
The probability of the Federal Reserve keeping interest rates unchanged until June is 63.3%, the probability of cutting interest rates by 25 basis points is 35.6%, and the probability of cutting interest rates by 50 basis points is 1.1%.
Technical outlook analysis OANDA:XAUUSD
On the daily chart, gold is still bullish as the price action remains above the important support EMA21. At the same time, the price channel that is noted as the main long-term trend channel remains stable.
On the other hand, the Relative Strength Index (RSI) is also showing signs of weakness as it falls to approach the 50 level, which is noted as the closest support in terms of momentum.
Going forward, if gold rebounds above $3,245, it could rebound to the short-term target of $3,267, more than the 0.382% Fibonacci retracement level, and then the full price point of $3,300.
As long as gold remains within the price channel, its long-term trend remains bullish, but the risk of a deeper correction is when the 0.50% Fibonacci retracement level is broken below, once this level is broken below gold is at risk of further selling to $3,163 in the short term. This also means that technically gold is in an ideal support area for bullish expectations, long positions should be protected below the 0.50% Fibonacci retracement level.
In the coming period, gold has technical conditions that favor a bullish recovery, and the notable points will be listed as follows.
Support: 3,245 – 3,228USD
Resistance: 3,267 – 3,270 – 3,292USD
SELL XAUUSD PRICE 3304 - 3302⚡️
↠↠ Stop Loss 3310
→Take Profit 1 3296
↨
→Take Profit 2 3290
BUY XAUUSD PRICE 3173 - 3175⚡️
↠↠ Stop Loss 3169
→Take Profit 1 3181
↨
→Take Profit 2 3187

GOLD Will Grow! Buy!
Please, check our technical outlook for GOLD.
Time Frame: 4h
Current Trend: Bullish
Sentiment: Oversold (based on 7-period RSI)
Forecast: Bullish
The market is approaching a key horizontal level 3,257.82.
Considering the today's price action, probabilities will be high to see a movement to 3,352.14.
P.S
We determine oversold/overbought condition with RSI indicator.
When it drops below 30 - the market is considered to be oversold.
When it bounces above 70 - the market is considered to be overbought.
Disclosure: I am part of Trade Nation's Influencer program and receive a monthly fee for using their TradingView charts in my analysis.
Like and subscribe and comment my ideas if you enjoy them!

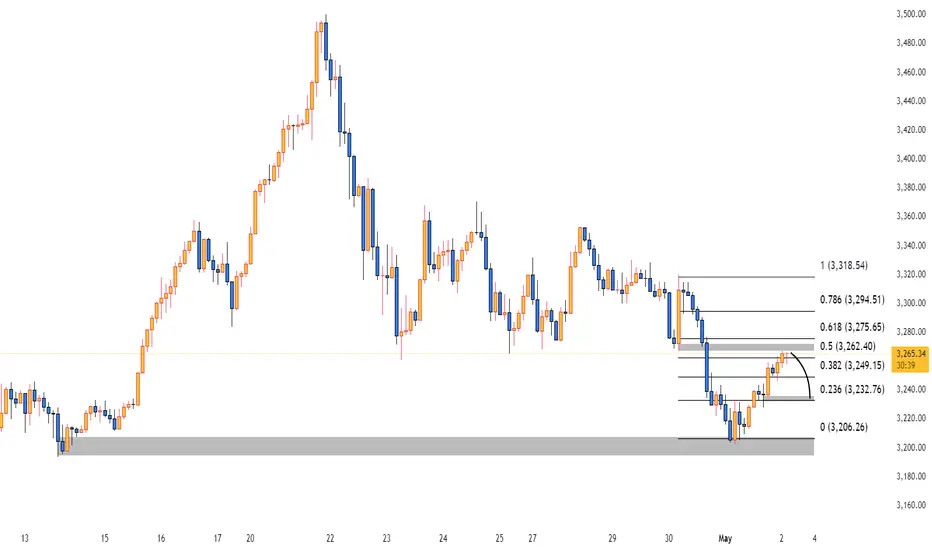
XAUUSD Analysis🟡 XAUUSD Analysis – May 2, 2025
Chart Overview:
Price is reacting near the 0.5–0.618 Fibonacci retracement zone (~3262–3275), a key supply area.
A bearish rejection candle is forming at 3264.51, showing resistance.
The projection curve on the chart suggests a potential pullback to the 0.236 (3232.76) or even 0 (3206.26) level.
🧠 Fundamental Catalyst (Today’s NFP):
If the NFP comes out weak (138K or lower) as expected:
USD may weaken → gold could break above 3275 and aim for 3294 or higher.
If NFP beats expectations significantly (e.g., above 200K):
Strong USD → This bearish setup could play out → Gold may drop toward 3232 or 3206.
📉 Signal (Short-term idea):
Bias: Bearish below 3275
Entry: Sell near 3265–3275 (supply zone)
TP1: 3232
TP2: 3206
Gold Price Analysis May 5The D candle cluster appears with the sellers still dominating. 3270 is still playing a key role in reversing the trend.
The h1 structure is creating a false break in the 70 zone and wants to continue falling in the corrective downtrend. Pay attention to the 3263 break zone in the European session, when breaking this zone, Gold will form an uptrend and the possibility of breaking the 3270 zone is very high. 3285 will be the next reaction zone when breaking 3270, then the Down wave of Gold will be broken. Gold can reach 3303 when there are retests to the support zones.
In the opposite direction, Gold does not break 3262 and continues to fall, it will be favorable for the downtrend and the possibility of forming a double top pattern and falling sharply is also quite high. The Trendline zone 3243 is considered an important support zone in the near future for the Gold price decline. Next, pay attention to the reaction zone of the daily support around 3225.

GOLD SELL SETUP
To determine the reason behind selling gold at $3263:$3264, let's examine current market conditions and possible factors influencing this decision.
*Possible Reasons:*
- *Resistance Level*: $3263:$3264 might be acting as a resistance level, where gold prices face selling pressure or struggle to break through. This level could be influenced by historical price movements or technical indicators.
- *Profit-Taking*: Investors might be selling gold at this price range to secure profits, especially after recent gains. This decision could be driven by market volatility or shifts in sentiment.
- *Market Sentiment*: Changes in market sentiment, driven by news or economic data, can impact gold prices. If sentiment is bearish, traders might be more inclined to sell at $3263:$3264.

Gold shortShort position on a LTF .
i think it retraces a little bit and then it continues higher on HTF.

XAU/USD "The Gold" Metal Market Heist Plan (Day Trade)🌟Hi! Hola! Ola! Bonjour! Hallo! Marhaba!🌟
Dear Money Makers & Robbers, 🤑💰✈️
Based on 🔥Thief Trading style technical and fundamental analysis🔥, here is our master plan to heist the XAU/USD "The Gold" Metal Market. Please adhere to the strategy I've outlined in the chart, which emphasizes short entry. Our aim is the high-risk GREEN MA Zone. Risky level, oversold market, consolidation, trend reversal, trap at the level where traders and bullish robbers are stronger. 🏆💸"Take profit and treat yourself, traders. You deserve it!💪🏆🎉
Entry 📈 : "The heist is on! Wait for the Neutral Level breakout then make your move at (3260.00) - Bearish profits await!"
however I advise to Place sell stop orders above the Moving average (or) after the Support level Place sell limit orders within a 15 (or) 30 minute timeframe most NEAREST (or) SWING low or high level for Pullback entries.
📌I strongly advise you to set an "alert (Alarm)" on your chart so you can see when the breakout entry occurs.
Stop Loss 🛑: "🔊 Yo, listen up! 🗣️ If you're lookin' to get in on a sell stop order, don't even think about settin' that stop loss till after the breakout 🚀. You feel me? Now, if you're smart, you'll place that stop loss where I told you to 📍, but if you're a rebel, you can put it wherever you like 🤪 - just don't say I didn't warn you ⚠️. You're playin' with fire 🔥, and it's your risk, not mine 👊."
📌Thief SL placed at the nearest/swing High or Low level Using the 3H timeframe (3360.00) Day/Scalping trade basis.
📌SL is based on your risk of the trade, lot size and how many multiple orders you have to take.
Target 🎯: 3170.00 (or) Escape Before the Target
💰💵💸XAU/USD "The Gold" Metal Market Heist Plan (Scalping/Day Trade) is currently experiencing a Bearish trend.., driven by several key factors.👇👇👇
⚠️Trading Alert : News Releases and Position Management 📰 🗞️ 🚫🚏
As a reminder, news releases can have a significant impact on market prices and volatility. To minimize potential losses and protect your running positions,
we recommend the following:
Avoid taking new trades during news releases
Use trailing stop-loss orders to protect your running positions and lock in profits
💖Supporting our robbery plan 💥Hit the Boost Button💥 will enable us to effortlessly make and steal money 💰💵. Boost the strength of our robbery team. Every day in this market make money with ease by using the Thief Trading Style.🏆💪🤝❤️🎉🚀
I'll see you soon with another heist plan, so stay tuned 🤑🐱👤🤗🤩

Gold Sellers Incoming!!Fed holding rates steady this week and the technicals show strong signs of a corrective phase coming on gold.
