Gold Bulls Are Loading — Don’t Miss the Fair Value Launch Zone🔍 XAUUSD 30M | Smart Money Breakdown
Gold just gave a liquidation + FVG bounce setup with a high-probability bullish reaction.
Let’s break it down like a sniper 🧠👇
🔻 1. Falling Channel Structure
Gold’s been grinding down in a neat descending channel, consistently taking out liquidity beneath swing lows.
This compression usually ends in aggressive expansion — and Smart Money knows it.
🔁 2. FVG Reclaim = Institutional Entry Zone
The chart shows a Fair Value Gap (FVG) perfectly respected around $3,226 – $3,236.
Price dipped into this imbalance and is now reacting — textbook Smart Money entry.
You're seeing clear demand stepping in after a sell-side liquidity sweep.
📈 3. Target = Upper Channel + Imbalance Fill
If momentum holds, Gold likely reaches for the upper channel resistance and fills the imbalance zone up to ~$3,280+.
That’s your primary draw on liquidity.
🎯 4. Trade Plan (RR ~3:1)
📍 Entry: Around FVG zone ($3,226–$3,236)
❌ Stop-Loss: Below the FVG zone
✅ TP: $3,280 (upper channel tap)
Smart Money is entering early while retail waits for confirmation breakouts 👀
🧩 Key Confluences:
✅ Falling Channel
✅ Fair Value Gap Tap
✅ Bullish Engulfing Response
✅ Clean RRR Setup
✅ Liquidity Sweep Prior to Entry
📊 Summary:
This setup screams Smart Money Accumulation. Gold hunts the lows, reclaims the imbalance, and is now gearing up for a bullish run. The reaction off the FVG is your golden ticket.
Let price work — don’t chase, just manage risk like a pro.
💬 Comment “💰 XAU Sniper Setup” if you caught this one early!
⚔️ Follow @ChartNinjas88 for elite Smart Money plays.
👀 Tag a trader still shorting this range 😅
XAUUSD trade ideas

GOLD BUYGreetings traders this is my analysis on Gold and it is a Long shot for a Buy.
📊 Technical analysis of gold (XAU/USD) — 4h timeframe
🔺 Formation: Head & Shoulders
The pattern is now even more clearly presented with:
Left shoulder – a smaller consolidation move.
Head – a higher peak (higher high).
Right shoulder – a weaker attempt to recover, which confirms the loss of bullish strength.
Usually, such a pattern is followed by a corrective move downwards (which has already been partially seen).
🔄 Potential trend change zone
Highlighted support in the zone:
3,162 – 3,128 USD — very important for confirming the bullish scenario.
The shown "bounce zone" suggests a possible purchase if the price bounces from this area.
📈 Predicted path
Expected:
Fall to support (around 3,150–3,130).
Reversal and continuation of the uptrend.
Target zone: 3,503 – 3,505 USD.
✅ Conclusion and strategy:
Scenario 1 (main): Buy zone between 3,160–3,130 if price action signal is seen (pin bar, engulfing).
Target: 3,500+
Stop loss: below 3,120 (below support).
Scenario 2 (riskier): If price does not bounce from that zone — possible further deepening towards 3,080–3,000.
Dear Traders like,comment let me know what do you think

XAUUSD Bullish or bearish Detailed AnalysisXAUUSD is currently trading around 3380, continuing its bullish momentum as previously anticipated. The price action has followed the projected path, delivering substantial profits for those positioned early. The next key resistance level is at 3450, aligning with the upper boundary of the ascending channel.
Fundamentally, gold's rally is supported by heightened safe-haven demand amid ongoing geopolitical tensions and a weakening U.S. dollar. Investors are closely watching the upcoming Federal Reserve meeting, with expectations leaning toward a dovish stance, which could further bolster gold prices .
Technical indicators suggest that the bullish trend remains intact, with the price maintaining its position above key moving averages. However, traders should be cautious of potential pullbacks as the market approaches overbought conditions.
In summary, XAUUSD is on track toward the 3450 target, supported by both technical and fundamental factors. Traders should monitor key resistance levels and macroeconomic developments to manage their positions effectively.

Gold (XAU/USD) Analysis – Technical + Fundamental OutlookTechnical Outlook
Gold is currently trading inside a descending channel and has reached the midline, which is acting as dynamic resistance.
📍 Key Levels:
Resistance: 3310 – 3320 (aligned with the midline of the channel) – price has not yet confirmed a breakout above this zone
Next Bullish Targets: 3350 – 3358 / 3385 – 3390
Support Zone: 3270 – 3280 (potential bullish re-entry area)
🟣 All key price levels are marked on the chart with light purple lines for clarity.
🟠 RSI is near 65, showing bullish momentum but approaching overbought territory, signaling a possible short-term pullback.
🔁 Likely scenario: A minor correction toward 3270–3280 followed by continuation toward 3350+ if support holds.
Fundamental Context
The ISM Services PMI came in stronger than expected (51.6 vs. 50.2 forecast), reflecting economic resilience in the U.S. This typically supports the USD and weighs on gold, but:
Rising tariff threats from Trump raise recession concerns.
Services Prices Index rose to 65.1, signaling growing inflation pressures.
These inflation concerns may impact the Fed’s upcoming rate decisions.
Central bank demand and geopolitical risks continue to support gold medium-term.
Summary
Despite being inside a descending channel, gold is showing short-term bullish strength. A confirmed break above 3320 could open the way toward 3350+. Otherwise, a pullback to the 3270–3280 area may offer the next setup.

Hanzo : Gold15m : Reversal Zone / Next Move is Confirmed🆚 Gold – Hanzo’s Strike Setup
🔥 Timeframe: 15-Minute (15M)
——————
💯 Main Focus: Bearish After Retest at 3354
We are watching this zone closely.
———
👌 Market Signs (15M TF):
• Liquidity Grab + CHoCH at 3350
• Liquidity Grab + CHoCH at 3400
• Strong Rejections seen at:
➗ 3325 – Major support / Key level x5 Retest
➗ 3360 – Proven resistance

Gold (XAU/USD) - Bullish Reversal Pattern in Play Hello guys!
Let's analyze Gold!
Gold has recently broken out of a descending wedge pattern, a classic bullish reversal signal, with confirmation coming from a clear bullish divergence near the $3,200 zone. After reaching the target of the descending pattern, the price rebounded sharply and is now forming an ascending channel.
Currently, the price is approaching a key resistance zone around $3,280–$3,290. If bulls manage to push through this level, we could see a rally toward the next major resistance around $3,320 and beyond.
🔍 Key Points:
✅ Descending wedge breakout confirmed
✅ Bullish divergence near the bottom signals a momentum shift
✅ Price respecting ascending channel structure
📈target of long position: $3,290–$3,320
📉 target of short position and the entry for long: $3,240 zone
Outlook: Bullish bias remains valid as long as the price is above the $3,240–$3,250 support area. Watch for a breakout above resistance for further upside continuation.

Gold Bears Back in Control – Targeting 3270 AgainIn my analysis yesterday, I noted that after the false break above 3370 resistance, there was a high likelihood of a reversal, potentially driving Gold back down to the 3270 support zone.
Market Reaction:
• As expected, Gold turned lower after retesting the broken 3370 support, now acting as resistance.
• The price dropped nearly 1000 pips, which has become the new norm for daily Gold fluctuations lately.
W hat’s Next?
• With the current rebound, the 3370 zone should once again act as a barrier.
• The strategy remains to sell rallies, targeting a fresh test of the 3270 support zone.
Until this support is broken, expect very volatile moves, but the broader trend remains bearish
Disclosure: I am part of Trade Nation's Influencer program and receive a monthly fee for using their TradingView charts in my analyses and educational articles.

#GOLD Buy 3222 - 3211#GOLD Buy 3222 - 3211
Stoploss 3189
Breakeven 3222.5
TakeProfit 1: 3224
TakeProfit 2: 3232
TakeProfit 3 :3246
TakeProfit 4: 3258
TakeProfit 5: 3270
Trade at your own risk
Protect your capital
The Wizard 🧙♂️ FDT
Thu May 01 25' 08 AM EST

GOLD (XAUUSD): Your Plan to Buy
The recent fundamentals pumped Gold prices again.
The market is currently trading above a significant
daily resistance.
To confirm a validity of a breakout and to avoid a trap,
I suggest paying close attention to a minor horizontal
range on a 4H time frame.
Your signal to buy will be a 4H candle close above 3388.
It will confirm a breakout and increase the chances that the price will go up.
Goal will be 3435
❤️Please, support my work with like, thank you!❤️
I am part of Trade Nation's Influencer program and receive a monthly fee for using their TradingView charts in my analysis.

Gold’s Short-Term Setup!!!Gold ( OANDA:XAUUSD ) started to fall today after the news " The United States has dropped its tariffs on Chinese goods to 30%, down from a brutal 145%, while China is slashing its own duties on US imports to just 10%, temporarily, for the next 90 days. "
Gold is moving near a Heavy Support zone($3,198-$3,136) .
In terms of Elliott wave theory , it appears that Gold has completed five downwaves , and we should expect Gold to rise at least to the Resistance zone($3,280-$3,245) .
It is possible that selling pressure on Gold will increase again with the opening of the US marke t. But this analysis is in the short term , and it is likely to hit Target before the US market opens.
The Bullish Engulfing Candlestick Pattern can also be a sign of Gold rising , at least in the short term .
I expect Gold to rise to at least $3,241.890.
Note: Stop Loss(SL): $3204.820
Gold Analyze ( XAUUSD ), 15-minute time frame.
Be sure to follow the updated ideas.
Do not forget to put a Stop loss for your positions (For every position you want to open).
Please follow your strategy; this is just my idea, and I will gladly see your ideas in this post.
Please do not forget the ✅' like'✅ button 🙏😊 & Share it with your friends; thanks, and Trade safe.

XAU/USD..gold 15M chart pattern..Im planning a gold (XAU/USD) trade based on a trend line breakout strategy. Here's a breakdown of your setup:
**Trade Summary:**
- **Action:** SELL GOLD
- **Entry Price:** 3384
- **Target 1 (TP1):** 3352 (-32 points)
- **Target 2 (TP2):** 3322 (-62 points)
- **Strategy:** Trend line breakout (likely a breakdown below support).
### Key Considerations:
1. **Confirmation:**
- Ensure the trend line breakout is confirmed (e.g., a close below the trend line with momentum, high volume, or candlestick patterns like a bearish engulfing).
- Watch for retests of the broken trend line (now resistance) for added validity.
2. **Risk Management:**
- Place a stop-loss (SL) above the trend line or a recent swing high (e.g., 3405–3415, depending on volatility).
- Risk-reward ratio: TP1 offers ~1:1 if SL is ~30 points, TP2 ~1:2.
3. **Targets:**
- TP1 (3352): Partial profit-taking level.
- TP2 (3322): Final target, possibly near a support zone (adjust based on price structure).
4. **Market Context:**
- Check higher timeframes (H4/Daily) for alignment with the downtrend.
- Monitor USD strength, yields, or geopolitical news impacting gold.
Would you like help refining the stop-loss or analyzing the chart structure further?

Gold is expected to fall below 3300, continue to short gold!Fundamentals:
1. Pay attention to whether the geopolitical conflicts escalate, including the situation between India and Pakistan, Russia and Ukraine, and the situation between the United States and Iran, etc.
Technical aspects:
Although the gold price gradually rebounded after hitting 3320 points, the current rebound momentum is relatively weak. The gold price has turned from strong to weak, and the short-term "M"-shaped top structure formed by 3435 points and 3414 points above has suppressed the upward space of the gold price. Therefore, we still focus on shorting gold after the rebound. First, we focus on the resistance area of 3355-3365 points above. If the gold price rebound fails to successfully break through this area, the gold price will fall again and is expected to continue to fall to around 3280 points.
Trading strategy:
Consider shorting gold after gold rebounds to the 3355-3365 area, target price: 3340

GOLD/USD showing short-term corrections during the downtrendPrice Action Overview
Current Price: $3,389.030
Change: -47.536 (-1.38%) at the time of the snapshot.
Recent High: Around $3,453
Support Levels:
$3,370.793
$3,236.478
$3,201.685
Resistance Levels:
$3,393.756
$3,453.443
Technical Indicators & Patterns
Price Zones:
A red shaded area near the top indicating a strong resistance zone.
Multiple green shaded boxes below suggesting prior demand zones (support).
Trade Markers:
"B" = Buy signals (e.g., on May 3–4, where a rally followed)
"R" = Resistance/reversal points
"T" = Possibly a target or technical level
Volume Spikes:
Notable spike on April 23 (2.619M) and another smaller one around April 30 (568.623K).
Price Movements:
Recent Rally: A sharp upward movement from early May, rising from support near $3,200 to resistance at ~$3,450.
Corrections: Several pullbacks marked (-0.80%, -0.95%, etc.), showing short-term corrections during the downtrend and consolidation phases.
Percentage Gains/Losses:
Ranges from minor gains (0.67% to 1.19%) to losses (e.g., -0.95%) across various candles, highlighting short-term trading opportunities.

HelenP. I Gold can rebound from trend line to resistance levelHi folks today I'm prepared for you Gold analytics. After forming a local bottom around the 3190 - 3210 support zone, the price has rebounded and is now testing the upward trend line once again. This level has consistently acted as dynamic support throughout the recent bullish structure, confirming its relevance and strength. Buyers have shown clear interest in defending this area, and the reaction near this level further strengthens the bullish sentiment. Notably, the market is recovering from a correction phase that followed the previous local peak near the 3350 - 3370 resistance zone. Price has moved within a wide range, creating opportunities for both accumulation and further upside. The chart also shows how Gold is forming a higher low, which supports the continuation of the current trend. If the trend line continues to hold, I expect the price to move toward the resistance area, with my goal located at 3350 points - the key breakout level. Given the price reaction, support structure, and trend confirmation, I remain bullish. If you like my analytics you may support me with your like/comment ❤️

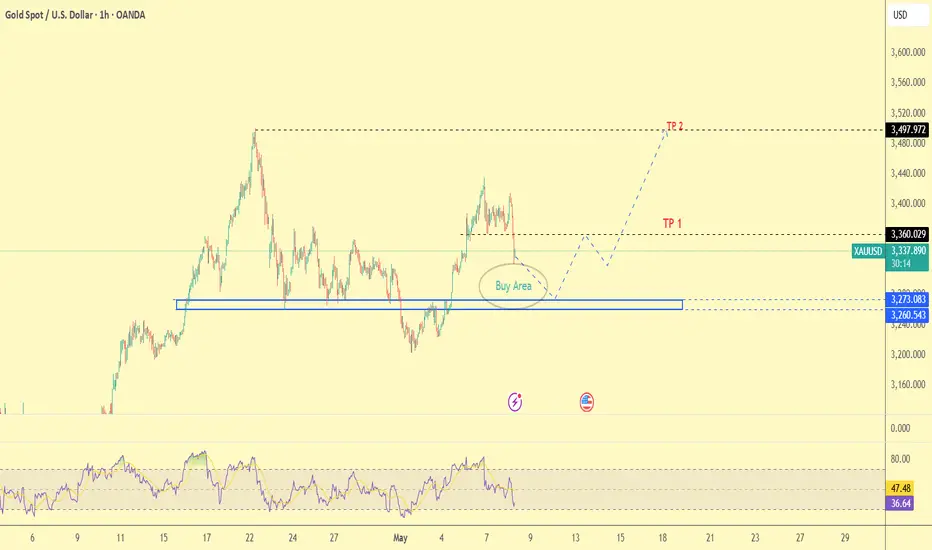
GOLD Trade Plan 08/05/2025Dear Traders,
after FOMC and After Powell's speech, we saw heavy fluctuations in gold. I expect the price to drop below the 3300 zone, which is a buying area, and from there, we could see a strong move toward the all-time high.
If you enjoyed this forecast, please show your support with a like and comment. Your feedback is what drives me to keep creating valuable content."
Regards,
Alireza
GOLD Technical Analysis - Deeper Pullback in PlayOANDA:XAUUSD remains within a broader ascending channel, but recent price action suggests that the market is undergoing a deeper corrective phase. Following a prolonged bullish rally, price appears overextended and is now pulling back more decisively.
This correction aligns with expectations for a healthy retracement after such strong upward momentum. I anticipate that the pullback will extend further toward the $3,160 level, a key technical level defined by the confluence of horizontal support, ascending trendline support, and the 0.618 Fibonacci retracement of the latest bullish impulse.
This zone will be critical for determining whether the broader bullish structure remains intact. If price holds at this level and shows signs of reversal, it may present a strong re-entry opportunity for buyers. However, a decisive break below this zone would invalidate the current bullish structure and open the door to a deeper correction.
Always confirm your setups and trade with a proper risk management.
Best of luck!

Gold latest strategy signalsGold started to pull back today, with a negative gap at the opening.
I expect the price to rebound from the 3202-3220 range to the 3270 range.
Above 3270 ---> 3300-3330-3400
Below 3270 ---> My final target is 3160-3080.

Bearish Cypher Harmonic PatternGold prices might drop based on the Cypher harmonic pattern! 📉
Keep an eye on the charts, traders.

Gold XAUUSD Move 06.05.2025🔹 BUY-1: 3350–3355 Zone
Conditions to Enter:
Support must hold at the 3350–3355 zone.
Wait for a clear bullish M15 candle close above the support area to confirm strength.
Rationale:
This zone overlaps with a Fresh Demand Zone identified on your chart.
Entry here takes advantage of potential accumulation and demand absorption.
It's an early entry with a tighter stop loss (just below 3346–3350).
Ideal Setup:
Stop Loss: Below 3346.
Target: Near 3380–3400 zone or higher depending on momentum.
🔹 BUY-2: 3380–3385 Zone
Conditions to Enter:
Price must break above the 3380–3385 resistance zone.
Wait for a successful retest and bullish confirmation (engulfing/imbalance/M15 close above).
Rationale:
This is the breakout and retest trade mentioned on the chart.
Entering after confirmation reduces risk of a fakeout.
Aligns with institutional breakout behaviors.
Ideal Setup:
Stop Loss: Below the retest candle or previous structure (~3370 area).
Target: 3410–3430+ depending on R/R and momentum continuation.
Kindly show your support by follow, comment and share.

Gold trend and operation ideasThe weak signal of short-term gold technical indicators reminds investors to be alert to the risk of pullback. The 1-hour gold moving average crosses downward in a short position. Unless there is sudden positive news about gold over the weekend and gold directly breaks through $3,370, then gold may have another wave of rise. At present, there is good news of a ceasefire between India and Pakistan and Russia and Ukraine over the weekend. Therefore, in the short term, gold will continue to be under pressure at 3,350-55 and is mainly short.

Gold Intraday Trading Plan 5/9/2025Gold has broken 3360 yesterday and tested 3300. Currently in daily timeframe, it is still bullish. As long as it is above 3270, I am bullish on gold.
I have two strategies for buying orders today.
1. Buy from 3270
2. Buy if 3330 broken
We can target 3360 for today.

Buying every dip on Gold / Fed sessionTechnical analysis: Wednesday’s session Inverted Hammer practically took Gold nowhere as Hourly 1 chart remained ranged within Higher High’s Upper and Lower zone, closing out last and this week on an expected positive note. The Monthly (#1M) candle remains on decent gains (# +11.57%) and the last two sessions on the second Highest Volume throughout April - May (this is translated to Gold’s cyclical behavior which I spotted lately when #2-High Volumed sessions are delivered, strong move follows). Despite the Higher High’s, it is clear that since the #3,400.80 local High’s, Gold undergoes a consolidation phase with equal demand and supply, which according to previous models is an Resistance zone preparation for the next leg Lower or Higher regarding Weekly chart (#1W). I remain idle until Fed announcement while Buying every dip last #2-session horizon.

XAUUSD MARKET OUTLOOKPrice consolidates at 3329.65 ahead of US FED INTEREST RATE CUT what do we expect next? Technically, price has found support around 3219.18 I anticipate more bullish price action to develop away from a 50% Fibonacci retracement level (3329.65)
