DAX Post Election Potential Bullish ContinuationDAX price still seems to exhibit signs of potential bullish continuation (during the current post election period) as the price action may form another credible Higher Low with multiple confluences from key Fibonacci and Support levels.
Trade Plan :
Entry @ 22653
Stop Loss @ 22014
TP 1 @ 23292 (Before All Time High)
TP 2 @ 23931 (After All Time High)
Move Stop Loss to Break Even if TP1 hits.
GER30 trade ideas

DAX Breakout or Fakeout? Long Setup to 23,300The German DAX index presents an opportunity for a long position, targeting the 23,300 price zone. The current price action suggests a retracement toward previous highs before confirming a continuation. With this in mind, I have executed a long position, monitoring key technical levels for potential reactions.
On the fundamental side, the market remains sensitive to geopolitical and economic developments. President Trump’s renewed tariff threats on EU exports have introduced fresh uncertainty, while domestic tensions in Germany over fiscal policy further contribute to volatility. Additionally, corporate earnings are mixed, with Daimler Truck reporting strong Q4 results, whereas BMW shares plummeted due to weaker-than-expected forecasts.
Given these factors, the DAX remains in a reactive phase, and the upcoming macroeconomic events, particularly Eurozone inflation data and Federal Reserve commentary, will play a crucial role in shaping sentiment.
Technical Analysis:
• Entry: Long position initiated at key structural support.
• Target: 23,300 price zone, assessing momentum near previous highs.
• Support Levels: Watching the 22,600–22,700 range for potential rebounds.
• Indicators: The price remains above key moving averages, and the Fib retracement aligns with bullish continuation potential.
Fundamental Analysis:
• Trade Tensions: Trump’s tariff threats on EU exports and reciprocal measures could introduce short-term uncertainty.
• Domestic Politics: German fiscal policy debates may weigh on market sentiment.
• Corporate Earnings: Daimler Truck outperforms, while BMW struggles, adding mixed signals to investor outlook.
• Upcoming Catalysts: PMI data and inflation reports from the Eurozone could determine the next major move.
DAX’s price action is aligned with the broader equity market reaction, and if the index maintains its momentum above key technical levels, the 23,300 target remains in play. Managing risk and reassessing based on market developments will be key.
Note: Please remember to adjust this trade idea according to your individual trading conditions, including position size, broker-specific price variations, and any relevant external factors. Every trader’s situation is unique, so it’s crucial to tailor your approach to your own risk tolerance and market environment.

Weekly Technical AnalysisStart your week by identifying the key price levels and trends.
The SpreadEx Research team has analysed the most popular markets, including stocks, indices, commodities & forex.
--------------------------------------------------------------------------------------------------------------
Analysis
Germany 40 maintains a bullish trajectory, with price action at 22 949 firmly above its 20‐day VWAP of 22 737—indicating an impulsive upswing. The RSI at 57 points to moderate upward momentum, while support at 22 120 could cushion any pullbacks. Resistance is located at 23 354, where a decisive break may open further upside.
UK 100 retains an overall bullish trend but has moved into a corrective posture, trading at 8 631 just below its 20‐day VWAP of 8 684. Momentum has softened, as suggested by the RSI reading of 47. Key support sits at 8 482, while 8 885 serves as the next major barrier against a renewed climb.
Wall Street extends its bearish momentum, posting 41 268 and remaining well under the 20‐day VWAP of 42 652. With an RSI of 30, prices are creeping toward oversold territory, signaling persistent downside pressure. Support is noted at 40 701, and any recovery attempt would first target 44 603 as immediate resistance.
Brent Crude stays locked in a bearish, impulsive swing, currently at 7 100—still beneath its 20‐day VWAP of 7 230. The RSI of 45 reveals ongoing selling pressure, though not at an extreme. Sellers will be eyeing a break below 6 791 support to drive the next leg down, while 7 471 stands as a hurdle to further recovery.
Gold has shifted to a more forceful bullish phase, trading near 2 990 above the 20‐day VWAP of 2 921. An RSI value of 68 signals robust momentum, albeit not yet fully overbought. Initial support waits at 2 841, while a push through 3 001 resistance would likely confirm another leg higher.
EUR/USD continues its upward march, standing at 1.0883 in an impulsive move that surpasses the 20‐day VWAP of 1.0676. With an RSI reading of 70, the pair flirts with overbought conditions, yet strength remains evident. Should prices pull back, 1.0255 is the safety net, whereas 1.1086 is the next notable ceiling for potential gains.
GBP/USD persists in its bullish ascent at 1.2940, reinforcing an impulsive stance above the 20‐day VWAP of 1.2791. Momentum remains elevated (RSI 68), edging closer to overbought but not quite there yet. Support around 1.2504 underpins any corrective slide, while 1.3088 may attract buyers if the rally continues.
USD/JPY upholds its bearish direction, quoted at 148.85—still below the 20‐day VWAP of 148.00 in an impulsive manner. An RSI of 45 indicates moderate downward force, though not oversold. The pair’s nearest support resides at 146.84, while a climb above 150.83 would be required to test the current downtrend’s resilience.

Germany 40 – Historic Vote and Trump to Jolt VolatilityThe Germany 40 rallied over 2% back to 23,000 on Friday as the news broke that Chancellor in waiting Friedrich Merz’s Conservatives and the Green party, whose support he needs, had reached an agreement, which could see his landmark infrastructure and defence spending package pass into law.
It had already been a volatile week of trading up to that point, after President Trump aimed his tariff assault firmly at the EU, verbally threatening on social media to add tariffs of 200% on exports of alcoholic goods from Europe. This was in response to the retaliatory penalties the EU had imposed back on the US, after President Trump’s proposed 25% tariffs on steel and aluminium exports went into force on Wednesday.
Now, at the start of this new week, while sentiment has turned back down for US indices after weekend comments from US Treasury Secretary Bessant, where he stated he isn’t worried about the recent sell off in US stocks, dismissing it as a healthy correction. The Germany 40 remains steady as traders await fresh updates on any potential escalation of a US/EU trade war, but more importantly tomorrow’s parliamentary approval of Germany’s historic spending plans.
The question is, could this vote boost the Germany 40 index back to towards all-time highs at 23474 and possibly beyond, or is it a sell the fact moment, which could see a bout of profit taking back down to lower levels?
Technical Update:
While US equity indices have encountered strong selling pressure of late, there has been evidence of a rotation of investor positioning, where sales of US equities, have prompted buying of European stocks.
This has seen further strength emerge for the Germany 40 index, with only brief price selloffs being seen before buyers are again found at higher levels. This has maintained the positive pattern of higher highs and higher lows in price.
With the Bundestag vote due in Germany on Tuesday, this may have important implications for future market sentiment and price trends.
Going into this important news, traders should be aware of possible support and resistance levels to monitor just in case more directional moves in price develop.
Potential Resistance Levels:
As we have said, so far at least this remains a positive trending price pattern, and despite last Monday’s initial weakness, price action overall was constructive. This saw a rally develop from Tuesday’s 22240 (March 11th) low, as once again, buyers were found at a higher level than before. As the chart above shows, the earlier low was at 22111, on February 21st.
This upside move in price now shifts the focus for traders to a possible resistance level at 23474, which is the March 6th all-time high. Having held before this level will likely need to be broken on a closing basis, if a more extended phase of price strength is to possibly emerge.
Closing breaks above this 23474 all-time high, could trigger continued price strength, which in turn, might open potential for moves towards 23944, which is the 38.2% Fibonacci extension of the March sell-off (23474 on March 6th to 22240 on March 11th) and if this gives way, even towards 24234, which is the higher 61.8% extension level.
Potential Support Levels:
Any negative reaction to Tuesday’s vote, may see downside pressure build and as the chart above shows, the first support could prove to be 22766, which is equal to half of last week’s price strength. This level giving way on a closing basis, might highlight signs of increasing selling pressure and the possibilities for further price declines.
However, if closing breaks below 22766 do materialise then the last correction low from March 11th at 22111 may still be more important to traders.
Closes below this level may show that buyers of the Germany 40 index are no longer willing to buy at higher price levels for the time being, which in turn could lead to a deeper phase of price weakness and retracement of the December 20th 2024 to March 6th 2025 advance.
The material provided here has not been prepared in accordance with legal requirements designed to promote the independence of investment research and as such is considered to be a marketing communication. Whilst it is not subject to any prohibition on dealing ahead of the dissemination of investment research, we will not seek to take any advantage before providing it to our clients.
Pepperstone doesn’t represent that the material provided here is accurate, current or complete, and therefore shouldn’t be relied upon as such. The information, whether from a third party or not, isn’t to be considered as a recommendation; or an offer to buy or sell; or the solicitation of an offer to buy or sell any security, financial product or instrument; or to participate in any particular trading strategy. It does not take into account readers’ financial situation or investment objectives. We advise any readers of this content to seek their own advice. Without the approval of Pepperstone, reproduction or redistribution of this information isn’t permitted.

GER40/DAX "Germany40" CFD Index Market Heist Plan🌟Hi! Hola! Ola! Bonjour! Hallo! Marhaba!🌟
⚔Dear Money Makers & Thieves, 🤑 💰✈️
Based on 🔥Thief Trading style technical and fundamental analysis🔥, here is our master plan to heist the GER40/DAX "Germany40" CFD Index Market. Please adhere to the strategy I've outlined in the chart, which emphasizes short entry. Our aim is the high-risk Green Zone. Risky level, oversold market, consolidation, trend reversal, trap at the level where traders and bullish thieves are getting stronger. 🏆💸Book Profits Be wealthy and safe trade.💪🏆🎉
Entry 📈 : "The vault is wide open! Swipe the Bearish loot at any price - the heist is on! profits await!" however I advise placing Sell limit orders within a 15 or 30 minute timeframe. Entry from the most recent or swing low or high level should be in retest.
Stop Loss 🛑: Thief SL placed at (23000) swing Trade Basis Using the 2H period, the recent / swing high or low level.
SL is based on your risk of the trade, lot size and how many multiple orders you have to take.
🏴☠️Target 🎯: 21400 (or) Escape Before the Target
🧲Scalpers, take note 👀 : only scalp on the Short side. If you have a lot of money, you can go straight away; if not, you can join swing traders and carry out the robbery plan. Use trailing SL to safeguard your money 💰.
GER40/DAX "Germany40" CFD Index Market is currently experiencing a Neutral trend to Bearish., driven by several key factors.
📰🗞️Read the Fundamental, Macro Economics, COT Report, Seasonal Factors, Intermarket Analysis, Sentimental Outlook, Future trend predict.
Before start the heist plan read it.👉👉👉
📌Keep in mind that these factors can change rapidly, and it's essential to stay up-to-date with market developments and adjust your analysis accordingly.
⚠️Trading Alert : News Releases and Position Management 📰 🗞️ 🚫🚏
As a reminder, news releases can have a significant impact on market prices and volatility. To minimize potential losses and protect your running positions,
we recommend the following:
Avoid taking new trades during news releases
Use trailing stop-loss orders to protect your running positions and lock in profits
💖Supporting our robbery plan 💥Hit the Boost Button💥 will enable us to effortlessly make and steal money 💰💵. Boost the strength of our robbery team. Every day in this market make money with ease by using the Thief Trading Style.🏆💪🤝❤️🎉🚀
I'll see you soon with another heist plan, so stay tuned 🤑🐱👤🤗🤩

DAX40 The Week Ahead 17th March '25DAX40 INTRADAY bullish & oversold, key trading level is at 22300
This communication is for informational purposes only and should not be viewed as any form of recommendation as to a particular course of action or as investment advice. It is not intended as an offer or solicitation for the purchase or sale of any financial instrument or as an official confirmation of any transaction. Opinions, estimates and assumptions expressed herein are made as of the date of this communication and are subject to change without notice. This communication has been prepared based upon information, including market prices, data and other information, believed to be reliable; however, Trade Nation does not warrant its completeness or accuracy. All market prices and market data contained in or attached to this communication are indicative and subject to change without notice.

DAX Bullish continuation. With Friday's bull run on the DAX, I see either a retracement to the two most obvious fib levels and then a bullish continuation. Alternatively this view this chart could look like the right shoulder of a head and shoulders pattern with a retest of the uptrend at about 23,400; but I think this is less likely, and a pullback with a bullish continuation to test all-time highs is most likely. Either way, I am bullish on the DAX/GER40.

DAX40 INTRADAY Bullish Breakout retest at 22300The DAX (DE40) equity index is exhibiting a bullish sentiment, driven by the prevailing longer-term uptrend. The recent intraday price action indicates a sideways consolidation near the breakout level, which previously acted as resistance and has now transformed into a new support zone.
Key Support and Resistance Levels:
Support Zone: The primary support level to watch is at 22,300, which marks the previous consolidation price range. A corrective pullback towards this level, followed by a bullish rebound, could signal a continuation of the upward momentum.
Upside Targets: If the bullish bounce from the 22,300 level holds, the index may target the next resistance at 23,000, followed by 23,460 and 23,686 over a longer timeframe.
Bearish Scenario: A confirmed loss of the 22,300 support level, with a daily close below it, would negate the bullish outlook and potentially trigger a deeper retracement. In this case, the index could retest the next support levels at 22,129 and 21,828.
Conclusion:
The bullish sentiment on the DAX (DE40) remains intact as long as the 22,300 support level holds. Traders should monitor the price action closely at this key level. A successful bounce may offer long opportunities toward the upside targets. However, a break below 22,300 could open the path for further downside correction, warranting caution for bullish positions.
This communication is for informational purposes only and should not be viewed as any form of recommendation as to a particular course of action or as investment advice. It is not intended as an offer or solicitation for the purchase or sale of any financial instrument or as an official confirmation of any transaction. Opinions, estimates and assumptions expressed herein are made as of the date of this communication and are subject to change without notice. This communication has been prepared based upon information, including market prices, data and other information, believed to be reliable; however, Trade Nation does not warrant its completeness or accuracy. All market prices and market data contained in or attached to this communication are indicative and subject to change without notice.

DAX to rise further?DAX Poised for Further Gains
Risk sentiment remains positive, and the DAX could benefit from a potential market turnaround. Despite recent weakness, hedging options suggest a recovery, with put option levels possibly marking a bottom. Meanwhile, a declining VIX signals easing market anxiety.
DAX Outlook:
- Supported by improving global sentiment
- Potential Ukraine ceasefire could boost momentum
- Falling oil prices may further support economic growth
At the same time, uncertainty could drive gold and silver higher, with silver benefiting from the positive stock market environment.
Conclusion: The DAX remains well-positioned for further gains. A decisive breakout above resistance levels could fuel the next leg of the rally.

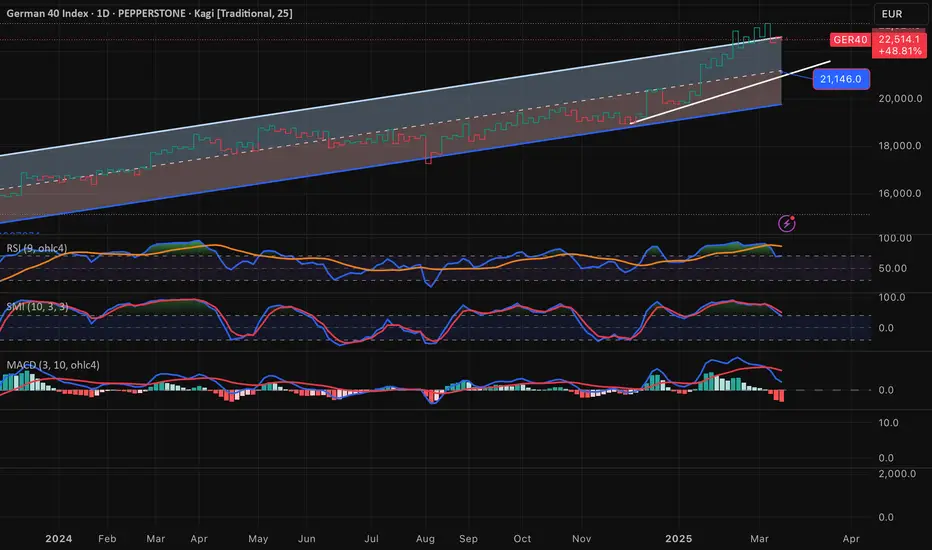
GER40-SELL strategy Daily chart - KAGIIt feels we may see further downward movement, as we are still above regression channel, and MACD is negative and a high RSI still.
Strategy SELL @ 22,500-22,750 and take profit near 21,450 for now.
Rising channel and trendline breakThe price to make a lower low after a false break and a price rejection at the bearish trendline, now the price has broken a small pullback trendline and made a deep pullback, now after the lower low, it will go bearish
WE ONLY TRADE PULLBACKS

GER40 LONG SETUP IDEA - BUY THE DIP📈 LONG SETUP - BUY THE DIP (Swing Trade)
Entry: 22,350 - 22,400
Take Profit (TP): 23,500 (first target), 24,000 (extended target)
Stop Loss (SL): 22,150
Reasoning:
Strong historical support at 22,300 - 22,400.
Bullish divergence on MACD and RSI on 1H and 4H charts.
High timeframe trend remains bullish; expecting continuation after the retracement.
📈 Market Overview & Bias
Daily & 4H Charts:
The GER40 has been in a strong bullish trend over the past few months but is currently experiencing a retracement.
The 21 EMA and 8 EMA are converging, signaling indecision or potential trend exhaustion.
200 EMA remains below price, suggesting long-term uptrend remains intact.
The 100 EMA is acting as resistance on lower timeframes.
Key support zones: 22,300 and 21,900.
Key resistance zones: 23,000 and 23,500.
Lower Timeframes (1H & 15M)
The price is consolidating between the 22,400 - 22,700 range.
A potential reversal pattern is forming on the 15M chart with bullish divergence on RSI and MACD.
ATR values suggest increased volatility, so tight stop losses are necessary.
Key Economic & Geopolitical Considerations
ECB Rate Decision (March 21, 2025)
Hawkish stance → Might push GER40 lower.
Dovish stance → GER40 could break resistance.
US CPI & NFP Reports
Inflation data affecting European stock sentiment.
Strong USD could pressure GER40 downward.
Geopolitical Risks
German & EU economic policies affecting investor sentiment.
Tensions between China/EU and EU/USA on trade policies could add volatility.
mportant: this is not personalized financial advice. It’s an illustration of how one might combine risk management principles with the support/resistance zones in play.
Final Note & Disclaimer
All market scenarios carry probabilities, not certainties. Technical signals are best combined with macro fundamentals (e.g., interest rates, USD behavior, geopolitical risks) to form a well‐rounded market view. This consolidated analysis serves an educational purpose—always do additional research or consult a licensed professional before making trading or investment decisions.

DAX Rally in site?With the DAX currently making higher lows and lower highs, I see this as a possible end to the current correction. The DAX has not seen anything like the sell-off of the US30, and with some underlying positive fundamentals, I see a retest of the descending pattern, a fake-out to re-test 22,244, and the a rally back to 23,00 and beyond. Or possibly (tomorrow) a rally straight back through the 22,707s.

Booze Wars... How DAX could react?Now it's time for US and EU to have their public tariff battle. Given that wine, champagne and beer are a huge part of EU export into the US, there might be some pain felt among the MARKETSCOM:DE30 bulls. Let's dig in.
XETR:DAX
Let us know what you think in the comments below.
Thank you.
74.2% of retail investor accounts lose money when trading CFDs with this provider. You should consider whether you understand how CFDs work and whether you can afford to take the high risk of losing your money. Past performance is not necessarily indicative of future results. The value of investments may fall as well as rise and the investor may not get back the amount initially invested. This content is not intended for nor applicable to residents of the UK. Cryptocurrency CFDs and spread bets are restricted in the UK for all retail clients.

DAX , re-test of major trendlineGermany 40 (DE40) - 4H Analysis
Technical Overview:
The price broke below an ascending trendline, signaling a potential trend reversal or deeper correction.
Currently, it's retesting the broken trendline, which could act as resistance.
A drop towards the 21,709 support level is possible if sellers maintain control.
Key Levels to Watch:
Resistance: 22,719 (Current price area - retest zone)
Support: 21,709 (Major level to the downside)
Indicators:
RSI (14) is at 50.46, slightly below the neutral zone, indicating weak momentum.
If RSI continues to drop below 40, it would confirm further downside pressure.
Potential Scenarios:
Bearish Continuation (Higher Probability)
If price rejects the retest of the broken trendline, expect a drop toward 21,709.
RSI moving lower would confirm this move.
Bullish Rebound (Lower Probability)
If price reclaims the broken trendline and closes above 22,800, then buyers could push it higher.
Trading Plan:
Short below 22,719 with a target of 21,709.
Stop loss above 22,900 (invalidates bearish thesis).
Buy only if price breaks back above 22,800 with RSI confirming strength.


GERMANY 3O LONGGERMANY 30 playing along as anticipated in previous analysis .. Drop a comment and interact

LONG GERMANY 40In my opionion, a reversal is likely.
Good risk/reweard ratio.
Sometimes you win, sometimes you lose.
This is not financial advice, make your own decisions.

GER40 Short 1. This trade is with the H4 trend
2. There is no pattern on this trade which could make it a big risk
3. It is overbought on M15 and there is divergence with the next top
4. Stop loss of 200 pips
5. First target profit when M15 goes oversold

DAX H1 | Overlap resistance at 50% FiboDAX (GER30) is rising towards an overlap resistance and could potentially reverse off this level to drop lower.
Sell entry is at 22,840.05 which is an overlap resistance that aligns with the 50.0% Fibonacci retracement.
Stop loss is at 23,037.00 which is a level that sits above the 61.8% Fibonacci retracement and the descending trendline.
Take profit is at 22,251.40 which is a multi-swing-low support.
High Risk Investment Warning
Trading Forex/CFDs on margin carries a high level of risk and may not be suitable for all investors. Leverage can work against you.
Stratos Markets Limited (www.fxcm.com):
CFDs are complex instruments and come with a high risk of losing money rapidly due to leverage. 63% of retail investor accounts lose money when trading CFDs with this provider. You should consider whether you understand how CFDs work and whether you can afford to take the high risk of losing your money.
Stratos Europe Ltd (www.fxcm.com):
CFDs are complex instruments and come with a high risk of losing money rapidly due to leverage. 63% of retail investor accounts lose money when trading CFDs with this provider. You should consider whether you understand how CFDs work and whether you can afford to take the high risk of losing your money.
Stratos Trading Pty. Limited (www.fxcm.com):
Trading FX/CFDs carries significant risks. FXCM AU (AFSL 309763), please read the Financial Services Guide, Product Disclosure Statement, Target Market Determination and Terms of Business at www.fxcm.com
Stratos Global LLC (www.fxcm.com):
Losses can exceed deposits.
Please be advised that the information presented on TradingView is provided to FXCM (‘Company’, ‘we’) by a third-party provider (‘TFA Global Pte Ltd’). Please be reminded that you are solely responsible for the trading decisions on your account. There is a very high degree of risk involved in trading. Any information and/or content is intended entirely for research, educational and informational purposes only and does not constitute investment or consultation advice or investment strategy. The information is not tailored to the investment needs of any specific person and therefore does not involve a consideration of any of the investment objectives, financial situation or needs of any viewer that may receive it. Kindly also note that past performance is not a reliable indicator of future results. Actual results may differ materially from those anticipated in forward-looking or past performance statements. We assume no liability as to the accuracy or completeness of any of the information and/or content provided herein and the Company cannot be held responsible for any omission, mistake nor for any loss or damage including without limitation to any loss of profit which may arise from reliance on any information supplied by TFA Global Pte Ltd.
The speaker(s) is neither an employee, agent nor representative of FXCM and is therefore acting independently. The opinions given are their own, constitute general market commentary, and do not constitute the opinion or advice of FXCM or any form of personal or investment advice. FXCM neither endorses nor guarantees offerings of third-party speakers, nor is FXCM responsible for the content, veracity or opinions of third-party speakers, presenters or participants.

DAX Index Technical Analysis – March 12, 2025 (15-Min Chart)1. Trend Identification
Reversal to Bullish Momentum:
The price has broken above the 200-period moving average (red line), indicating a shift from bearish to bullish sentiment.
The Point of Control (POC) at 22,324.82 previously acted as strong support, from which price has bounced.
Volume Confirmation of Bullish Move:
The last 60 bars show an up-volume dominance of +32.10%, confirming that buyers are gaining control.
However, the 120-bar volume is still slightly negative (-1.71%), indicating lingering selling pressure.
2. Key Support & Resistance Levels
Immediate Support: 22,500 - 22,550 (recent breakout zone).
Stronger Support: 22,324 (POC) – a critical level where buyers stepped in.
Immediate Resistance: 22,700 - 22,750 (local resistance zone).
Upside Target: 23,000 - 23,200 (upper trend channel projection).
3. Volume Analysis
Last 120 Bars: Up Vol < Down Vol by -1.71%, showing slight selling pressure.
Last 60 Bars: Up Vol > Down Vol by +32.10%, indicating strong short-term buying activity.
Interpretation:
Bullish Confirmation: Buyers have stepped in aggressively, pushing price above the 200-MA and key support zones.
Watch for Pullbacks: A retracement toward 22,500 - 22,550 could provide a better long entry before continuation.
4. Chart Patterns & Projections
Bullish Continuation Scenario: If price holds above 22,550, it is likely to move toward 23,000 - 23,200 within the ascending channel.
Bearish Pullback Scenario: If price fails to hold 22,500, a retracement to 22,324 or lower is possible.
Trade Setups & Risk Management
1. Long Trade Setup (Bullish Scenario)
Entry: Buy near 22,550 (pullback entry) or above 22,750 (breakout confirmation).
Stop-Loss: Below 22,500 (recent support).
Targets:
First Target: 22,900
Final Target: 23,200 (upper channel resistance).
Risk-Reward Ratio: 1:3 or better.
2. Short Trade Setup (Bearish Pullback Scenario)
Entry: Sell below 22,500 (breakdown confirmation).
Stop-Loss: Above 22,700.
Targets:
First Target: 22,400
Final Target: 22,324 (POC & key support).
Risk-Reward Ratio: 1:2 or better.

Bullish bounce off pullback support?DAX40 (DE40) is falling towards the pivot and could bounce to the 1st resistance.
Pivot: 22,278.21
1st Support: 21,944.76
1st Resistance: 23,065.37
Risk Warning:
Trading Forex and CFDs carries a high level of risk to your capital and you should only trade with money you can afford to lose. Trading Forex and CFDs may not be suitable for all investors, so please ensure that you fully understand the risks involved and seek independent advice if necessary.
Disclaimer:
The above opinions given constitute general market commentary, and do not constitute the opinion or advice of IC Markets or any form of personal or investment advice.
Any opinions, news, research, analyses, prices, other information, or links to third-party sites contained on this website are provided on an "as-is" basis, are intended only to be informative, is not an advice nor a recommendation, nor research, or a record of our trading prices, or an offer of, or solicitation for a transaction in any financial instrument and thus should not be treated as such. The information provided does not involve any specific investment objectives, financial situation and needs of any specific person who may receive it. Please be aware, that past performance is not a reliable indicator of future performance and/or results. Past Performance or Forward-looking scenarios based upon the reasonable beliefs of the third-party provider are not a guarantee of future performance. Actual results may differ materially from those anticipated in forward-looking or past performance statements. IC Markets makes no representation or warranty and assumes no liability as to the accuracy or completeness of the information provided, nor any loss arising from any investment based on a recommendation, forecast or any information supplied by any third-party.

GER40 ShortGER40 is now net short on regression break.
There is pressure from global stock on this index.
I am considering the correct EA to trade on this pair.
