JAPAN 225 INDEX Bullish Projection CHART
Technical Analysis of Japan 225 Index (4H Chart)
Overview:
The Japan 225 index, as depicted on the 4-hour chart, is currently navigating through a complex pattern with multiple trend lines and Fibonacci retracement levels in play.
RSI signaling bullish technically, within zone of "overvalued." This is in alignment with both Trends and Horizontal Support along with multiple other indicators. Also to note, it is falling towards the 200 EMA, it is about to close a gap on a pattern that has broken out bullish, which aligns with a major trend and horizontal support area, which then takes us to the next trendline, which is a bearish trend trading in a bullish direction. Essentially, this is a really important zone. Price either breaks downward, and likely closes another gap showing in yellow on the chart OR price hits support and we really start to see an upward climb. This movement would be similar to how the SP500 is melting up towards the 6500 range.
Here's a detailed analysis:
Trend Analysis:
Support Trend Line: The price is holding above a key ascending support trend line, which has been in place for several months. This trend line acts as a bullish indicator, suggesting that the index has been in an uptrend.
Descending Resistance Line: There is a descending resistance trend line that the price is approaching. A breakout above this line could signal a continuation of the uptrend and potentially lead to higher targets.
Fibonacci Retracement Levels:
38.2% Retracement: The price is currently testing this level around 39,015.11. This is a common retracement level where price often finds support or resistance.
50% Retracement: Located at 38,015.11, this level could act as a strong support if the price breaks below the 38.2% level.
61.8% Retracement: Around 37,015.11, this is a critical level where a deeper pullback might find support before a potential reversal.
Volume Analysis:
Volume Indicators: There is a noticeable increase in volume at key support and resistance levels, indicating strong buying or selling interest. The recent volume spike suggests significant market activity, which could precede a major move.
MACD (Moving Average Convergence Divergence):
MACD Line and Signal Line: The MACD line is above the signal line, which is typically a bullish sign. However, the histogram shows decreasing momentum, which might indicate a potential slowdown or reversal in the current trend.
Price Targets:
Upside Targets: If the price breaks above the descending resistance trend line, the next resistance levels to watch are around 39,015.11 (38.2% Fibonacci), followed by 40,015.11 and 41,015.11.
Downside Targets: A break below the ascending support trend line could see the price retesting the 50% and 61.8% Fibonacci levels, around 38,015.11 and 37,015.11, respectively.
Conclusion:
The Japan 225 index is at a critical juncture, with multiple technical indicators suggesting both potential continuation of the uptrend and possible consolidation or pullback. Traders should watch for a breakout above the descending resistance or a breakdown below the ascending support for clearer directional cues. Monitoring volume and MACD for confirmation of these moves will be crucial for making informed trading decisions.
JPN225 trade ideas

WHAT'S FLOWING: NIKKEI225 (BULLISH)The JP225 (Nikkei 225) is showing strong upside potential as it breaks higher from key consolidation zones, reflecting renewed buying interest and optimism in the Japanese equities market.
Key Observations:
1. Trend Shift:
• The index has successfully reclaimed critical levels around 38,580.85, confirming a bullish reversal.
• Price action is supported by higher lows and a breakout from the value area.
2. Volume Profile Insights:
• Point of Control (POC) at 38,580.85 acts as a springboard for further gains.
• Value Area High (VAH) at 38,770.50 signals the next resistance to monitor.
3. Bullish Targets:
• Initial target at 39,181.18.
• Extensions toward 39,750.00 and beyond align with the prevailing uptrend.
4. Risk Management:
• Stop Loss: Below 38,316.05 for downside protection.
• Take Profit: Incrementally at 39,181.18 and higher levels.
Market Context:
The JP225’s upward momentum aligns with broader equity market gains, potentially driven by favorable economic data and positive global sentiment. Traders should watch for any pullbacks to key support levels, offering re-entry opportunities.
Stay tuned for updates as we track this bullish move.

Short Nikkei 225Japan's economy is in big trouble that will take a generation or two to fix. Yet, if you look at the big picture of Nikkei, it may appear that it took them 40 years to solve problems from previous generations. In reality, that is not the case and I think we will see a sea of corporate scandals hit the news.
So let's wait and see)

Nikkei 225 short: Wave 3 downThis is a follow up to my previous idea to short Nikkei. I've cleaned up the waves so that it does not look so cluttered. Those lower degree wave counts from previous waves are removed. If you are interested to know the breakdown, please see my previous ideas.
What I am showing now is that the wave 3 is taking a longer time because it is building crash power and thus we are actually 3 degrees down from primary wave while building this wave 3 down move.

JPN225 Update JPN225 Update. what im seeing right now is that JPN225 is in an area where it can determine from here if to take advantage and dump down like crazy touching another Daily sellside liquidity zone signaling a sellside liquidity chase (shift into a bearish trend) or it can do a short sell down to the 4hr liquidity zone and continue for a buy after that signaling a possible higher high on daily down the line. its still up in the air. so narrowing down to a trade idea analysis would be a short sell to 4hr liquidity and just wait to see how it reacts from there, I wouldn't take profit until I have one 4hr bullish candle print after taking sell side liquidity on the 4hr.And to me this also goes for US30,NAS100,S&P500,GER40 ill be back to follow up.

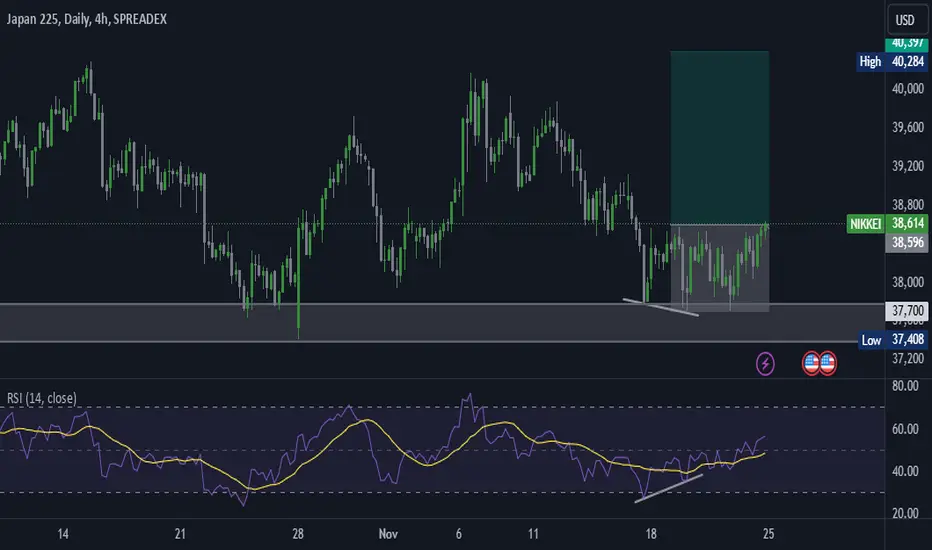
Nikkie 225 Nov 28, 2024 zonesBullish zone is above 38015
Bearish zone is below 37700
Note: This is not a buy/sell call, use stop loss whenever trade.


Nikkei: Support Level and Bullish Divergence on 4-HourNikkei is currently at a key support level and has formed a bullish divergence on the 4-hour timeframe. This technical setup indicates potential upward momentum.
JP225 - long
weekly okay
origin - looks alright. i'd be interested if price goes up, tags POC and then dumps down and buyers hold price near current POC. will be interested to fade the move once price hits the POC around 38,800 provided we close below it on volume.

JPY225 I present to you a short trade but fun! Not entirely sure if my DD is right but ya know how the stars talk and what not

Once moreThe stars have spoken? Jpy225 is on it's way down! It will bounce back to from that point. Didn't believe? Just watch

TradeCityPro | NIKKEI 225 Market Trends and Key Levels👋 Welcome to the TradeCityPro channel! Today, we’ll analyze the NIKKEI 225, the stock market index for the Tokyo Stock Exchange, identifying key entry and exit points.
🌏 Overview of NIKKEI 225’s Recent Movements
Recently, the NIKKEI 225 has experienced volatility due to:
Concerns over tech stocks - Yen appreciation. - Possible interest rate hikes by the Bank of Japan , Declines in major stocks like SoftBank and Tokyo Electron have contributed to recent drops.
On the other hand, indices like the Hang Seng in Asia have performed better, supported by positive news about stock buybacks, highlighting contrasting trends in regional markets.
🕒 Weekly Timeframe Analysis
The primary trend remains bullish but shows weakness due to rejections near the key resistance at 41,185.
However, the formation of a higher low indicates weak sellers and supports a longer-term bullish outlook.
As long as the price stays above the curve line and critical support at 33,903, the bullish trend remains intact , Breaking 41,185 would confirm a new primary uptrend.
📆 Daily Timeframe Analysis
On the daily chart, a rejection from the 40,104 resistance has led the price to consolidate within the range of 37,367 to 40,104.
This rejection has formed a Double Top pattern, a bearish structure.
Target for this pattern: After breaking 37,367, the price may drop towards 35,152.
⏱ 4-Hour Timeframe Analysis
The price is currently in a range box, resting on critical daily support.
If this support at 37,747 breaks with selling pressure, a move towards 36,677 is likely.
💥 Short Trigger:
Confirmed break below daily support at 37,747 , Alternatively, a rejection from the trendline could also trigger a short position.
📈 Long Trigger:
If the price finds support and moves upward, breakouts above the trendline and the trigger level at 38,466 can confirm a long position.
📝 Final Thoughts
NIKKEI 225 remains in a pivotal zone, with key supports and resistances guiding potential moves. Ensure proper risk management and monitor price action at critical levels for optimal trade entries.
This analysis reflects our opinions and is not financial advice.
Share your thoughts in the comments, and don’t forget to share this analysis with your friends! ❤️


NIKKEI Long Trade Targets Await!NIKKEI Trade Details:
The Nikkei index on the hourly timeframe confirms a bullish setup, with a clear long entry signal as per the Risological swing trading indicator . The trend is gaining strength, and the chart suggests a potential move towards profit targets.
NIKKEI Key Levels:
Entry: 38304
Stop Loss (SL): 38004
Take Profit Targets:
TP1: 38674
TP2: 39273
TP3: 39873
TP4: 40243
NIKKEI Analysis:
The chart indicates a recovery with higher lows and sustained buying pressure. The Risological trendline confirm the bullish trend, and momentum indicators align with the upward trajectory. With calculated risk, this trade offers a solid reward ratio.
NIKKEI Outlook:
Monitor for momentum consistency to hit targets. Stay alert for profit-locking opportunities at each target level to maximize gains. Watch out for resistance near higher levels to secure returns effectively.

20.11.24 Morning ForecastPairs on Watch -
FX:GBPUSD
FX:AUDUSD
OANDA:JP225USD
A short overview of the instruments I am looking at for today, multi-timeframe analysis down to what I will be looking at for an entry. Enjoy!

Nikkei 225: Wave 3 crash is comingI explain in this video my choice on breaking down the waves into sub-waves and suggests the alternative which will always give us a wave 3 down. For 2nd alternate count, where our main and 1st secondary count is wrong, I suggest that the current correction might drags out before wave 3 resumes.

AFTER FLOW: NI225 / USDJPY TRADE RESULTSAccount Performance: The account shows a total net profit of $2,703.38, with all six trades being profitable, resulting in a 100% win rate.
Trading Statistics:
Total Trades: 6 (3 short trades and 3 long trades).
Profit Factor: High, as there were no recorded losses, leading to a consistent profit.
Largest Profit Trade: $1,383.82, with an average profit per trade of $450.56.
Risk Metrics:
Balance Drawdown: 0.00%, indicating that the account did not experience any drawdown during
this period, which suggests effective risk management.
Sharpe Ratio: 0.90, reflecting a solid return relative to the assumed risk.
Observations:
The report highlights effective trade execution with a strategy that maintained positive gains across all positions. This consistency demonstrates a disciplined approach, potentially using hedging or balanced entries to manage exposure. The absence of drawdown could indicate conservative leverage usage or well-planned entry points.

Japan Nikkei index- just a quick post to show u something.
- As always everything is in the graphic.
- Now look at Japan Index closely.
- So a quick crash happened but look where Nikkei Bounced.
- i always speak in my posts that :
- " Supports are always turning to resistances ".
- " Resistances are always turning as supports ".
- Here you have a perfect exemple with Nikkei225.
- if u can trade Cryptos, u can trade anything else!
Happy Tr4Ding !

Japan 225: Amid Bearish Momentum and Global UncertaintyThe Japan 225 index is currently trading below the FibCloud, signaling a potential downward trend. My target for this short trade is around the 35,500- 36,200price area, where I anticipate significant support based on historical price movements and Fib levels. For now, I’ll let the trade run, while closely monitoring price action near the 40,000 zone. It’s crucial that the price remains below this level for the short trade to remain valid. A recovery back above 40,000 could signal a reversal, and in such a case, I may reassess my strategy.
Technical Overview:
• Partials: 38,000- 37,000area.
• Stop Loss: Monitoring the 40,000 zone as a key level of resistance.
• Key Indicators: The FibCloud provides strong bearish signals, and the declining price action suggests continued selling pressure.
• Risk Management: I’ll adjust the stop-loss level accordingly if the market shows signs of recovery or increased volatility. Taking partials at key support levels to secure profit remains an essential part of this strategy.
Fundamental Overview:
• Asia-Pacific Market Sentiment: As noted in the news, Asia-Pacific markets are mixed with attention on China’s loan prime rate announcement and Japan’s general election at the end of the week. While China’s central bank cut the one- and five-year LPRs by 25 basis points, this has not done enough to boost confidence, especially with property stocks tumbling.
• Japan’s Economic Data: Japan’s exports fell by 1.7% in September compared to the same period last year, signaling a potential slowdown in trade. Additionally, the Nikkei closed marginally lower recently, indicating bearish market conditions.
• Global Outlook: Japan’s market might be impacted further by inflation figures and GDP data expected this week, adding volatility and making the short trade setup timely.
Note: Please remember to adjust this trade idea according to your individual trading conditions, including position size, broker-specific price variations, and any relevant external factors. Every trader’s situation is unique, so it’s crucial to tailor your approach to your own risk tolerance and market environment.

How Yen Trends & Wage Growth Signal Opportunities in Nikkei 225 By Danish Lim Zhi Lin, Investment Analyst
Current Performance of Nikkei 225 Index:
Since our last trade idea ( ), the Nikkei 225 Index has rebounded from around 36,215 on 9 September to 39,480 at the close on 6 November, a gain of about 9%.
Nevertheless, Japanese equities are yet to hit their July record highs, as a stronger Yen, political uncertainty, and potentially higher interest rates weighed on sentiment.
Green Shoots in Japan:
In our previous posting, we highlighted how the fundamentals behind Japanese equities remained unchanged despite a bout of volatility in August and September. We viewed the August drawdown in equities as temporary and believed it was tied to headwinds in the global economy rather than Japan itself. Rising real wages provided further optimism that a virtuous wage-price spiral could be achieved, potentially boosting consumer spending and sentiment.
The latest data on wages supported our view, as Japanese workers’ base salaries saw the largest increase in over 3 decades, backing the BOJ’s view that the economy remains on the recovery track. Base pay advanced 2.6% YoY in September, up from 2.4% in August, the strongest increase in over 31 years. Scheduled cash earnings, a more stable measure of wage trends that excludes overtime pay, rose by 2.9% YoY, up from 2.8%. However, real wages fell for a 2nd straight month.
Nevertheless, wage hike momentum remains steady despite pockets of weakness, this could fuel spending and lead to demand-led inflation. At the same time, corporate reforms and growing shareholder activism have also led to higher dividends, more share buybacks and stronger balance sheets.
While the BOJ kept rates unchanged at its last policy meeting, there is still a possibility of another rate hike further down the road.
US Elections and USD/JPY:
On 6 November, the Nikkei 225 closed up by 2.61%, as the USD/JPY currency pair rose to 153.93 at 15:39 SGT, potentially on the verge of testing the key psychological level of 155. The negative correlation between the Nikkei 225 and USD/JPY has been well documented, with a weaker Yen benefitting many export-heavy Japanese firms such as Toyota and Fast Retailing, parent of Uniqlo.
The rise in the Dollar was driven by an increase in yields across the Treasuries curve following the US election results; as traders positioned for Trump’s tariffs to drive up inflation and tax cuts to boost the budget deficit.
In our view, we believe that the USD/JPY currency pair has more room to extend its rally for the remainder of the year. This could potentially provide further support for the Nikkei 225.
Back in 2016, Trump’s election victory saw the Dollar Index surge over 3% in October, similar to what happened last month. However, the Dollar Index rallied another 3% in November 2016. We could see a similar picture playing out this year. We also expect the Fed to slow its pace of rate cuts, given the inflation-inducing policies Trump is expected to push.
BOJ: To Hike or Not to Hike?
Following Donald Trump’s election win, Japan’s chief currency official Atsushi Mimura said that “we’re seeing one-sided, sudden moves in the currency market” as the yen weakened towards the 155 level against the Dollar. Mimura added that the central bank will monitor markets with a “very high sense of urgency”.
A weak Yen has the potential to boost imported inflation, putting pressure on the BOJ to raise rates. We expect to see verbal intervention from officials if Dollar strength remains in place. A breach of the 160 level could prompt actual currency intervention from the government.
Japan’s Politics
The situation is further complicated by the recent loss of a parliamentary majority by Japan’s ruling Liberal Democratic Party (LDP) in last month’s lower house election. This outcome could force the LDP to form a new coalition, potentially leading to power-sharing agreements that introduce political uncertainty.
Such developments could delay the Bank of Japan's (BOJ) anticipated rate hike, with opposition parties—some of which may become pivotal in coalition negotiations—advocating for a more dovish monetary stance.
Notably, Yuichiro Tamaki, leader of the opposition Democratic Party for the People (DPP), has called for a six-month delay before any further rate hikes.
As a result, the prospects of delayed BOJ tightening, combined with rising US yields driven by the policies of a potential Trump administration, have led to a widening of the interest rate differential between Japan and the US, now at its most pronounced since July. This dynamic has exerted upward pressure on the USD/JPY exchange rate.
The US-Japan 10-year yield spread has increased from its September low, which aligns with the recent rise in the USD/JPY currency pair. ()
Nikkei 225 Outlook & Trading Opportunity:
In our view, we see Trump's election victory as tactically positive for Japanese equities and the Nikkei 225.
The underlying economic fundamentals remain robust, with real wages on a positive growth trajectory. The resurgence of healthy inflation coupled with rising wages could trigger a virtuous cycle of price and wage increases, which would provide a broad economic boost and, by extension, benefit the equity market.
Trump's election victory could also alter the flow of capital into 2 of Asia's largest equity markets. Specifically, as investors adopt a more cautious stance towards potential tariffs on China, we anticipate that funds will increasingly flow into Japan.
We expect the Nikkei 225 to benefit from Trump’s inflationary policies - which could keep US interest rates high, which could in turn strengthen the Dollar and weaken the Yen to the advantage of the Japanese equity market. However, upside could be limited given the risk of a currency intervention by Japanese authorities to stem Yen weakness.
If China's expected stimulus measures fall short of market expectations, we anticipate that investors may rotate their positions out of China and into Japan, a pattern we already observed during the lead-up to China’s previous round of stimulus announcements..
Expressing Our View:
We maintain our previous trade setup:
Long Nikkei 225 Index Futures
Based on a Fibonacci Extension drawn from the October 2023 to the July 2024 high, the daily chart shows the index rebounding from the 5 August low of 31,156; but has since consolidated within 37,700 – 39,500.
If Dollar strength remains, we expect an appreciation in USD/JPY to send the Nikkei 225 Index upwards towards resistance at the 0.786% extension level around 40,500 within the month of November. If breached, we see the next resistance level at around 43,000 – 43,050.
• Entry Level: 39,000
• Target Level: 40,500 (1-Month target)
• Stop Loss Level: 38,500 (trailing stop preferred)
• Profit at Target: 1500 x ¥500= ¥750,000
• Loss at Stop: 500 x ¥500= ¥250,500
• Reward: Risk Ratio: 3x
Trade Nikkei 225 with Phillip Nova now

JPN225 LongThis trade is with the trend
There is no pattern
stop loss below the last structure
take profit at M15 overbought

Nikkei 225 (JPN225) Potential Bullish Reversal from Demand ZoneAnalysis Summary
Resistance Zone and Weak High: The price previously reached a high around 40,200, forming a weak high within a resistance zone. If the price approaches this level again, it may encounter selling pressure, but a breakout could signal a continuation of the bullish trend.
Break of Structure (BOS) and Change of Character (CHoCH): The recent BOS and CHoCH events indicate a potential shift in momentum. The BOS on the upside suggests a bullish structure, but the CHoCH warns of a possible retracement.
Demand Zone Support: A significant demand zone lies between 38,690 and 38,234. This area may act as a support level if the price retraces down to it, providing a potential base for a bullish reversal.
Potential Reversal Target: If the price finds support in the demand zone and reverses upward, the weak high and resistance zone around 40,200 could be the primary target for a bullish move.
Potential Scenarios:
Bullish Reversal from Demand Zone: If the price moves into the demand zone (38,690–38,234) and finds buying interest, a bullish reversal could follow, targeting the weak high around 40,200. This would align with the bullish structure indicated by the recent BOS.
Continuation of Bearish Retracement: If the price fails to hold in the demand zone, a further decline toward lower support levels would be possible, which would weaken the bullish outlook.
Conclusion
The Nikkei 225 is approaching a demand zone, where a bullish reversal could emerge, supported by the recent BOS indicating an uptrend. Traders may look for buying opportunities within 38,690–38,234, aiming for a potential upside move toward 40,200. Monitoring price action in the demand zone will be crucial for confirming the reversal setup.
