US100 (NASDAQ 100) 24-Hour Technical Analysis ForecastCurrent Price: 23,076.60 (Close: Friday, July 18th, 2025)
Analysis Period: Next 24 Hours (July 19-20, 2025)
Market Status: Weekend - Preparing for Monday Open
---------------------------------------------------------------------------------------------
EXECUTIVE SUMMARY - 24H OUTLOOK
Primary Bias: Neutral to Bullish (Short-term consolidation expected)
Key Resistance: 23,150 - 23,250
Critical Support: 22,850 - 22,950
Expected Range: 22,900 - 23,200
Volatility Level: Moderate (Tech earnings season approach)
---------------------------------------------------------------------------------------------
1. CANDLESTICK PATTERN ANALYSIS
Friday's Close Formation
---------------------------------------------------------------------------------------------
Pattern: Small-bodied candle with upper shadow at 23,076
Significance: Indecision after testing resistance near 23,150
Volume: Above-average volume suggesting institutional activity
Context: Failed to break cleanly above psychological 23,100 level
---------------------------------------------------------------------------------------------
Expected 24H Patterns
---------------------------------------------------------------------------------------------
Monday Gap: Potential small gap up to 23,100-23,120 area
Continuation Pattern: Bullish flag/pennant formation developing
Key Reversal: Watch for hammer formation at 22,950 support if decline occurs
---------------------------------------------------------------------------------------------
Pattern Probability Assessment
---------------------------------------------------------------------------------------------
Doji/Spinning Top: 40% probability (continued indecision)
Bullish Engulfing: 35% probability (if gap up occurs)
Bearish Reversal: 25% probability (if resistance holds)
---------------------------------------------------------------------------------------------
2. HARMONIC PATTERN ANALYSIS
Current Harmonic Setup
---------------------------------------------------------------------------------------------
Primary Pattern: Bullish Cypher Pattern in Development
---------------------------------------------------------------------------------------------
X: 22,400 (previous major low)
A: 23,250 (recent swing high)
B: 22,800 (61.8% retracement)
C: 23,150 (127.2% extension - current test area)
D (Completion): 22,650-22,750 (78.6% retracement zone)
---------------------------------------------------------------------------------------------
Alternative Pattern: Bull Flag
---------------------------------------------------------------------------------------------
Pole: 22,400 → 23,250 (850-point move)
Flag: Current consolidation 22,950-23,150
Target: 23,250 + 850 = 24,100 (extended projection)
---------------------------------------------------------------------------------------------
Fibonacci Levels (24H Focus)
---------------------------------------------------------------------------------------------
Golden Ratio Support: 22,950 (61.8% of recent swing)
38.2% Retracement: 23,025
23.6% Retracement: 23,050
Extension Target: 23,375 (161.8% projection)
---------------------------------------------------------------------------------------------
3. ELLIOTT WAVE THEORY - 24H COUNT
Primary Wave Count (Bullish Scenario)
---------------------------------------------------------------------------------------------
Macro Structure: Wave 5 of larger degree impulse in progress
Current Position: Wave 4 correction completing
Mini-wave Count: Flat correction pattern (A-B-C structure)
---------------------------------------------------------------------------------------------
24-Hour Wave Projection
---------------------------------------------------------------------------------------------
Wave A: 23,250 → 22,800 (Completed)
Wave B: 22,800 → 23,150 (Completed - 70% retrace)
Wave C: 23,150 → 22,950 (In Progress - Equal to A)
Wave 5 Target: 24,000-24,200 (1.618 extension)
---------------------------------------------------------------------------------------------
Alternative Count (Corrective Scenario)
---------------------------------------------------------------------------------------------
Structure: Double zigzag correction
Current Phase: Second zigzag development
Target: 22,750-22,850 (Wave Y completion)
---------------------------------------------------------------------------------------------
Critical Elliott Levels
---------------------------------------------------------------------------------------------
Wave 4 Low: 22,750 (must hold for bullish count)
Invalidation: Below 22,400 (Wave 1 high)
Confirmation: Break above 23,250 (Wave 3 high)
---------------------------------------------------------------------------------------------
4. WYCKOFF THEORY - 24H PHASE
Current Market Phase Assessment
---------------------------------------------------------------------------------------------
Primary Phase: Reaccumulation (Phase B-C transition)
Composite Operator Action: Testing supply at 23,150 area
Volume Analysis: Absorption of selling pressure evident
Smart Money Activity: Institutional buying on dips below 23,000
---------------------------------------------------------------------------------------------
Expected 24H Wyckoff Dynamics
---------------------------------------------------------------------------------------------
Phase Progression: Moving toward Phase D (Sign of Strength)
Testing Action: Final test of support at 22,950-23,000
Volume Expectation: Declining volume on any weakness
Breakout Setup: Spring action possible below 22,950
---------------------------------------------------------------------------------------------
Key Wyckoff Signals (24H Watch List)
---------------------------------------------------------------------------------------------
Sign of Strength (SOS): Break above 23,150 with volume
Last Point of Support (LPS): 22,950 area test
No Supply: Expected on rallies to 23,100-23,150
Backup to Edge of Creek: Potential dip to 22,850
---------------------------------------------------------------------------------------------
5. W.D. GANN THEORY - 24H ANALYSIS
Square of Nine Analysis
---------------------------------------------------------------------------------------------
Current Position: 23,076° on Gann wheel
Next Cardinal Point: 23,100° (significant psychological resistance)
Natural Support: 23,000° (perfect square - strong magnetic level)
Critical Angle: 22,900° (45-degree angle support from recent low)
---------------------------------------------------------------------------------------------
Time Theory - 24H Cycle
---------------------------------------------------------------------------------------------
Natural Time Cycle: 24-hour cycle from Friday's close
Critical Time Windows:
---------------------------------------------------------------------------------------------
6 hours: 02:00 UTC Monday (potential turn time)
18 hours: 14:00 UTC Monday (major turn potential)
24 hours: 20:00 UTC Monday (cycle completion)
---------------------------------------------------------------------------------------------
Angle Theory Application
---------------------------------------------------------------------------------------------
Rising 45° Line: Currently at 22,950 (critical support)
Rising 63.75° Line: 23,100 (steep resistance angle)
Declining 26.25° Line: 23,150 (gentle resistance)
---------------------------------------------------------------------------------------------
Gann Price Forecasting
---------------------------------------------------------------------------------------------
Square Root Method:
---------------------------------------------------------------------------------------------
Current: √23,076 ≈ 151.9
Next resistance: 152² = 23,104
Major resistance: 153² = 23,409
---------------------------------------------------------------------------------------------
Primary Target: 23,104 (natural Gann resistance)
Extended Target: 23,409 (next perfect square)
---------------------------------------------------------------------------------------------
Time-Price Harmony
---------------------------------------------------------------------------------------------
Harmonic Time: 144 hours from last major low
Price Harmony: 23,076 in harmony with 22,500 base
Next Harmony Level: 23,400 (Fibonacci price relationship)
---------------------------------------------------------------------------------------------
6. MULTI-TIMEFRAME INTRADAY ANALYSIS
5-Minute Chart Analysis
---------------------------------------------------------------------------------------------
Micro Trend: Consolidating triangle pattern
Support: 23,050-23,060 (recent lows)
Resistance: 23,090-23,100 (intraday highs)
Volume Profile: Balanced - no clear direction
RSI (5M): 48-52 range (neutral)
Pattern: Symmetrical triangle (breakout pending)
---------------------------------------------------------------------------------------------
15-Minute Chart Analysis
---------------------------------------------------------------------------------------------
Structure: Bull flag formation
Flag Boundaries: 23,040-23,120
Breakout Level: Above 23,120 (bullish)
Breakdown Level: Below 23,040 (bearish)
Moving Averages: EMA20 at 23,065 (support)
MACD: Consolidating above zero line
---------------------------------------------------------------------------------------------
30-Minute Chart Analysis
---------------------------------------------------------------------------------------------
Primary Pattern: Ascending triangle
Horizontal Resistance: 23,150 (multiple tests)
Rising Support Line: From 22,950 to current levels
Breakout Target: 23,350 (triangle height projection)
Volume: Decreasing (typical triangle behavior)
Bollinger Bands: Contracting (low volatility)
---------------------------------------------------------------------------------------------
1-Hour Chart Analysis
---------------------------------------------------------------------------------------------
Major Structure: Bullish continuation pattern
Cup and Handle: Handle formation in progress
Handle Depth: 7% correction (healthy)
Breakout Level: 23,175 (handle resistance)
Target: 24,000 (cup depth projection)
RSI (1H): 55 (bullish but not overbought)
---------------------------------------------------------------------------------------------
4-Hour Chart Analysis
---------------------------------------------------------------------------------------------
Macro Trend: Strong uptrend intact
Correction Type: Shallow pullback (wave 4 character)
Support Cluster: 22,900-23,000 (multiple confluences)
Resistance Zone: 23,150-23,250
Ichimoku Cloud: Price above cloud (bullish)
Volume Trend: Higher lows pattern (accumulation)
---------------------------------------------------------------------------------------------
7. TECHNICAL INDICATORS MATRIX
Momentum Indicators
---------------------------------------------------------------------------------------------
RSI (4H): 58 (Bullish momentum, room for upside)
RSI (1H): 55 (Neutral-bullish)
Stochastic %K: 62 (Above %D line - bullish)
Williams %R: -35 (Not oversold, upside potential)
---------------------------------------------------------------------------------------------
Trend Indicators
---------------------------------------------------------------------------------------------
MACD (4H): Above signal line, histogram positive
ADX: 35 (Strong trend strength)
Parabolic SAR: 22,950 (supportive)
Supertrend: 22,850 (strong support)
---------------------------------------------------------------------------------------------
Volume Indicators
---------------------------------------------------------------------------------------------
OBV: Rising trend (accumulation pattern)
Volume Rate of Change: Positive
Chaikin Money Flow: +0.15 (buying pressure)
Accumulation/Distribution: Uptrend
---------------------------------------------------------------------------------------------
8. KEY SUPPORT & RESISTANCE LEVELS (24H)
Critical Resistance Levels
---------------------------------------------------------------------------------------------
R1: 23,100 (Psychological + Gann)
R2: 23,150 (Technical resistance + harmonic)
R3: 23,200 (Minor resistance)
R4: 23,250 (Major swing high)
R5: 23,350 (Extended target)
---------------------------------------------------------------------------------------------
Vital Support Levels
---------------------------------------------------------------------------------------------
S1: 23,040 (Immediate support)
S2: 23,000 (Psychological + Gann)
S3: 22,950 (Critical support cluster)
S4: 22,900 (Strong technical support)
S5: 22,850 (Major support zone)
---------------------------------------------------------------------------------------------
9. 24-HOUR TRADING SCENARIOS
Scenario 1: Bullish Breakout (50% Probability)
---------------------------------------------------------------------------------------------
Trigger: Break above 23,120 with volume expansion
Initial Target: 23,180-23,200
Extended Target: 23,300-23,350
Stop Loss (Longs): Below 22,990
Expected Timeline: 12-18 hours from breakout
---------------------------------------------------------------------------------------------
Scenario 2: Continued Consolidation (35% Probability)
---------------------------------------------------------------------------------------------
Range: 23,000-23,150
Trading Strategy: Range-bound scalping
Buy Zone: 23,020-23,040
Sell Zone: 23,120-23,140
Duration: Full 24-hour period
---------------------------------------------------------------------------------------------
Scenario 3: Bearish Breakdown (15% Probability)
---------------------------------------------------------------------------------------------
Trigger: Break below 22,990 on volume
Target 1: 22,900-22,950
Target 2: 22,850-22,900
Bounce Level: 22,800-22,850
Recovery Above: 23,050 negates bearish scenario
---------------------------------------------------------------------------------------------
10. RISK FACTORS & CATALYSTS (24H)
Bullish Catalysts
---------------------------------------------------------------------------------------------
Tech earnings optimism building
AI sector momentum continuation
Institutional portfolio rebalancing (month-end flows)
Strong economic data expectations
Risk-on sentiment from Asia markets
---------------------------------------------------------------------------------------------
Bearish Risk Factors
---------------------------------------------------------------------------------------------
Profit-taking ahead of earnings
Rising bond yields concern
Geopolitical tensions impact
Overbought technical condition worries
Sector rotation out of tech
---------------------------------------------------------------------------------------------
High-Impact Events (Next 24H)
---------------------------------------------------------------------------------------------
Asian market opening (risk sentiment gauge)
Weekend news flow analysis
Pre-earnings positioning
Options expiry effects
Futures gap analysis
---------------------------------------------------------------------------------------------
11. TRADING RECOMMENDATIONS (24H)
For Scalpers (5M-15M Timeframes)
---------------------------------------------------------------------------------------------
Primary Setup: Triangle breakout trade
Entry Long: Above 23,120
Target: 23,160-23,180
Stop Loss: 23,080
Risk/Reward: 1:2 ratio
---------------------------------------------------------------------------------------------
For Intraday Traders (30M-1H)
---------------------------------------------------------------------------------------------
Strategy: Bull flag continuation
Entry Zone: 23,050-23,070 (on dips)
Target 1: 23,150
Target 2: 23,200
Stop Loss: 23,000
---------------------------------------------------------------------------------------------
For Swing Setup (4H basis)
---------------------------------------------------------------------------------------------
Approach: Pullback buying opportunity
Optimal Entry: 22,950-23,000
Primary Target: 23,350-23,400
Extended Target: 23,600
Stop Loss: 22,850
---------------------------------------------------------------------------------------------
12. CONFLUENCE ANALYSIS
Bullish Confluence at 22,950-23,000
---------------------------------------------------------------------------------------------
Gann Theory: 23,000° perfect square support
Elliott Wave: Wave 4 completion zone
Wyckoff: Last Point of Support (LPS)
Fibonacci: 61.8% retracement level
Moving Averages: EMA 50 confluence
Volume Profile: High volume node support
---------------------------------------------------------------------------------------------
Resistance Confluence at 23,150-23,200
---------------------------------------------------------------------------------------------
Harmonic: Cypher pattern C-point resistance
Previous Structure: Multiple test area
Psychological: Round number resistance
Gann Angles: 63.75° resistance line
Elliott Wave: Wave B completion area
Technical: Flag pattern upper boundary
---------------------------------------------------------------------------------------------
FINAL 24H FORECAST SUMMARY
Most Likely Scenario: Continued consolidation with upward bias, testing 23,150 resistance with potential breakout to 23,200+ levels.
Trading Range Expectation: 22,980 - 23,180 (primary range)
Breakout Levels:
---------------------------------------------------------------------------------------------
Bullish: Above 23,120 → targets 23,200-23,350
Bearish: Below 22,980 → targets 22,900-22,950
---------------------------------------------------------------------------------------------
Key Time Windows:
---------------------------------------------------------------------------------------------
Asian Open: 00:00-02:00 UTC (gap direction)
US Pre-market: 08:00-13:30 UTC (institutional flows)
US Cash Open: 13:30 UTC (volume confirmation)
---------------------------------------------------------------------------------------------
Risk Management Notes:
---------------------------------------------------------------------------------------------
Position sizing should account for tech sector volatility
Weekend gap risk considerations
Earnings season positioning effects
---------------------------------------------------------------------------------------------
Probability Assessment:
---------------------------------------------------------------------------------------------
50% - Bullish breakout scenario
35% - Range-bound consolidation
15% - Bearish breakdown
---------------------------------------------------------------------------------------------
Disclaimer: This analysis is for educational purposes only. Trading involves substantial risk of loss. Always use appropriate risk management and never risk more than you can afford to lose. Past performance does not guarantee future results.
---------------------------------------------------------------------------------------------
---------------------------------------------------------------------------------------------
For those interested in further developing their trading skills based on these types of analyses, consider exploring the mentoring program offered by Shunya Trade.
I welcome your feedback on this analysis, as it will inform and enhance my future work.
Regards,
Shunya Trade
⚠️ Disclaimer: This post is educational content and does not constitute investment advice, financial advice, or trading recommendations. The views expressed here are based on technical analysis and are shared solely for informational purposes. The stock market is subject to risks, including capital loss, and readers should exercise due diligence before investing. We do not take responsibility for decisions made based on this content. Consult a certified financial advisor for personalized guidance.
NAS100 trade ideas
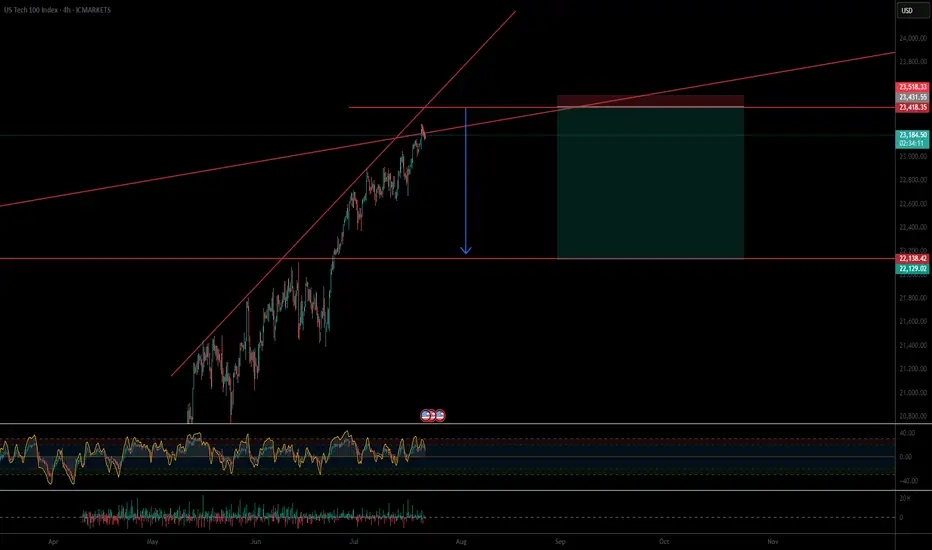
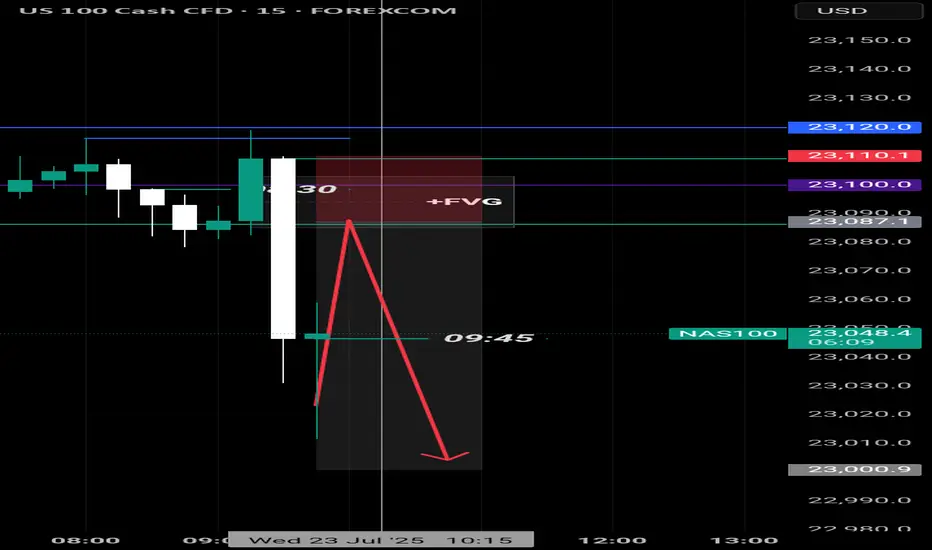
Powell speech inspired SHORT for NAS100If the price reaches my set zone, i believe it will dump to collect liquidity before making new ATHs.
Tiny SL, huge TP.
good luck
NASDAQ Potential UpsidesHey Traders, in tomorrow's trading session we are monitoring NAS100 for a buying opportunity around 22,780 zone, NASDAQ is trading in an uptrend and currently is in a correction phase in which it is approaching the trend at 22,780 support and resistance area.
Trade safe, Joe.

#NDQ - Monthly Targets: 23721.73 or 21387.86?Date: 03-07-2025
#NDQ - Current Price: 22641.89
Pivot Point: 22554.80 Support: 22276.15 Resistance: 22835.11
Upside Targets:
Target 1: 23028.36
Target 2: 23221.62
Target 3: 23471.67
Target 4: 23721.73
Downside Targets:
Target 1: 22082.06
Target 2: 21887.98
Target 3: 21637.92
Target 4: 21387.86

CALL THE MARKETS - XAUUSD ANALYSISWE HAVE
ona
kyle
Hasan
Ashlee
Mav
We are looking for the new red candle to drop down to 23100 area. from the 23100 to see continuation or a reversal towards ATH for a rejection to continue down to our lower Blue square area.
obviously we will wait for more news but thats what we are looking a for now.

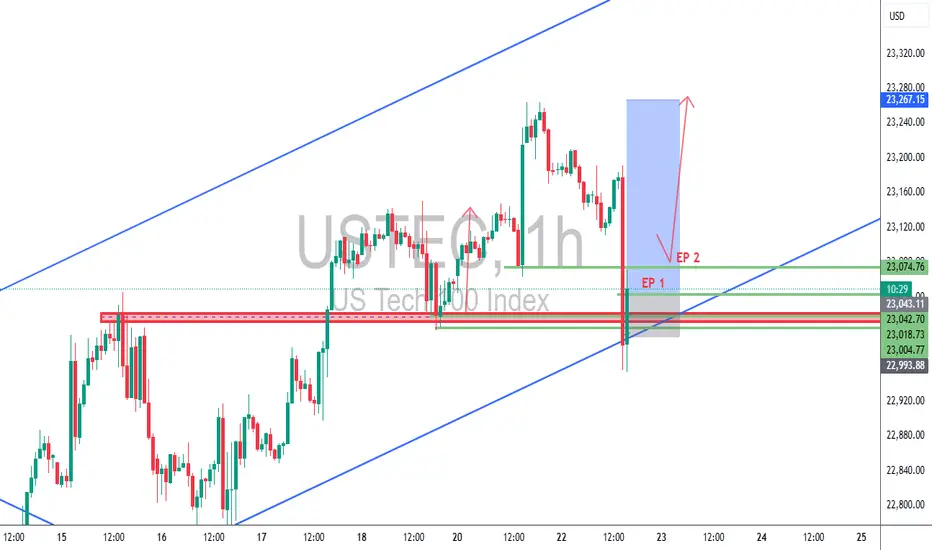
USTEC 1H – Dual Entry Precision | TCB Trend Phase SetupUSTEC 1H – Dual Entry Precision | TCB Trend Phase Setup
Market remained bullish with clear channel structure. After a pullback into the previous breakout zone, price swept liquidity and wicked below, offering two refined entries (EP 1 & EP 2) inside the demand zone.
🔸 EP 1 – Aggressive entry on first touch
🔸 EP 2 – Confirmation entry after rejection
🔸 SL placed below structural liquidity sweep
🔸 Target: Mid-channel + price inefficiency fill above
Trade Summary
🧠 Trend Phase entry with TCB logic
📌 Demand zone = Key structure
⏱️ Low drawdown
💥 RRR ~1:3
📈 TP in motion (or hit, if price reached 23,267)
📎 #Hashtags:
#USTEC #US100 #Nasdaq #SmartMoneyConcepts #SniperTrader #ForexTrading #PriceActionTrading #TCBSetup #TrendTrading #LiquiditySweep #RiskReward #TradingViewAnalysis
I am 100 % short spy and qqq I am BULLISH DXY the chart posted is now setup for the cycle top On several cycles and we have just popped the Shiller p/e above 3866 second highest reading ever . Cycle are into a peak that was due 7/5 to 7/14 So why are we now turning down .? wait the energy from one of the largest solar storms is the time for the transition it is also a new moon . my spirals have called for the top as it did in 12/5 and 2/17 . I see a min drop of over 8 and could see well over 11.8 within the next 90 days . best of trades WAVETIMER

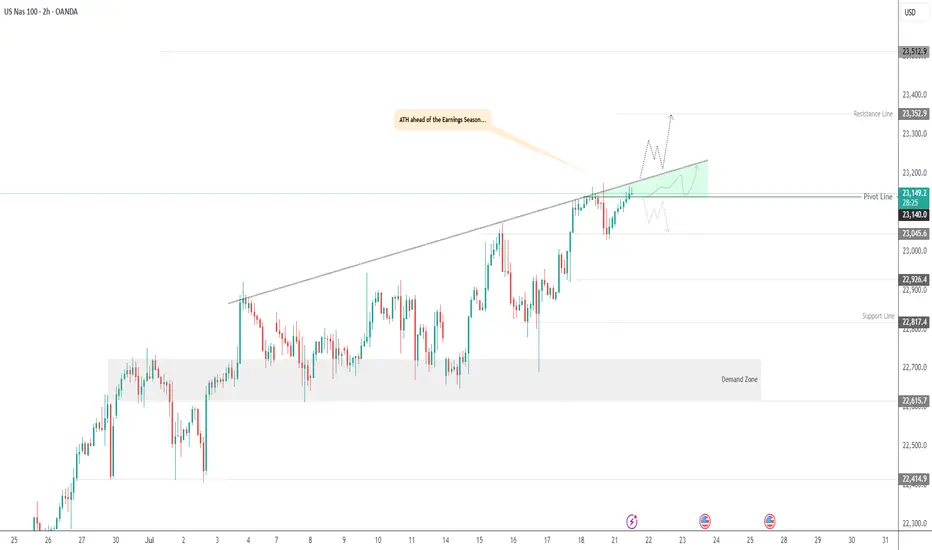
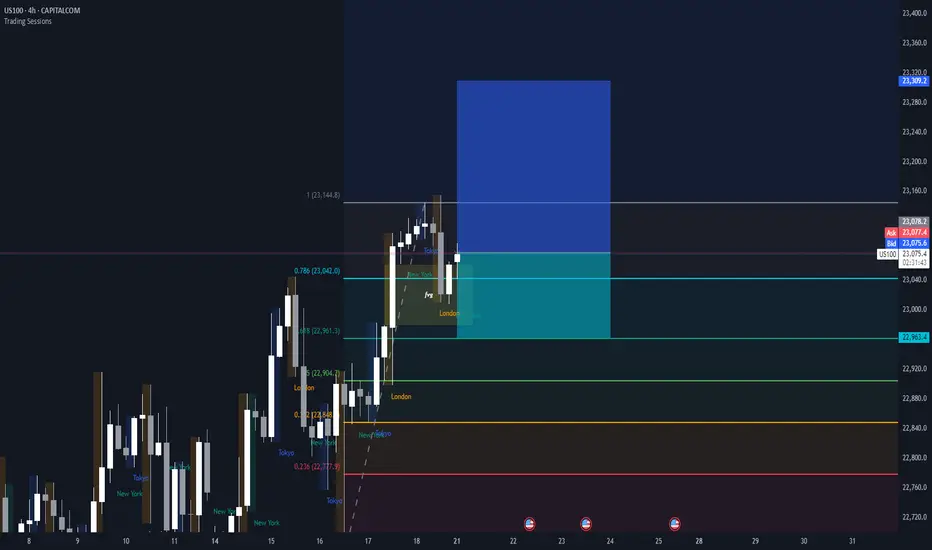
USNAS100 | Bullish Setup Ahead of Tech Earnings & Trade RiskUSNAS100 | Bullish Setup Ahead of Tech Earnings & Trade Risk
U.S. equity markets are entering a pivotal week with big-tech earnings and renewed focus on Trump’s proposed trade tariffs. Both the S&P 500 and Nasdaq are hovering near record highs, but new catalysts are required for continuation.
Technical Outlook:
The price has stabilized above 23140, breaking the pivot and confirming bullish momentum. As long as the price holds above this level, the trend remains bullish, especially if it breaks the green triangle resistance structure.
A sustained move above 23140 opens the path toward 23250 and 23350, with further extension possible to 23510.
However, a 4H close below 23140 may activate a bearish correction toward 23045, and possibly deeper toward 22920 and 22820.
Resistance Levels: 23250 · 23350 · 23510
Support Levels: 23045 · 22920 · 22820
Bias: Bullish above 23140
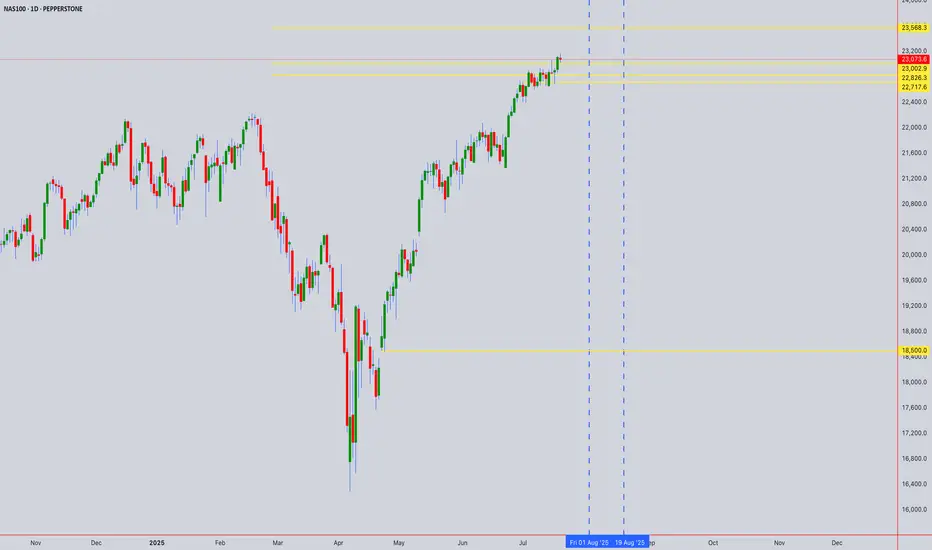
NASDAQ INDEX (US100): Bullish Continuation Confirmed
NASDAQ Index broke and closed above a resistance of a horizontal
parallel channel on a daily.
It confirms a bullish trend continuation and a highly probable growth
to the next strong resistance.
Goal - 23300
❤️Please, support my work with like, thank you!❤️

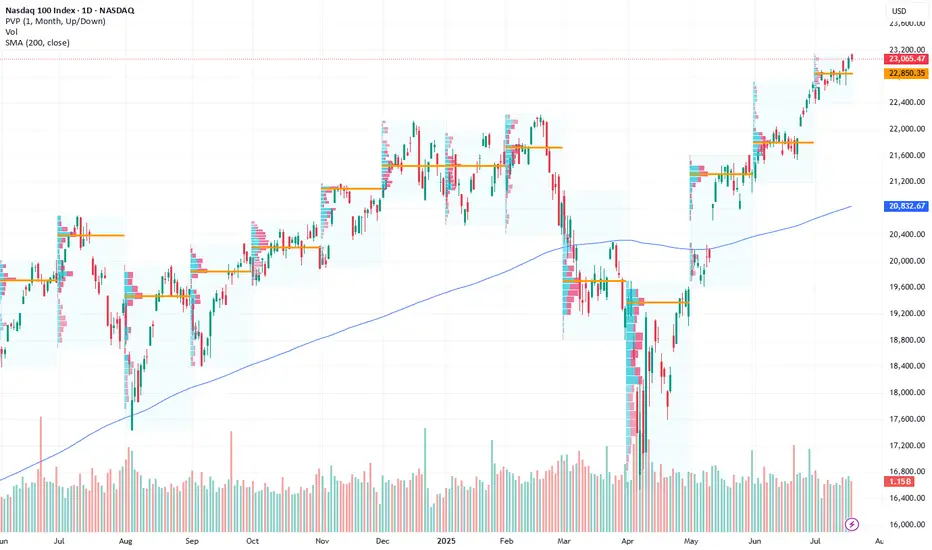
Nasdaq Index (US100 / NASDAQ):The Nasdaq index continues to move in a medium- to long-term uptrend, recently testing the 23,000 support zone and bouncing upward.
🔹 Bearish Scenario:
If the price breaks and closes below 23,000, it may lead to a decline toward 22,920, followed by a deeper move toward 22,650.
🔹 Bullish Scenario:
If the price holds above 23,200, further upside toward a new high around 23,400 is likely.
⚠️ Disclaimer:
This analysis is for educational purposes only and does not constitute financial advice. Always monitor the markets and perform your own due diligence before making any investment decisions.

Upward momentum of Nasdaq is weakeningUpward momentum of Nasdaq is weakening. Waiting for negative global cues to nreal trendline

NASDAQ | BearishNASDAQ has Printed double top as well as broken the bullish trend by printing two lower highs and lower lows.It is likely to continue the bearish trend since NASDAQ has already witnessed quite a long bullish rally.

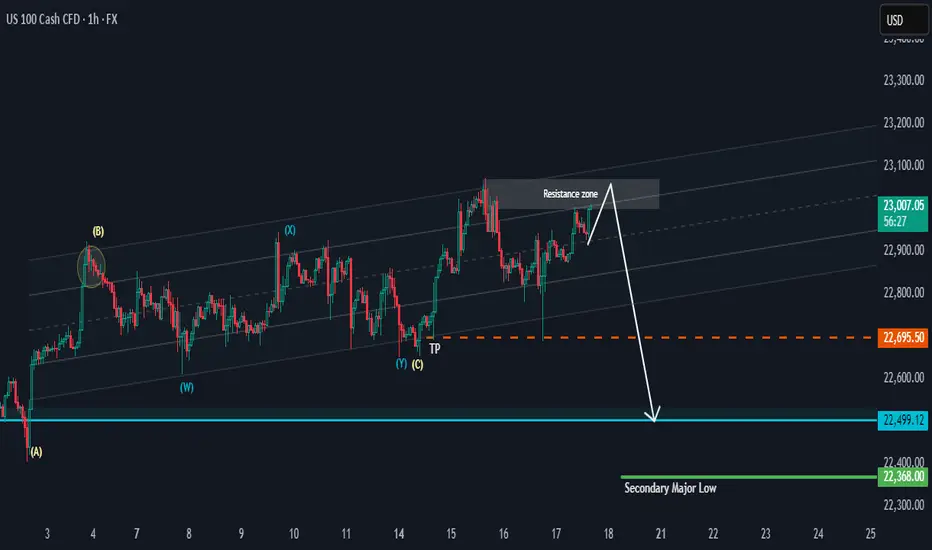
NAS 100 Potential PullbackHi there,
NAS100 has the potential to drop as it keeps testing the resistance zone in the range of 23100. This looks more like bull exhaustion than a reversal. The 22695.50 is the target for a bias of 22499.12
The overall bigger trend is bullish, with price highs aiming as far as 23717.44, 24837.28, and 26222.31, making this a potentially massive bullish trend, and it will take time to reach those highs.
Happy Trading, 🌟
K.
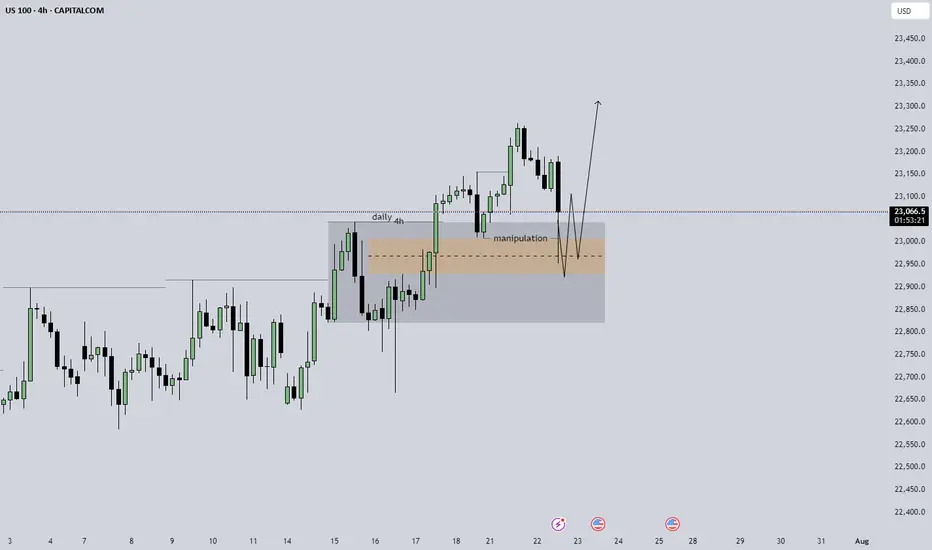
US100 expecting smth like this daily is strongly bullish, 4h is showing some sort of manipulation in the short, i am expecting something like the arrow that i pointed to happen on the m5 structure to try and take an entry, without that kind of circumstance stay out of the trade.
NAS100 Bullish Setup: Clean Structure & Entry Zone Pending📊 NASDAQ 100 (NAS100) remains bullish, showing a clean, well-structured uptrend—higher highs and higher lows 🔼📈.
Price has now pulled back into my optimal entry zone 🎯. At this stage, I’m waiting for a bullish break in market structure before considering an entry 🟢🔓.
Patience is key—let the structure confirm first.
Not financial advice ❌💼

Properly navigating this ATH run in NASDAQ - No supply yetEverything is explained quickly in the video.
Main points:
1) Lows and bullish imbalances respected
2) It's very difficult to short without supply
3) May get cyclical take profit like previous years
Be sure to let me know what you think!

NASDAQ Rebounding on its 1H MA50.Nasdaq (NDX) rebounded today on its 1H MA50 (blue trend-line), third time since Friday's and Thursday's bounce. A Channel Up is emerging and based on the 4H RSI it is a medium-term bullish reversal off the Pivot trend-line, similar to June 20 - 30.
As you can see, that Channel Up targeted the 2.618 Fibonacci extension before breaking below the 1H MA50 to start a lengthy consolidation. Based on that, we are targeting 23650 (Fib 2.618 ext) on the short-term.
-------------------------------------------------------------------------------
** Please LIKE 👍, FOLLOW ✅, SHARE 🙌 and COMMENT ✍ if you enjoy this idea! Also share your ideas and charts in the comments section below! This is best way to keep it relevant, support us, keep the content here free and allow the idea to reach as many people as possible. **
-------------------------------------------------------------------------------
Disclosure: I am part of Trade Nation's Influencer program and receive a monthly fee for using their TradingView charts in my analysis.
💸💸💸💸💸💸
👇 👇 👇 👇 👇 👇

Go Long – Bullish Targets for Next Week- Current Price: $23065.47
- Key Insights: NASDAQ has exhibited resilience despite recent sentiment shifts,
showing signs of potential upside driven by a solid rebound in major tech
stocks. With earnings season approaching, improved performance in underlying
components reinforces long-term confidence in the index.
- Price Targets:
- T1: $23427.43
- T2: $23696.12
- S1: $22834.82
- S2: $22604.17
- Recent Performance: Over the past week, NASDAQ has consolidated near its
current levels, with intraday volatility driven by sector rotations and
macro concerns. While sentiment has weakened, the index remains supported by
key levels near the $23,000 mark.
- Expert Analysis: Analysts express optimism around key components such as
Apple, Microsoft, and Nvidia, which have recently seen improved outlooks.
Broader tech sector strength may drive NASDAQ higher. Caution is advised
given geopolitical uncertainties but upside opportunities dominate momentum.
- Sentiment Analysis:
- Current sentiment: 0
- Last week: 62.5
- Change: -62.5
- Total mentions: 386
- News Impact: Positive developments in semiconductor growth forecasts and
easing fears over rate hikes have supported bullish sentiment. However, last
week’s lower-than-expected inflation data and Federal Reserve signals for
"higher rates for longer" dampened sentiment overall.
US100 longLet market structure speak for itself! ;)
Looks like a clear long position... follow the trend!!!! <3
USNAS100 signs of a potential bearish trend Nasdaq Composite ended Friday little changed, recovering from a brief dip triggered by financial reports suggesting that former President Donald Trump is pushing for new tariffs. This geopolitical uncertainty is adding pressure to tech-heavy indices, with broader market sentiment turning cautious.
The price action on USNAS100 currently appears weak, showing early signs of a potential bearish trend in the upcoming week. However, before further downside, we may see the price retest key resistance levels.
You may find more details in the chart Ps Support with like and comments for better analysis.

NasdaqCOT data shows large speculators increasing net long positions on the Nasdaq-100, reflecting rising institutional confidence in tech and growth sectors. This positioning supports a bullish bias, especially as price holds above key moving averages and market breadth improves.

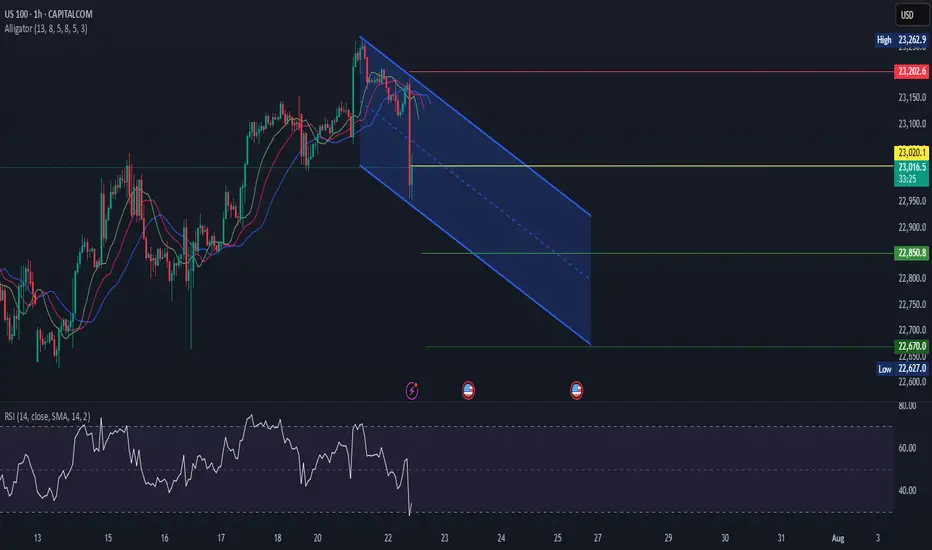
US100US100 is in bearish trend.
Printing LH and LL>
Bearish divergence also shown in RSI.
Alligator mouth open which indicates trend will go downward.
We sell at CMP.