NAS - LONGWaiting to see how news affects the markets today. IF we hold this area and we get confirmation that buyers are taking over. I will enter long and target previous highs.
NAS100 trade ideas
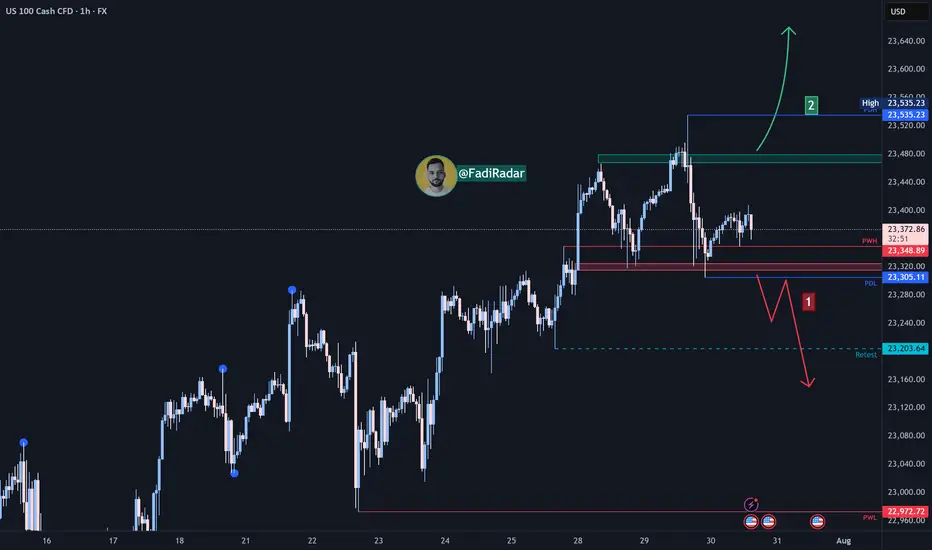
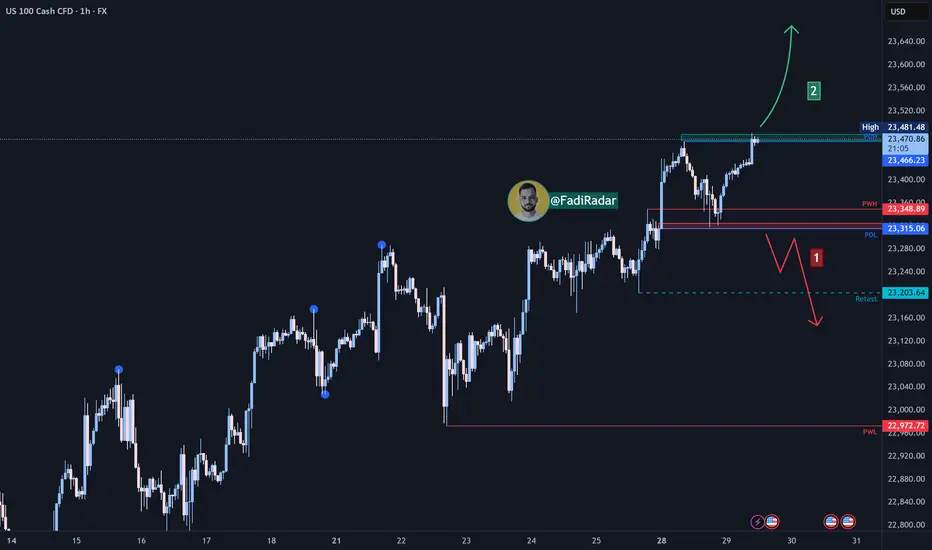
Nasdaq Index Analysis (US100 / NASDAQ):The Nasdaq index is currently sweeping liquidity above the resistance zone and pulling back.
1️⃣ The more likely scenario is a break and close below 23,330 USD, which may lead to a decline toward 23,200 USD, followed by 23,000 USD.
2️⃣ However, if the price holds above 23,480 USD, a continuation of the uptrend is expected, potentially forming a new high.
⚠️ Disclaimer:
This analysis is not financial advice. It is recommended to monitor the markets and carefully analyze the data before making any investment decisions.
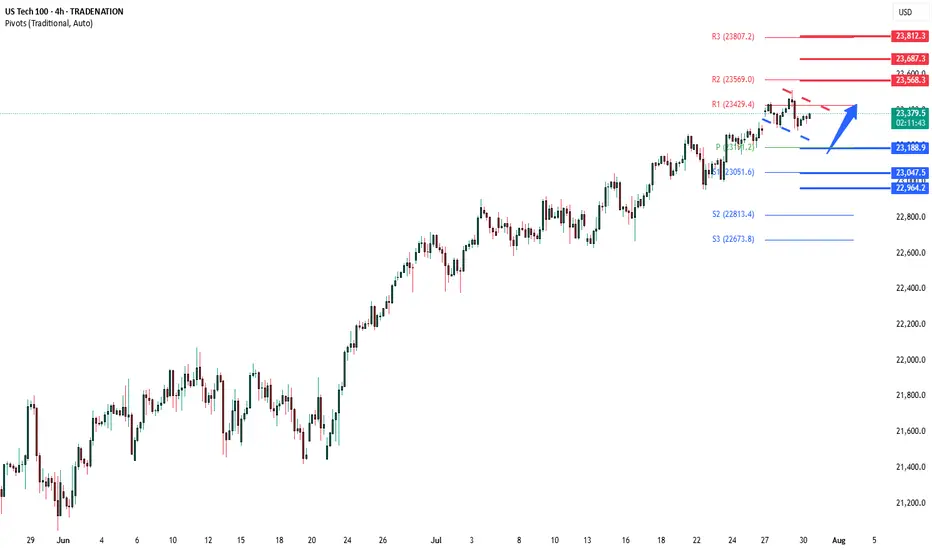
NSDQ100 important support at 23188US equities pulled back, breaking a six-day winning streak for the S&P 500 (-0.30%) as sentiment cooled ahead of key earnings and the Federal Reserve’s rate decision. The Nasdaq 100 (NDX) was weighed down by weakness in megacap tech stocks—the Mag-7 fell -0.68%, with Meta declining -2.46% and Microsoft earnings due after the close.
Post-earnings disappointments also pressured tech-related sentiment. PayPal slumped -8.66% on soft volume growth, despite unveiling a new crypto merchant feature, and UnitedHealth fell -7.46% on weaker sales. These sharp declines indicate heightened sensitivity to earnings misses in a market priced for perfection.
Meanwhile, market volatility could rise amid geopolitical jitters. A massive magnitude-8.8 earthquake in Russia’s Far East triggered tsunami alerts across the Pacific, briefly affecting Hawaii, California, and Shanghai. While many warnings were later downgraded, the event injected caution into markets.
On the macro front, investors are bracing for the Fed’s rate decision later today. The central bank is expected to hold rates steady, but traders are watching closely for guidance on future cuts—particularly in light of Trump’s renewed pressure for easing and ongoing global trade uncertainty, including tariff threats toward India.
Conclusion for Nasdaq 100 Trading:
With sentiment fragile and earnings risk front and center, traders in the Nasdaq 100 should expect near-term volatility, especially around Microsoft and Meta's earnings reports. The tech sector's leadership is under pressure, and any disappointing results could drag the index lower. Watch the Fed’s tone closely—a neutral or hawkish stance could further weigh on rate-sensitive tech. Cautious positioning or selective hedging may be warranted, particularly as geopolitical risks and trade policy uncertainty resurface.
Key Support and Resistance Levels
Resistance Level 1: 23568
Resistance Level 2: 23687
Resistance Level 3: 23812
Support Level 1: 23188
Support Level 2: 23047
Support Level 3: 22965
This communication is for informational purposes only and should not be viewed as any form of recommendation as to a particular course of action or as investment advice. It is not intended as an offer or solicitation for the purchase or sale of any financial instrument or as an official confirmation of any transaction. Opinions, estimates and assumptions expressed herein are made as of the date of this communication and are subject to change without notice. This communication has been prepared based upon information, including market prices, data and other information, believed to be reliable; however, Trade Nation does not warrant its completeness or accuracy. All market prices and market data contained in or attached to this communication are indicative and subject to change without notice.
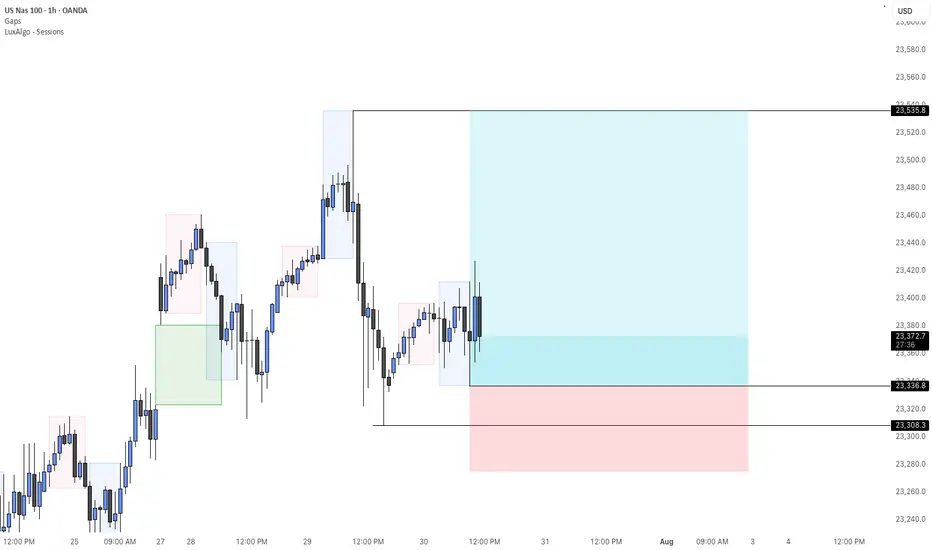
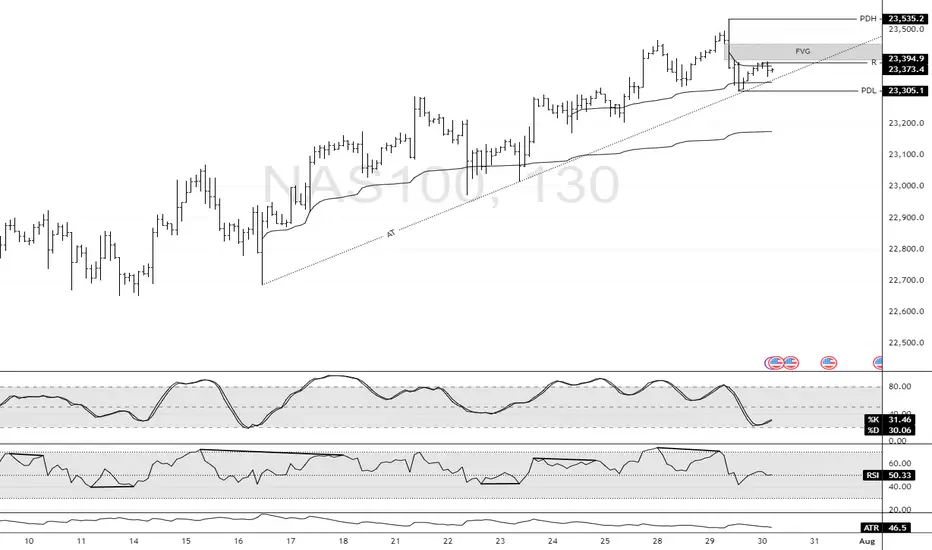
Nasdaq Finds Support at $23,305.0FenzoFx—Nasdaq dipped yesterday and formed a bearish FVG. However, the selling pressure eased as soon as the price tested the ascending trendline.
The last day's low at $23,305.0 is the immediate support. That said, a close above the immediate resistance at $23,375.0 can trigger the uptrend, targeting the highs at $23,535.0.
MIDWEEK FORECAST WHAT TO LOOK FOR WHEN WEARING THE MARKET LENSLess is more when you are looking for setups you can just check how am not complicating my charts yet am always finding setups everyday

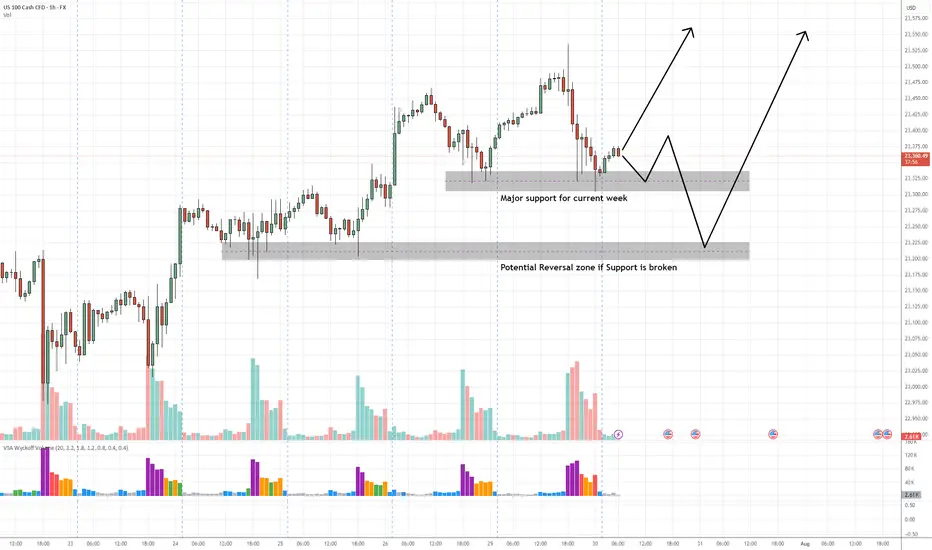
NAS100 Buy Setup – VSA & Multi-Zone Demand Analysis✅ Primary Entry Zone: Major support for current week (around 23,325–23,350)
✅ Secondary Entry Zone: Potential reversal zone if primary support is broken (around 23,200–23,230)
🎯 Target 1 (TP1): Previous swing high near 23,500
🎯 Target 2 (TP2): Extension above 23,550
🛑 Stop Loss (SL): Below 23,170 (beyond secondary reversal zone to avoid false breaks)
📊 Technical Insight (VSA & Price Action Structure)
Support Structure:
The current major support zone has been tested multiple times with no follow-through selling, indicating strong buying interest from larger players.
Volume Spread Analysis Observations:
On the recent decline into the major support zone, we see wider spreads on high volume followed by narrow range candles on lower volume, a classic sign of stopping volume and supply exhaustion.
Within the secondary reversal zone, historical reactions show climactic volume spikes leading to sharp reversals, suggesting this level is watched closely by smart money.
Any test back into the zone on low volume would confirm the No Supply (NS) condition.
Trade Pathways:
Scenario 1: Price respects the major support and begins to climb, confirming demand dominance → target TP1 then TP2.
Scenario 2: Support is temporarily breached, triggering a liquidity grab into the secondary reversal zone, followed by a bullish reversal bar on high volume → strong buy signal with potentially faster move toward TP levels.
📍 Bias: Bullish as long as price holds above the secondary reversal zone.
📌 Execution Tip: Wait for a wide spread up-bar on increased volume from either zone to confirm the start of the markup phase.
Nasdaq Index Analysis (US100 / NASDAQ):The Nasdaq index continues its medium- to long-term bullish trend, recently reaching a new high at 23,477 USD.
1️⃣ A break and close below 23,330 USD could trigger a pullback toward 23,200 USD, followed by 23,000 USD.
2️⃣ However, if the price holds above 23,480 USD, a continuation of the uptrend is expected, potentially forming a new high.
⚠️ Disclaimer:
This analysis is not financial advice. It is recommended to monitor the markets and carefully analyze the data before making any investment decisions.
US100 (NASDAQ 100 Index) – Breakout with Clear Upside ProjectionUS100 has broken out cleanly above the key resistance at 22,097.1, indicating bullish continuation. The breakout is supported by strong upward momentum, targeting the next key level around 23,441.9, as illustrated by the projected range.
Support at: 22,097.1 🔽 | 20,750.0 🔽
Resistance at: 23,441.9 🔼
🔎 Bias:
🔼 Bullish: Sustained price action above 22,097.1 keeps the bullish breakout valid, aiming toward 23,441.9.
🔽 Bearish: A drop back below 22,097.1 would invalidate the breakout, possibly pulling price toward 20,750.0.
📛 Disclaimer: This is not financial advice. Trade at your own risk.

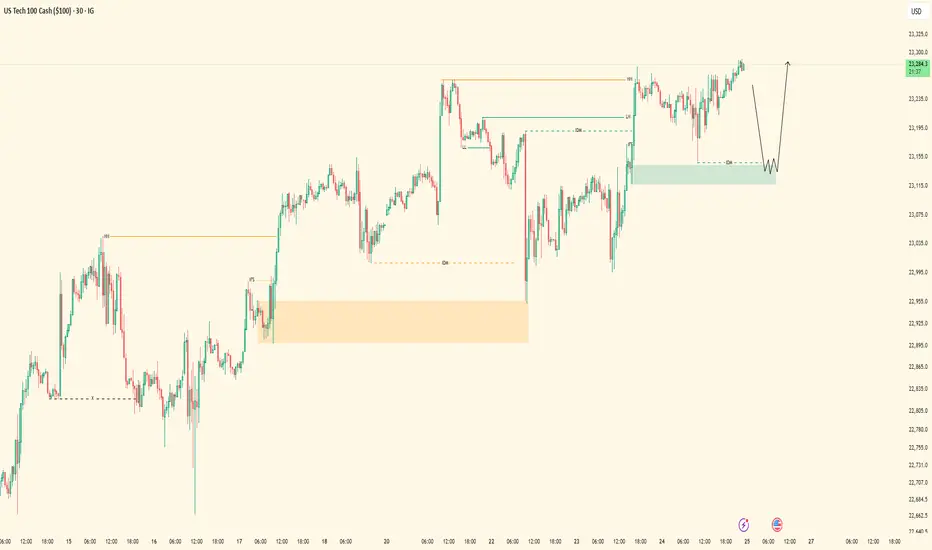
NASDAQ| Bullish Bias - Refined OB Near MitigationPair: NASDAQ (NAS100)
Bias: Bullish
HTF Overview (4H):
Strong bullish structure has been the narrative, and last week’s upside intent confirmed the move. Current action suggests price is preparing for continuation after brief consolidation.
LTF Confirmation (30M):
Structure has been refined with a key OB in play. Price is approaching mitigation, and I’ve been tracking this level closely since last week.
Entry Zone: Waiting for clear 5M shift after OB mitigation. 5M OB already tapped — now I’m watching for confirmation to execute.
Targets: 5M highs first, 30M highs if price maintains momentum
Mindset Note: Focused and flowing. No forcing — I’ve tracked this from HTF to LTF and now I’m just waiting for price to invite me in. Clarity + patience = execution.


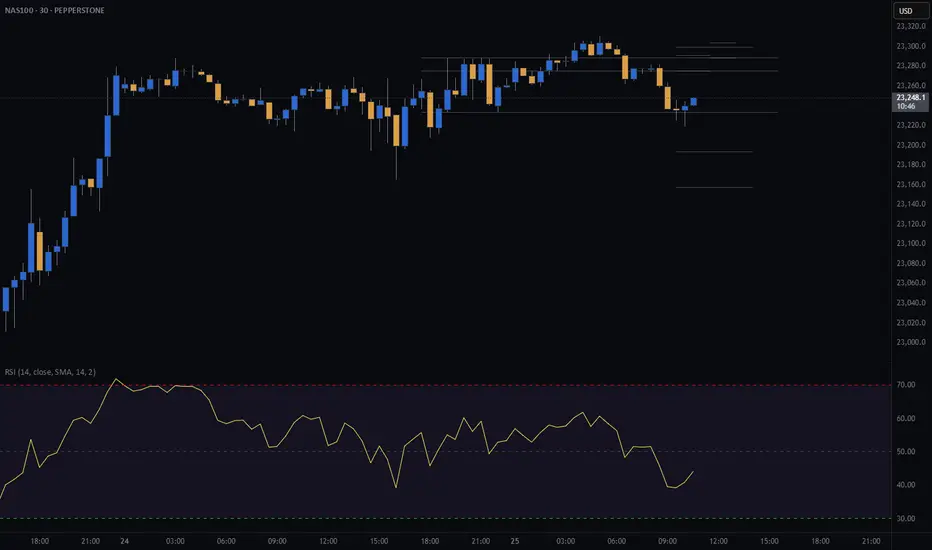
US100 LONGWe can see that there is a strong resistance zone, and the US30 has made a pullback into that zone. Based on the SK system, the outlook appears more bullish for this week.

NAS100 - Potential TargetsDear Friends in Trading,
How I see it,
Insightful article: (The same principle applies to Nasdaq naturally)
1) Read the article first:
investinglive.com
2) Follow the link to watch the short video -
youtu.be
Keynote:
We are waiting for a decisive and very clear bearish signal
I promise you; we won't miss it.
It will be in our face, on a 4Hr grouping or a Daily grouping.
Most times it's 1 x Big Red signal on a high TF.
I sincerely hope my point of view offers a valued insight
Thank you for taking the time study my analysis.

NAS100 [Consolidating ] – Will It Break Higher or Pull Back?The NAS100 has maintained a bullish structure and is currently pressing against the resistance zone around 21,777.3. This area has acted as a ceiling several times in recent sessions. Price is showing consolidation just below resistance, suggesting either an imminent breakout or another rejection.
Currently trading at 21,777.3, with
Support at: 21,450.0 🔽
Resistance at: 22,230.7 🔼
🔎 Bias:
🔼 Bullish: A strong break and hold above 21,777.3 may drive price toward the next resistance at 22,230.7.
🔽 Bearish: Rejection from 21,777.3 could lead to a retracement toward 21,450.0, with deeper downside potential if that level fails.
📛 Disclaimer: This is not financial advice. Trade at your own risk.

Nasdaq100 Bulls ready to drive the price to 23,300 handle With the choch on the market structure and with Key data released on Thursday, reflected strength in the U.S. economy. Stocks rose this Thursday, buoyed by fresh economic data reports and a slew of corporate earnings releases. The tech-heavy Nasdaq Composite has advanced 0.4%, and quarterly earnings reports released this week have exceeded Wall Street’s expectations, fueling investor confidence. I am expecting that by the end of this week or the beginning of next week will see the bulls drive the market to our 23,300 handle. I am with the bulls on this one
Tp1.23,300.

Results from 7/21/25Just like I said -- it played out
WE hit the Daily FVG and then headed up hard.
If you got in buys this week, COMMENT down below
share why and how.

Bullish RSI Divergence on Nasdaq 100$ustech Bullish RSI Divergence on the 1H TF indicating continuation of the bullish trend

NDX (NASDAQ) CASH500 SHORT - Head and shoulders 30minRisk/reward = 3.2
Entry price = 23 275.7
Stop loss price = 23 303.9
Take profit level 1 (50%) = 23 193
Take profit level 2 (50%) = 23 157
Waiting on confirmation on a number of variables before entering the trade.
SellRejection Level
Daily Volume
Market Structure Shift
London US Session
Trend Line Break
Untapped Order Point

Nasdaq Bullish Flow | 5M OB Execution PendingPair: NAS100
Bias: Bullish
Timeframes: 30M / 5M
Price remains heavy bullish — structure aligning perfectly across the board. Ever since the 30M OB was mitigated, I’ve been following Nasdaq’s order flow step-by-step.
I was watching for full-bodied confirmations inside the 30M zone, but instead, price gave clarity through the lower timeframes. That 5M flip gave away smart money’s intent — showing me exactly where accumulation is happening.
Now waiting for price to tap into the 5M OB to shift into execution mode. This setup has been mapped with precision — no guessing. Once entry presents itself, I’ll follow through.
Entry Zone: 5M OB
Target: 5M highs
Mindset Note: Still in analysis mode — patience until price hits my zone. Smart money doesn’t rush, it accumulates. So do I. 💼
Will USTEC Continue Its Rallies Amid Better Market Sentiment?Macro approach:
- USTEC advanced modestly this week, supported by upbeat corporate earnings and resilience in economic data amid ongoing policy uncertainty.
- The index benefited from strong expected results in major tech firms such as Microsoft (MSFT) and Nvidia (NVDA), as top giant AI leadership, helping to bolster sentiment despite lingering concerns about tariffs and Fed policy direction.
- US macro data showed sticky inflation in key categories, robust retail sales, and falling jobless claims. This prompted the Fed to retain its cautious stance on rate cuts while markets reassessed policy expectations. Policy-related headlines and manufacturing sector developments also partly drove market volatility.
- USTEC could remain sensitive to incoming tech earnings, the 29-30 Jul Fed meeting, and potential US tariff announcements in early Aug. Persistent inflation and any surprises in central bank communication may drive volatility in the sessions ahead.
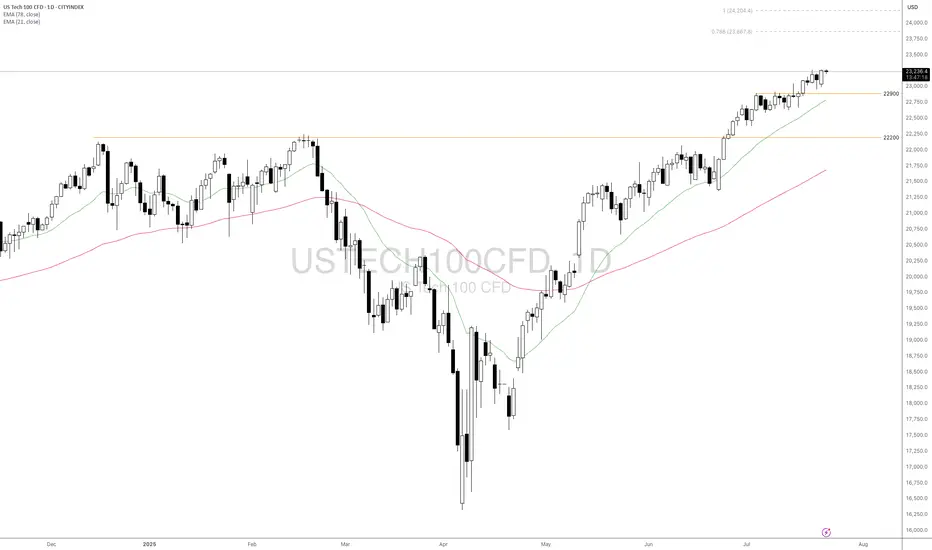
Technical approach:
- USTEC trended higher and created a new record high. The price is above both EMAs, indicating a strong bullish momentum.
- If USTEC stays above the support at 22900, the price may continue toward the 78.6% Fibonacci Extension at around 23867.
- On the contrary, breaking below the support at 22900 and EMA21 may prompt a deeper correction to retest the following support at 22000.
Analysis by: Dat Tong, Senior Financial Markets Strategist at Exness
NASDAQ100| - Bullish Bias RemainsPrice didn’t give me the deep candle retrace into my 30M OB — just a wick tap — but that was enough. That wick shows me smart money touched in.
Dropped to the LTF and got my shift in structure confirming bullish intent.
Now I’m locked in, watching for price to sweep a 5M sell-side liquidity pocket into a clean LTF order block for the next entry.
🎯 Target: Short-term 5M highs
🚀 Bias: Still bullish unless structure breaks
This is a patience game now — execution only after confirmation.

long position on nas100I am long on nas100 ,I go in detail on the video hope I'm clear ,if you have a question or correction I am open to adjust thank you

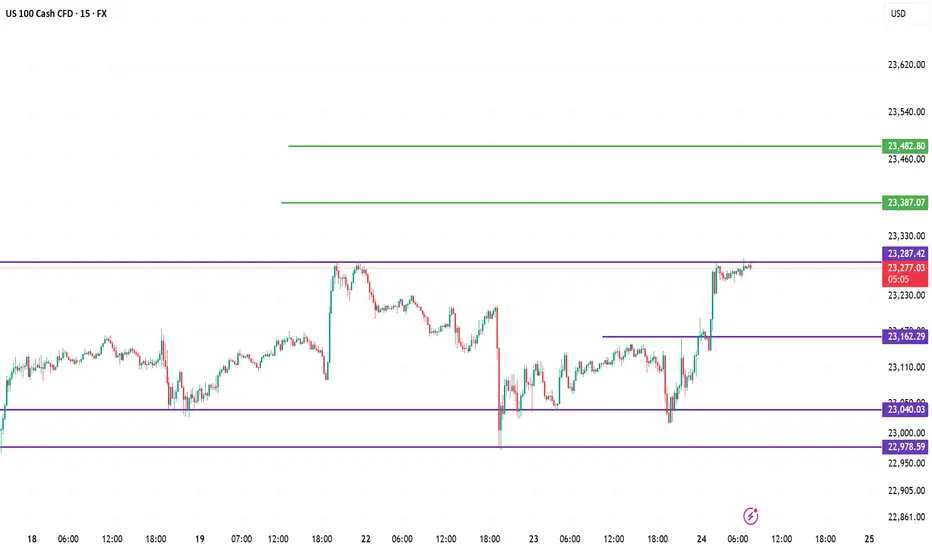
US100 Analysis Report (15m Chart)1. 🔍 Liquidity Grab (Sell-side taken)
Price swept below 23,040 and sharply reversed from 22,978, clearing out weak sellers.
2. 📈 Break of Structure (BOS)
A bullish BOS occurred after price broke above 23,162, confirming short-term bullish intent.
3. 🟪 Rejection Zone
Price is now testing 23,287.42 — a supply/resistance zone. Watch for signs of rejection or breakout.
4. 📊 Bullish Scenario
If price breaks 23,287 cleanly, expect next moves towards 23,387 and then 23,482.
5. 📉 Bearish Setup Possibility
Rejection from 23,287 could pull price back to 23,162 or 23,040 before the next move.