4-hr UK100: A Healthy Correction Might Attract More BuyersThe UK100 is experiencing a remarkable rally! Over the past few weeks, the British stock market index has surged nearly 800 points. Each minor dip has attracted more buyers, fueling the bullish momentum. However, since last week, we’ve observed a slight slowdown, an uptick in selling volume, and a decline in the 20-period moving average.
Despite this, the broader trend remains bullish, as confirmed by the Golden Cross—a widely recognized buy signal. While we favor long positions, we aim to optimize our risk-to-reward ratio. To achieve this, we prefer to wait for a deeper pullback before entering. Ideally, we’d like to see the price retrace toward or below 8,640, which coincides with the 23% Fibonacci retracement.
While market corrections often reach the 38% Fibonacci level, the strong demand for UK100 suggests that a shallower pullback might be sufficient. For this reason, we target the higher retracement zone as a potential entry point. Our preferred exit would be above 8,820, where a Double Top chart pattern is expected to form. This strategy ensures a well-timed entry while aligning with the dominant uptrend.
UK100 trade ideas

Team, UK100 SHORT opportunity.Team, SET limit order to short UK100 double up at 8782-96 and potentially triple up at 8826-45 - with target at 8235-46
I am shorting UK100 at 8760-65 ranges
Target 1 at 8736-8742
Target 2 at 8722-8728
Target 3 at 8696-8705

UK100 - Long TradePrice is moving in bullish trend with no bearish divergence.
Ascending channel supports bullish trend continuation.

UK100 (FTSE)-Weekly forecast, Technical Analysis & Trading IdeasMidterm forecast:
8380.25 is a major support, while this level is not broken, the Midterm wave will be uptrend.
Technical analysis:
A trough is formed in daily chart at 8006.10 on 12/20/2024, so more gains to resistance(s) 8833.83, 9000.00, 9100.00 and more heights is expected.
Take Profits:
8664.21
8765.00
8833.83
9000.00
9100.00
__________________________________________________________________
❤️ If you find this helpful and want more FREE forecasts in TradingView,
. . . . . . . . Hit the 'BOOST' button 👍
. . . . . . . . . . . Drop some feedback in the comments below! (e.g., What did you find most useful? How can we improve?)
🙏 Your support is appreciated!
Now, it's your turn!
Be sure to leave a comment; let us know how you see this opportunity and forecast.
Have a successful week,
ForecastCity Support Team

FTSE Bullish Breakout above falling wedgeThe FTSE (UK100) index price action sentiment appears bullish, supported by the longer-term prevailing uptrend.
The key trading level is at 8695. swing low. A corrective pullback from the current levels and a bullish bounce back from the 8695 level could target the upside resistance at 8800 followed by the 8830 and 8916 levels over the longer timeframe.
Alternatively, a confirmed loss of 8695 support and a daily close below that level could open a way for further retracement and a retest of 8655 support level followed by 8590 and 8540.
This communication is for informational purposes only and should not be viewed as any form of recommendation as to a particular course of action or as investment advice. It is not intended as an offer or solicitation for the purchase or sale of any financial instrument or as an official confirmation of any transaction. Opinions, estimates and assumptions expressed herein are made as of the date of this communication and are subject to change without notice. This communication has been prepared based upon information, including market prices, data and other information, believed to be reliable; however, Trade Nation does not warrant its completeness or accuracy. All market prices and market data contained in or attached to this communication are indicative and subject to change without notice.

Made in England.. FTSE 100 Triangle BreakoutFinally the long term triangle pattern in blue chip UK stocks has broken - and the weekly chart for the FTSE 100 index is looking very positive.
The breakout weekly candle is a long one with a close right near the highs - showing bulls are well in control of the market.
We can see the triangle break in more granular detail on the daily chart with the break confirmed on Thursday and a strong follow-through move on Friday.
Support is found first at the former all time high (8450-8475) then back at the broken trendline from the triangle pattern.
These support levels define our risk - the price back inside the triangle will inform us the breakout has failed - this time at least.
But if things move as we expect, using the height of the triangle pattern as a price objective from the breakout point, the UK 100 could reach 9,000.
But - as always - that’s just how the team and I are seeing things, what do you think?
Share your ideas with us - OR - send us a request!
Comments welcome :)
cheers!
Jasper
The material provided in this article is for information purposes only and should not be understood as trading or investment advice. Any opinion that may be provided on this page does not constitute a recommendation by Trading Writers and has not been prepared in accordance with the legal requirements designed to promote investment research independence. If you rely on the information on this page, then you do so entirely at your own risk.

UK100 (FTSE)-Weekly forecast, Technical Analysis & Trading IdeasMidterm forecast:
8380.25 is a major support, while this level is not broken, the Midterm wave will be uptrend.
Technical analysis:
The ascending flag taking shape suggests we will soon see another leg higher.
A trough is formed in daily chart at 8006.10 on 12/20/2024, so more gains to resistance(s) 8664.21, 8765.00, 9000.00 and more heights is expected.
Take Profits:
8083.43
8183.03
8242.89
8380.25
8485.05
8664.21
8765.00
9000.00
__________________________________________________________________
❤️ If you find this helpful and want more FREE forecasts in TradingView,
. . . . . . . . Hit the 'BOOST' button 👍
. . . . . . . . . . . Drop some feedback in the comments below! (e.g., What did you find most useful? How can we improve?)
🙏 Your support is appreciated!
Now, it's your turn!
Be sure to leave a comment; let us know how you see this opportunity and forecast.
Have a successful week,
ForecastCity Support Team

Open a demoWhat are the opening and closing times of the FTSE 100? The FTSE 100 opens at 8am and closes at 4.30pm UK time (GMT), Monday to Friday. This is in line with the London Stock Exchange (LSE) opening and closing times. There is no lunch period during which trading ceases.

UK100 - up up upStrong Bullish move. Price nicely hit 50% of Monday's impulse and is now accumulating slightly above this level. It found the resistance but it should break and possible first reject at 50% yesterdays drop to bounce of current resistance turned into support and move to new ATH. Other possibility is that price will test Monday's 50% again before it will go up eventually.

FTSE100 H4 | Falling to overlap supportFTSE100 (UK100) is falling towards an overlap support and could potentially bounce off this level to climb higher.
Buy entry is at 8,691.94 which is an overlap support.
Stop loss is at 8,504.00 which is a level that lies underneath a swing-low support and the 38.2% Fibonacci retracement level.
Take profit is at 8,892.06 which is a level that aligns with the 78.6% Fibonacci projection level.
High Risk Investment Warning
Trading Forex/CFDs on margin carries a high level of risk and may not be suitable for all investors. Leverage can work against you.
Stratos Markets Limited (www.fxcm.com):
CFDs are complex instruments and come with a high risk of losing money rapidly due to leverage. 63% of retail investor accounts lose money when trading CFDs with this provider. You should consider whether you understand how CFDs work and whether you can afford to take the high risk of losing your money.
Stratos Europe Ltd (www.fxcm.com):
CFDs are complex instruments and come with a high risk of losing money rapidly due to leverage. 63% of retail investor accounts lose money when trading CFDs with this provider. You should consider whether you understand how CFDs work and whether you can afford to take the high risk of losing your money.
Stratos Trading Pty. Limited (www.fxcm.com):
Trading FX/CFDs carries significant risks. FXCM AU (AFSL 309763), please read the Financial Services Guide, Product Disclosure Statement, Target Market Determination and Terms of Business at www.fxcm.com
Stratos Global LLC (www.fxcm.com):
Losses can exceed deposits.
Please be advised that the information presented on TradingView is provided to FXCM (‘Company’, ‘we’) by a third-party provider (‘TFA Global Pte Ltd’). Please be reminded that you are solely responsible for the trading decisions on your account. There is a very high degree of risk involved in trading. Any information and/or content is intended entirely for research, educational and informational purposes only and does not constitute investment or consultation advice or investment strategy. The information is not tailored to the investment needs of any specific person and therefore does not involve a consideration of any of the investment objectives, financial situation or needs of any viewer that may receive it. Kindly also note that past performance is not a reliable indicator of future results. Actual results may differ materially from those anticipated in forward-looking or past performance statements. We assume no liability as to the accuracy or completeness of any of the information and/or content provided herein and the Company cannot be held responsible for any omission, mistake nor for any loss or damage including without limitation to any loss of profit which may arise from reliance on any information supplied by TFA Global Pte Ltd.
The speaker(s) is neither an employee, agent nor representative of FXCM and is therefore acting independently. The opinions given are their own, constitute general market commentary, and do not constitute the opinion or advice of FXCM or any form of personal or investment advice. FXCM neither endorses nor guarantees offerings of third-party speakers, nor is FXCM responsible for the content, veracity or opinions of third-party speakers, presenters or participants.

UK100 FTSE1.4h
2.upt
3.resist
4.bearish exp triangle
5.rsi73/sto97/vol
6.
7.fibext below
8.fibretrace below
9.
10.
11.
12.bearish divergence
13.volume reduce /
14.bearish
1.2h
2.upt
3.resist
4.bearish exp triangle/
5.rsi70/sto93/vol
6.
7.fibext below
8.fib retrace below
9.
10.
11.
12. Bearish divergence
13.consolidating
14.bearish
1.1h
2. Upt
3. Resist
4

UK100?
LOng?
IF this is right, I would want to ride 1:3 RR
= respecting this trendline
Find out sentiment/ read up.. what would this be a viable idea or not.
Be vigilant on your bullets.
All the best, selective on where to entry.
Not a guru

FTSE pullback after UK economic activity surprises to the upsideThe FTSE (UK100) index price action sentiment appears bullish, supported by the longer-term prevailing uptrend. This morning UK Gross Domestic Product (GDP) rose at a faster pace of 1.4% YoY in the last quarter of 2024, compared to estimates of 1.1% and the 1% growth seen in the third quarter, upwardly revised from 0.9%. Market participants trim BoE expectations for rate cuts after GDP figures are published.
The key trading level is at 8680, which is 25th Feb swing low. A corrective pullback from the current levels and a bullish bounce back from the 8680 level could target the upside resistance at 8800 followed by the 8830 and 8916 levels over the longer timeframe.
Alternatively, a confirmed loss of 8680 support and a daily close below that level could open a way for further retracement and a retest of 8655 support level followed by 8590 and 8540.
This communication is for informational purposes only and should not be viewed as any form of recommendation as to a particular course of action or as investment advice. It is not intended as an offer or solicitation for the purchase or sale of any financial instrument or as an official confirmation of any transaction. Opinions, estimates and assumptions expressed herein are made as of the date of this communication and are subject to change without notice. This communication has been prepared based upon information, including market prices, data and other information, believed to be reliable; however, Trade Nation does not warrant its completeness or accuracy. All market prices and market data contained in or attached to this communication are indicative and subject to change without notice.

This chart is very telling of what comes nextThe chart posted in the ftse 100 I have not altered the labeling and it has tracked almost 94% in the forecast The EU is about to see TRARIFFS and it TOP right into the spirals and trendline So best of LUCK from this week for 2025 the rest of

FTSE bullish run supported at 8680The FTSE (UK100) index price action sentiment appears bullish, supported by the longer-term prevailing uptrend.
The key trading level is at 8680, which is 25th Feb swing low. A corrective pullback from the current levels and a bullish bounce back from the 8680 level could target the upside resistance at 8800 followed by the 8850 and 8916 levels over the longer timeframe.
Alternatively, a confirmed loss of 8680 support and a daily close below that level could trigger a further retracement and a retest of 8655 support level followed by 8590 and 8540.
This communication is for informational purposes only and should not be viewed as any form of recommendation as to a particular course of action or as investment advice. It is not intended as an offer or solicitation for the purchase or sale of any financial instrument or as an official confirmation of any transaction. Opinions, estimates and assumptions expressed herein are made as of the date of this communication and are subject to change without notice. This communication has been prepared based upon information, including market prices, data and other information, believed to be reliable; however, Trade Nation does not warrant its completeness or accuracy. All market prices and market data contained in or attached to this communication are indicative and subject to change without notice.

1:5 Risk to reward sell of FTSEWe have been watching the FTSE since morning and will short it now.
1) There is a AB=CD pattern to sell
2) There is strong 161.8 Fib levels from the previous upswing.
3) Previous day high
4) RSI H1 divergence present
The target is 8585 but we will take profit along the way as it is counter trend.

UK100 - DOUBLE UP ON SHORTINGTeam, we are now doubling up on our shorting position with UK100,
at 8774-8782, STOP LOSS at 8830
Target 1 - 8715-34
Target 2 at 8702-8693
Target 3 at 8675-8665
NOTE: once it hits the first target, bring stop loss to BE.

FTSE 100 index Wave Analysis – 10 February 2025
- FTSE 100 index broke resistance level 8700.00
- Likely to rise to resistance level 8900.00
FTSE 100 index recently broke the resistance area between the key resistance level 8700.00 (which stopped the price at the end of January) and the resistance trendline of the daily up channel from December.
The breakout of this resistance area accelerated the active short-term impulse wave 3 of the higher-order impulse sequence C from last August.
Given the clear daily uptrend, FTSE 100 index can be expected to rise to the next resistance level 8900.00, target price for the completion of the active impulse wave (C).

UK100 INDEX DAILY 07/02/2025A Breakout is confirmed for a bullish run , ThE Bullish daily candle has confirmed our entry.. weekly analysis projects a buy

Bullish momentum to extend?UK100 has reacted off the pivot which acts as a pullback support and could rise to the 1st resistance.
Pivot: 8,683.36
1st Support: 8,576.70
1st Resistance: 8,808.84
Risk Warning:
Trading Forex and CFDs carries a high level of risk to your capital and you should only trade with money you can afford to lose. Trading Forex and CFDs may not be suitable for all investors, so please ensure that you fully understand the risks involved and seek independent advice if necessary.
Disclaimer:
The above opinions given constitute general market commentary, and do not constitute the opinion or advice of IC Markets or any form of personal or investment advice.
Any opinions, news, research, analyses, prices, other information, or links to third-party sites contained on this website are provided on an "as-is" basis, are intended only to be informative, is not an advice nor a recommendation, nor research, or a record of our trading prices, or an offer of, or solicitation for a transaction in any financial instrument and thus should not be treated as such. The information provided does not involve any specific investment objectives, financial situation and needs of any specific person who may receive it. Please be aware, that past performance is not a reliable indicator of future performance and/or results. Past Performance or Forward-looking scenarios based upon the reasonable beliefs of the third-party provider are not a guarantee of future performance. Actual results may differ materially from those anticipated in forward-looking or past performance statements. IC Markets makes no representation or warranty and assumes no liability as to the accuracy or completeness of the information provided, nor any loss arising from any investment based on a recommendation, forecast or any information supplied by any third-party.

UK100?
www.tradingview.com
New highs coming.
Can it be more sweeter? Don't hit my SL
This week n next. Hoping for a good run up.
Have patience in setup.
Not a guru

Selling FTSE at the all time high of 8690The FTSE has reached a critical level and looks ready to come down.
1) There is a double top on D1 with Divergence
2) There is a huge pattern to sell for the 2nd time and target 8260 area
3) There is a smaller pattern to sell as well with a smaller stop loss.
We will take this trade with a smaller stop loss and the big target. This will be a long term trade that may take time to materialize but we will actively monitor it for profits.

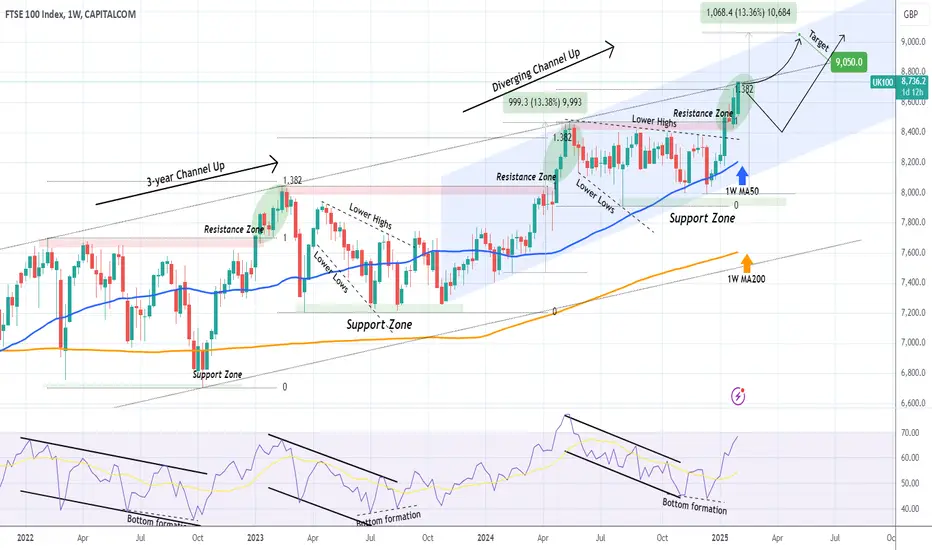
FTSE 100 Target reached. How to trade next.Only a month ago (January 03, see chart below) we gave a strong buy signal on FTSE 100 (UK100) right after it bottomed on its 1W MA50 (blue trend-line):
As you see, the subsequent rebound hit our 8650 Target even quicker than we expected and the price now sits exactly at the top (Higher Highs trend-line) of the 3-year Channel Up.
We will now proceed with the standard break-out or rejection strategy based on candle closing. If the index closes a 1W candle above the 3-year Channel Up, buy and target 9050 by May, which translates to a +13.40% rise from the Higher Low (December 16 2024) of the diverging (blue) Channel Up, similar to its first Bullish Leg.
As long as the index doesn't close a 1W candle above the 3-year Channel Up, our next buy opportunity will be on the 1W MA50 (blue trend-line) again, a fair technical correction/ Bearish Leg. Again the Target will be 9050.
-------------------------------------------------------------------------------
** Please LIKE 👍, FOLLOW ✅, SHARE 🙌 and COMMENT ✍ if you enjoy this idea! Also share your ideas and charts in the comments section below! This is best way to keep it relevant, support us, keep the content here free and allow the idea to reach as many people as possible. **
-------------------------------------------------------------------------------
💸💸💸💸💸💸
👇 👇 👇 👇 👇 👇