FTSE UK Market is about to dive hard. FTSE UK Market is about to dive hard, first one to crack. Bear market is here.
UK100 trade ideas

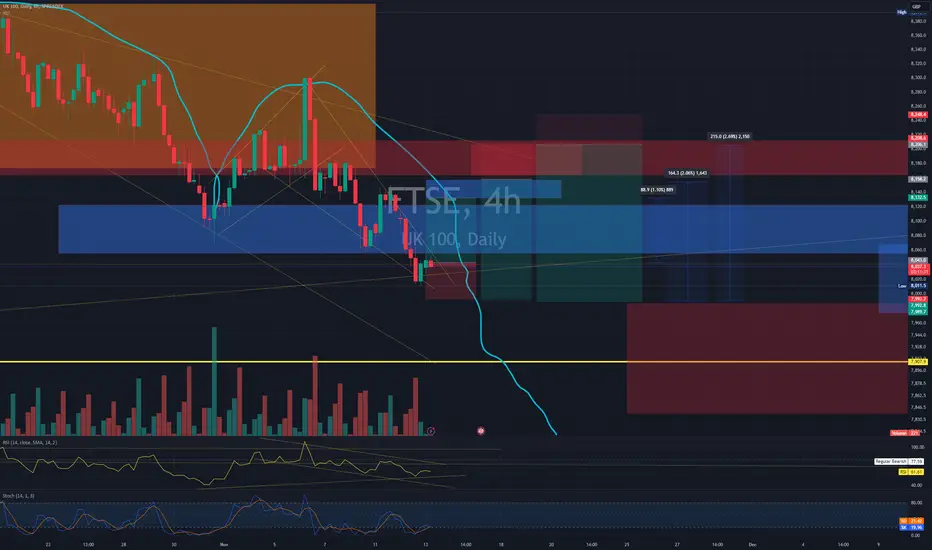
UK100 - TIME TO VISIT NORTHTeam,
We been trading very well with UK last few weeks,
the UK has been reached it lowest range and expect to move toward 8140
We are entering the LONG position at 8067-8070. STOP LOSS AT 8040
Target at 8099
target two at 8136-8142
NOTE: Once the price break above 8105, bring stop loss to BE and and take partial 1st target.

UK100GB to see a limited rally?UK100 - 24h expiry
Price action looks to be forming a bottom.
A higher correction is expected.
The bias is still for lower levels and we look for any gains to be limited.
Rallies continue to attract sellers.
Further downside is expected although we prefer to sell into rallies close to the 8095 level.
We look to Sell at 8095 (stop at 8171)
Our profit targets will be 7943 and 7780
Resistance: 8110 / 8170 / 8230
Support: 7920 / 7780 / 7710
Risk Disclaimer
The trade ideas beyond this page are for informational purposes only and do not constitute investment advice or a solicitation to trade. This information is provided by Signal Centre, a third-party unaffiliated with OANDA, and is intended for general circulation only. OANDA does not guarantee the accuracy of this information and assumes no responsibilities for the information provided by the third party. The information does not take into account the specific investment objectives, financial situation, or particular needs of any particular person. You should take into account your specific investment objectives, financial situation, and particular needs before making a commitment to trade, including seeking advice from an independent financial adviser regarding the suitability of the investment, under a separate engagement, as you deem fit.
You accept that you assume all risks in independently viewing the contents and selecting a chosen strategy.
Where the research is distributed in Singapore to a person who is not an Accredited Investor, Expert Investor or an Institutional Investor, Oanda Asia Pacific Pte Ltd (“OAP“) accepts legal responsibility for the contents of the report to such persons only to the extent required by law. Singapore customers should contact OAP at 6579 8289 for matters arising from, or in connection with, the information/research distributed.

1-hr FTSE100: Traders are Selling Off Their UK StocksThe FTSE100 index remains firmly in a downtrend, highlighted by several Death Cross patterns appearing since last week. This bearish signal, where the 20-period moving average dips below the 60-period moving average, indicates strong selling pressure and an overall negative market sentiment. However, the current price level is relatively low, which may tempt short-term buyers seeking potential bargains. If this buying interest materializes, it could trigger a pullback, lifting the index to 8,064 (23% Fibonacci retracement) or potentially even higher to 8,107 (38% Fibonacci level). These elevated resistance levels could then serve as optimal entry points for traders looking to rejoin the broader downtrend through new short positions.

UK100 - WHAT SHOULD WE DOTeam, with the UK100, we killed 2-3 times yesterday.
let be very careful today,
we are looking to enter long UK100 at 7682-86
and would consider adding more 7960-7976 ranges,
STOP LOSS at 7920-26
Our target 1 - 8005-8015
Target 2 at 8036-45
Target 3 at 8076-84
Once it hits our first target, please take some PARTIAL and bring stop loss to BE.

UK100 - TIME TO ENTRYTeam, apologies for late post
We should send out earlier to entry LONG UK at 8030 ranges
however never too late.
Here are some rules and strategy for the UK
entry now at 8030-8040 ranges
add more at 8016-8006
double up at 7960-7976
STOP LOSS BETWEEN 7915-32
Remember to have some room for stop loss, you can reduce the volume.
Target 1 at 8076-86
Target 2 at 8105-8115
Target 3 at 8135-65
Please note: take some partial at 1st target and bring stop loss slowly

FTSE UK 100we expect to go short today too weekend , but before that the market need a powerfull pullback . we buy here and wait the short next week or friday
thanks please share and like
FTSE UK 100we expect to go short today too weekend , but before that the market need a powerfull pullback . we buy here and wait the short next week or friday
thanks please share and like

UK100 Approaching Key Support Zone for Potential ReversalHello,
CAPITALCOM:UK100 has encountered resistance at the 1M pivot point, leading to further downside movement. Currently, the price is approaching a strong support level at 7942.9445, which has historically held and may present a challenge. The zone between 7954.7045 and 7942.9445 is a potential reversal area, where the price could turn back upward. However, if it establishes itself below this range, further downside could ensue. Confidence is high that this could mark the definitive low before an upward trend resumes, though the opposite scenario cannot be ruled out. Time and confirmation will provide clarity.
No Nonsense. Just Really Good Market Insights. Leave a Boost
TradeWithTheTrend3344

Drop Goes The FTSE - Short Side Case Coming In.The FTSE has shown so much sideways movement in and around highs historically, as investor wonder whether there is a bull or bear case.
Initial growth stats looked reasonable, but the Labour Govt's budget has ripped into the hopes of business in the UK.
Higher taxes will mean lower business revenues, and all sorts of Economic headwinds to follow.
I am still holding shorts lower and accumulating swaps. Any re-push higher and I will re-add shorts.

FTSE UK100 Long - 10.5RExpecting one final move up on the FTSE to occur from this area.
Probably 40% chance of success.

UK100 - TIME FOR ANOTHER ROUND Team, yesterday we went LONG UK and we got both target meet
today we take another long position but LESS risk since our stop loss is tight
entry price at 8068-62 with STOP LOSS at 8052-48
PLEASE NOTE, if it hit our stop loss, we will wait for next week entry at 7960 ranges
Our target at 8096-8105
target 2 at 8115-8126
Target 3 at 8136-45
Once it hit our 1ST target, please take some partial profit and bring stop loss to BE

Recognizing and Overcoming the Belief in Controllable OutcomesIn trading, the illusion of control bias is a cognitive trap where traders believe they can influence outcomes that are, in reality, beyond their control. This misconception can lead to risky behaviors, overconfidence, and trading errors that ultimately hurt performance. Recognizing and managing this bias is essential for any trader who wants to make sound, objective decisions in a largely unpredictable environment. Below, I’ll cover some approaches to understanding and overcoming the illusion of control in trading to help you stay grounded and focused.
1️⃣ Understanding the Illusion of Control Bias: Origins and Impact on Trading
The illusion of control bias stems from a psychological tendency where people believe their actions directly influence outcomes, even when they don’t. In trading, this can manifest as a belief that one can control market movements by timing trades or reading charts “correctly.” This bias often leads traders to make overconfident decisions based on a false sense of power. For example, traders might continue doubling down on a losing position because they “feel” they can predict a turnaround. Recognizing that trading outcomes are ultimately probabilistic helps counter this bias.
2️⃣ Identifying Common Triggers of Control Bias in Market Contexts
Market conditions often bring out the illusion of control. Volatile markets, economic events, and price trends can encourage traders to believe they have some insight or edge in controlling outcomes. For instance, a trader might think that by analyzing a chart pattern, they can influence the outcome of a trade. But no matter the experience level, all market variables cannot be controlled. Reflecting on such instances and identifying specific triggers, like earnings announcements or economic reports, helps traders develop awareness and avoid illusion-driven decisions.
3️⃣ Differentiating Between Influence and Control in Trading Decisions
One effective way to mitigate control bias is by distinguishing between having influence over decisions and controlling outcomes. Traders can influence which assets they choose, their entry and exit points, and risk management strategies, but they can’t control how the market will react. Practicing this mindset requires a shift in focus: rather than concentrating on whether an outcome aligns with expectations, traders can measure success based on disciplined adherence to their strategy, regardless of short-term market swings.This is usually one of the toughest concepts for me to drive home for inexperienced students.
4️⃣ Analyzing Historical Examples of Control Bias in Trading Failures
History offers countless examples of how control bias has affected trading outcomes. For instance, during the tech boom in the early 2000s, many traders believed they could predict stock prices due to a sustained period of upward movement. When the bubble burst, the illusion of control was shattered for many who hadn’t properly hedged against risk. Similarly, learning from past mistakes—both personal and from case studies—can prevent a similar mentality. Reviewing such events serves as a practical exercise to remain grounded.
5️⃣ Building a Routine of Objective Decision-Making
A structured, rules-based approach to trading can help keep control bias at bay. For example, a well-designed trading plan that includes entry and exit strategies, risk levels, and routine performance reviews can remind traders that long term, sustainable and consistent success isn’t based on market control but on disciplined execution. Daily reflection exercises, where one reviews both winning and losing trades objectively, help isolate controllable factors (like trade size) from uncontrollable ones (like price fluctuations), grounding decisions in a factual, less emotion-driven framework.
6️⃣ Implementing Techniques for Emotional Detachment
Another approach to overcoming the illusion of control is to foster emotional detachment from each trade outcome. Techniques like mindfulness and meditation are effective for staying present, reducing emotional responses, and distancing oneself from personal attachment to outcomes. For example, practicing meditation before trading hours can help keep emotions in check and remind traders to focus on their plan rather than on “winning” a trade. Developing these techniques trains the mind to treat each trade as an execution of strategy rather than a conquest.
7️⃣ Leveraging Performance Metrics to Replace Bias with Data
By tracking performance metrics, you can maintain objectivity and let data, not emotion, guide decisions. For instance, recording key metrics such as win/loss/DC ratio, drawdown, size to equity ratios helps you see the reality of your approach. If a strategy shows success based on predefined metrics, then it can reinforce the right habits and decisions. This data-driven approach serves as a constant reminder that the trader’s performance isn’t a matter of market control but of disciplined adherence to a well-defined strategy.
Understanding and overcoming the illusion of control bias is critical for every trader. By recognizing that markets cannot be controlled, focusing on influence over outcomes, maintaining discipline, and relying on objective data, you can build resilience against this pervasive bias. By making consistent efforts to remain objective, you position yourself to make more rational decisions, improving your performance over time.

uk 100 sell tradeThe Relative Strength Index (RSI) is showing a downward trend, indicating weakening momentum. Additionally, the Moving Average Convergence Divergence (MACD) is showing a bearish crossover, further supporting the potential for a downward move.

UK100 - SHOPPING TIME IS OVERTeam, yesterday we went long UK with target hit
as Today, I expect the downtrend hit toward 8080-65
So please enter slowly with RISK MANAGEMENT
Our target is 8096-8115 - TAKE SOME PARTIAL and bring stop loss to BE.
Target 2 at 8132-46
Target 3 at 8178-96
We play our STOP loss far away at 8035, if it hit stop loss RE-ENTER again. with another 30 points stop loss

UK100 - it has been a whileTeam, with the UK100, we have not been trade since last week
we want to want for the RATE announcement
today 25% basic points is off the market
ENTER long/buy at 8150-55
We will consider add more at 8115-30
We need to move our stop loss far so we can move back once it it hit our first target like 8080-8065
Target 1 at 8180-82 - once it hit our target - take partial and bring stop loss to BE
Target 2 at 8225-40
Target 3 at 8245-65
Remember to enter slowly with RISK management.

FTSE BEARThere are 3 targets for the bear in this set-up. Lets see if its ready to go lower than TP3.

UK100 Bearish Trend We in a Bearish Trend going lower from UK100. We on a consolidation Trend going lower as we about to sell. Price has broken Resistance to Support to sell lower.

Retest of established highsThe index rejected and bounced off 8.151 signalling continued upward movement towards the top. The 8.280-8.325 we'll likely halt the bullish momentum as it is an area of resistance.

Potential Moves for UK100
Watching UK100 right now.
it just entered a 4H FVG, if double top confirmation happens, I will be looking for shorts.
Alternatively the FVG will be violated and it will carry on with a bullish trend.
Let's see

UK100: Key 1M Pivot Point Signals Potential Bullish MomentumHello,
The 1M pivot point for CAPITALCOM:UK100 is critical right now. If prices hold steadily above it, we could see the bulls regain control. However, if it acts as resistance, the 1M support structure may be tested, possibly down to its full extent. For now, a neutral outlook remains in place trend-wise. In the long term, however, there is still strong confidence in a bullish continuation, which currently appears highly likely.
No Nonsense. Just Really Good Market Insights. Leave a Boost
TradeWithTheTrend3344

UK100 H4 | Rising into 61.8% Fibonacci resistanceUK100 is rising towards a swing-high resistance and could potentially reverse off this level to drop lower.
Sell entry is at 8,231.90 which is a swing-high resistance that aligns close to the 61.8% Fibonacci retracement level.
Stop loss is at 8,260.00 which is a level that sits above the 61.8% Fibonacci retracement level and an overlap resistance.
Take profit is at 8,168.78 which is a swing-low support that aligns close to the 50.0% Fibonacci retracement level.
High Risk Investment Warning
Trading Forex/CFDs on margin carries a high level of risk and may not be suitable for all investors. Leverage can work against you.
Stratos Markets Limited (www.fxcm.com):
CFDs are complex instruments and come with a high risk of losing money rapidly due to leverage. 64% of retail investor accounts lose money when trading CFDs with this provider. You should consider whether you understand how CFDs work and whether you can afford to take the high risk of losing your money.
Stratos Europe Ltd (www.fxcm.com):
CFDs are complex instruments and come with a high risk of losing money rapidly due to leverage. 66% of retail investor accounts lose money when trading CFDs with this provider. You should consider whether you understand how CFDs work and whether you can afford to take the high risk of losing your money.
Stratos Trading Pty. Limited (www.fxcm.com):
Trading FX/CFDs carries significant risks. FXCM AU (AFSL 309763), please read the Financial Services Guide, Product Disclosure Statement, Target Market Determination and Terms of Business at www.fxcm.com
Stratos Global LLC (www.fxcm.com):
Losses can exceed deposits.
Please be advised that the information presented on TradingView is provided to FXCM (‘Company’, ‘we’) by a third-party provider (‘TFA Global Pte Ltd’). Please be reminded that you are solely responsible for the trading decisions on your account. There is a very high degree of risk involved in trading. Any information and/or content is intended entirely for research, educational and informational purposes only and does not constitute investment or consultation advice or investment strategy. The information is not tailored to the investment needs of any specific person and therefore does not involve a consideration of any of the investment objectives, financial situation or needs of any viewer that may receive it. Kindly also note that past performance is not a reliable indicator of future results. Actual results may differ materially from those anticipated in forward-looking or past performance statements. We assume no liability as to the accuracy or completeness of any of the information and/or content provided herein and the Company cannot be held responsible for any omission, mistake nor for any loss or damage including without limitation to any loss of profit which may arise from reliance on any information supplied by TFA Global Pte Ltd.
The speaker(s) is neither an employee, agent nor representative of FXCM and is therefore acting independently. The opinions given are their own, constitute general market commentary, and do not constitute the opinion or advice of FXCM or any form of personal or investment advice. FXCM neither endorses nor guarantees offerings of third-party speakers, nor is FXCM responsible for the content, veracity or opinions of third-party speakers, presenters or participants.

Retest of the established highThe index rejected and bounced off 8.151 signalling continued upward movement towards the top. The 8.280-8.325 we'll likely halt the bullish momentum as it is an area of resistance.
