UK 100 Scalp 15 Min.Welcome to my Scalp room. 🔥 is in the Air. 🚀🚀
02/19-02/26 2024 Nr. 004
I SELL UK 100 MARKET Capital.com in Timeframe 15 Min.
Make 1-2 Trades
The Market structure is lower
Make a Trade @ Entry 4h Resistance line
Profit 1 @ 4h Support line
Profit 2 you can HOLD
Position HOLD💎
SL@ Break and close the 4h Support
UK100 trade ideas

UK100 an IdeaUK100 - Just an idea I'm monitoring to play out with a small trade.
Price seems to be respecting this channel on the up trend

FTSE(UK100)My last charts triangle pattern was technically violated.
So here's a new one, which lines up perfectly and make that little bit more sense of what is happening.
As I see it, as long as we stay above 7200-7400 a pump to 8k is a lot more likely as theirs evidently buyers in the market keeping the FTSE floating, where as a break below will send this south (6700 or lower).

$UKX #FTSE100 - Several Patterns combined...A concentration of lines giving clear patterns for actionable areas of entry on Break/Outs. Expect volatility to continue whilst with the shaded bands forming the 'Coil'.
A Breakout could be produce quick profits as the range has be ongoing for a couple of years compressing the energy. The 'Ascending Triangle' (Gold) would be my preferred plot with upside/downside targets respectively of 8220 & 7000 and to micro-manage the trade from then on.

Possible exit and pickup in the FTSE!After yesterday's news about turning the FTSE into a higher weighted index similar to the Nasdaq today we have seen a directional upward correction. The truth is that the London index already lived through a dot.com bubble in the 90's, and although this value weighting is currently very diversified with a lot of weighting to defensive companies or productive sectors, unlike in those times: financials account for 19.20% of the total, non-cyclical consumer 16.41%, health 12.77%, commodities 9.35%, energy 12.71%, cyclical consumer 7.98%, %, industrials 9.58%, and real estate 1.01% respectively. What can be seen is that inflation and industrial production data, as well as British CPI and 10-year bond sales, have been clearly reflected in the value of the index directly, this has also been represented in the British currency strongly. We will see if the Eurozone growth and employment data will move the EURGBP cross.
On the technical aspect, the last candlesticks of price recovery after the last shoulder-head-shoulder, were very clear. On February 8 we had a crossover of the 21-day and 100-day averages, on February 12 we had again the crossover of the 100-day and 233-day averages. And currently the three averages are inverted. If we look at the RSI divergence, the index is overbought. And the current price zone indicates 7504.89 points. If we look at the index on a monthly basis it is progressing in an uptrend, and since the end of November when the index went sideways, there has been a double bottom. It is possible that this oversold could signal two things: On the one hand, that the movement despite being at 69% overbought can continue to climb back to the top of the channel to 7775.85 points at its current high . Or on the other hand, that the price may not hold and fall back to that 7408.60 floor that has taken hold. It is possible that the export data could be affected, given that its main clients are the US and the Euro zone.
Ion Jauregui - AT Analyst
The information provided does not constitute investment research. The material has not been prepared in accordance with the legal requirements designed to promote the independence of investment research and such should be considered a marketing communication.
All information has been prepared by ActivTrades ("AT"). The information does not contain a record of AT's prices, or an offer of or solicitation for a transaction in any financial instrument. No representation or warranty is given as to the accuracy or completeness of this information.
Any material provided does not have regard to the specific investment objective and financial situation of any person who may receive it. Past performance is not reliable indicator of future performance. AT provides an execution-only service. Consequently, any person acing on the information provided does so at their own risk.

UKX FTSE 100 index falling stronglyFTSE 100 index falling strongly
– Likely to fall to support level 7440.00
FTSE 100 index falling strongly after the price failed to break above the major resistance level 7700.00 (which has been repeatedly reversing the index from June of last year).
The resistance level 7700.00 was strengthened by the upper daily Bollinger Band and by the 61.8% Fibonacci correction of the previous downward impulse from February.
FTSE 100 index can be expected to fall further to the next support level 7440.00 (which stopped the two of the pervious waves ii and i)

UK100 8 hours short rips/rallies tp 7350🔸Hello traders, this is 8hour chart of UK100. Recently trading in well-defined
trading range, risk/reward flipped in bears favor after we got rejection near
range highs, therefore recommend to focus on sell setups.
🔸Range highs set at 7660, range lows set at 7350, premium prices overhead
at 7700 and 7750, below at 7250 and 7300. Trading now near range highs.
🔸Recommended strategy bears: focus on short selling rips/rallies, bears
will target re-test of range lows near/at 7350. strong risk/reward on sell side.
🎁Please hit the like button and
🎁Leave a comment to support our team!
RISK DISCLAIMER:
Trading Futures , Forex, CFDs and Stocks involves a risk of loss.
Please consider carefully if such trading is appropriate for you.
Past performance is not indicative of future results.
Always limit your leverage and use tight stop loss.

UK Index HuntThis is a little bit of a bold project if the predictions or projections of simulated scenarios hit their marks, but it will also be a platform for candlestick patterns and formations analysis in an attempt to hunt for potential reversals. Previous such pivot points or reversals have been highlighted in past price action, most of them having in common the candlestick shadows that signal a support/resistance level or a break/weakness in previous momentum or change in sentiment.
The main scenario would be a crazy one involving a climb near the white rectangle, following the dots, reaching the ellipse, falling for the blue rectangle, and further slower climbing down, touching the second yellow rectangle and finally reaching the big green rectangle below with maybe a pivot point or a candlestick shadow at the first icon. The second icon is not necessarily a target as price prediction (at its specific time +- a day or 2) but it will count if it is a hit, as usually all icons carefully placed (or random) in nen projects.
The second scenario just treats the rectangles as zones of influence for potential support/resistance with a higher interest in the first yellow rectangle as a milestone that can be hit. The time stamp of the ellipse is also relevant in case any curious candlestick formations occur near or at it.
The bigger scope of the project though, is the platform that wishes to observe the price action and hunt for pivot points through Japanese Candlesticks, the elements being just for context and advanced reference (in time). Hopefully, as the first paragraph suggests, we will be able to see a similar formation pattern with several candlestick shadows that might signal a potential turnaround, although these patterns can be temporary, depending on the flow and situation in the markets.

UK100 Pushing downThe UK100 has failed many times to break above the key resistance and we recently saw price break below the structure around the main key level. In addition to the technicals, the macro datas suggest that the index should get weaker within the coming days... I beleive we should see price go as low as 7405 pounds.

FTSE 100: Fibonacci Levels to WatchFTSE Respects Fib Levels Within Long-Term Range
The FTSE 100 has been locked in a well-defined trading range since last summer. The market has failed to break above the resistance zone on multiple occasions and we have also seen several swift bounces from the support zone (see chart below).
Within the context of this long-term trading range, we can use key Fibonacci retracement levels as a tool to time inflection points. In recent weeks we have seen the market rally from a 61.8% retracement of the Nov-Jan bull run. And last week, the FTSE reversed and sold off from the 78.6% Fibonacci retracement of the New Year sell-off – an area confluent with the top of the long-term trading range.
FTSE 100 Daily Candle Chart
Past performance is not a reliable indicator of future results
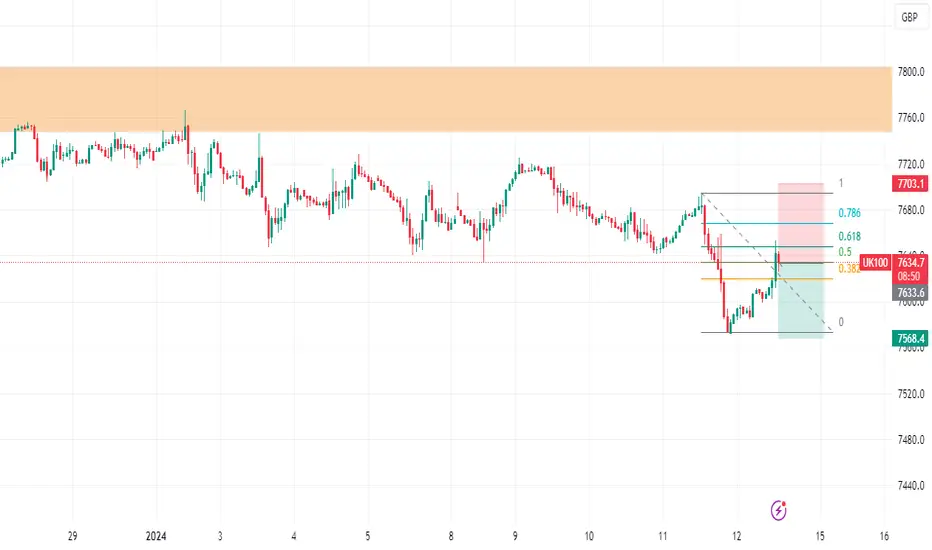
Gartley Pattern Taking Shape
With recent price action on the FTSE respecting two Fibonacci retracement levels, we can take this analysis one set further and project where the next inflection may occur. To do this, we can use an advanced Fibonacci pattern called the Gartley Pattern…
The Gartley pattern has a beautiful harmonic aesthetic. The pattern essentially looks to enter the market on a two-legged pullback from the impulse leg (X-A) highs. The two-legged pullback should take the market back down towards the 78.6% retracement of the impulse leg – potentially creating a trade setup which has attractive levels of risk reward.
Here are the Gartley pattern rules that must be met:
AB retraces XA by 61.8%
BC retraces AB by 38.2% to 88.6%.
CD retraces XA by 61.8% to 78.6%.
Here’s how the pattern is shaping up on the FTSE 100:
FTSE Potential Gartley Pattern
Past performance is not a reliable indicator of future results
How to Trade the Gartley Pattern:
Entry and Stop: Traders typically enter upon completion of the pattern near the D point, implementing a stop-loss below or above point X.
Targets: Point C makes for a clean initial target, with secondary targets coming in at point A – an area that coincides with the top of the long-term range.
Insight: Rather than simply entering on D – wait for a reversal candle pattern to form. This can help to ensure that your entry is aligned with short-term and can help to tip the probabilities of success in your favour.
For more information on Advanced Fibonacci Patterns, check out the link at the bottom of this page.
Disclaimer: This is for information and learning purposes only. The information provided does not constitute investment advice nor take into account the individual financial circumstances or objectives of any investor. Any information that may be provided relating to past performance is not a reliable indicator of future results or performance. Social media channels are not relevant for UK residents.
Spread bets and CFDs are complex instruments and come with a high risk of losing money rapidly due to leverage. 84.01% of retail investor accounts lose money when trading spread bets and CFDs with this provider. You should consider whether you understand how spread bets and CFDs work and whether you can afford to take the high risk of losing your money.

Lacklustre London Market To Remain Global LaggardIt’s been said may times now that the UK equity market is ‘cheap’ – in fact, getting a pound for every time that description is used in a research note may well result in better performance than the market itself has recently been able to achieve. Being ‘cheap’, however, is not reason enough to assume that the London market’s fortunes may soon turnaround, as this note shall explore.
Firstly, some charts, and context.
There’s no better place to start than with a quick look at the FTSE 100 which, frankly, has now gone nowhere for around 18 months, with the index stuck between 7,250 to the downside, and 8,000 to the upside. That 8k handle was, briefly, broken for the first time at the start of last year, leading some to expect momentum to continue to the upside, though it was not long before trade became rather turgid once more, and the market reverted to form, and went back to moving sideways.
Of course, the FTSE 100 is an internationally-focused index, hence the traditional inverse correlation it has with the value of the GBP, owing to the value of overseas earnings increasing upon repatriation to the UK as the currency weakens.
A much better measure of domestic equity performance is the FTSE 250. Sadly, this doesn’t bring any cause for positivity whatsoever, with the midcap index having fallen over 20% from the record high printed in mid-2021.
Turning back to the FTSE 100, there are many reasons for the recent run of dismal performance. Perhaps the most significant is the composition of the index itself, with over 60% of the index being concentrated in the consumer staples, financials, industrials, and energy sectors. Not only are these some of the worst performing sectors, on a global basis, over the last year or so, there is also a notable absence of technology stocks – which have been booming for the last 18 months – in the FTSE 100.
In fact, the information technology sector has just a 1% weighting in the London benchmark, with just 2 members – Sage Group, and Halma – being present, neither of whom are anywhere near akin to Stateside tech behemoths such as Apple, Alphabet, Meta, etc.
This contrast becomes even sharper when one compares the recent performance of some of the largest stocks in the FTSE 100, and the S&P 500. By now, the ‘magnificent seven’ moniker is familiar, with those seven names – Apple, Amazon, Alphabet, Meta, Microsoft, Nvidia, and Tesla – being among the biggest US stocks by market cap, and having propelled Wall Street higher for much of the last year, and vastly outperforming peers.
One can construct a similar basket of the biggest stocks by market cap for the FTSE 100, which results in the following motley crew – AstraZeneca, Shell, HSBC, Unilever, Rio Tinto, BP and GSK. Two healthcare names, two in energy, a bank, a miner, and one in consumer staples. More of a ‘sick seven’ than a ‘magnificent’ one, as the chart below shows.
Clearly, that performance gulf is vast, and only becoming increasingly so, despite the dismal performance of TSLA since the turn of the year pressuring the ‘magnificent seven’ somewhat, with the EV manufacturer down around 20% YTD.
However, such a performance gulf is not only present by handpicking some select stocks, but is also clear at a broad index level. For instance, the FTSE 100 is now at record levels of underperformance against the S&P 500 in both FX-adjusted, and un-adjusted terms.
Given all the ‘doom and gloom’ in this note so far, I would typically try to end on a brighter note.
However, that shan’t be possible, with the outlook for UK equities remaining a rather pessimistic one – cheap valuations alone are not an excuse to be bullish, as the market can surely continue to get cheaper, just look at China for an example of that phenomenon in action. Furthermore, continued anaemic economic growth, including the possibility of the UK having slipped into a mild technical recession at the end of last year, along with a continued stream of institutional outflows are both set to pose continued headwinds.
Perhaps the best opportunity for sustained UK equity upside, a little concerningly, comes from the political realm, with politicians on both sides of the aisle at long last seemingly focusing on the shamefully poor state of the UK market. Proposed reforms to improve the attraction of London as a listing venue, in an attempt to resuscitate the tumbling number of IPOs – just 23 in 2023, a 69% YoY drop – are much-needed, and long overdue. Measures to improve equity demand, including rumoured changes to ISAs, as well as potential efforts to increase investment from pension funds, are also likely to be welcomed by the market.
On the whole, though, this ‘tinkering round the edges’ will do little to fix the long-running structural issues that have dogged the FTSE 100 for some time, such as the index’s ‘old-fashioned’, old economy composition, likely leaving the London market to underperform Wall Street for some time to come.

UK100 could possibly go downThere's a possibility that UK100 might be heading downwards, considering its prolonged upward movement. Two bearish divergences are evident, potentially indicating a formation of a lower high (LH). Divergences are visible across multiple timeframes, strengthening my conviction in the downward trajectory. A trade setup is provided on the chart. I'm interested in hearing your thoughts on this. Cheers!

FTSE - BEARYes the Structure has not let me down on any pair i trade... Here is #FTSE and how I've basically slapped around the index from every structure point... Now is waiting to the set-up on the BEAR !
New year gifts are getting sent out early.... Your welcome.
If you want to see other products get in touch and i will output the levels relevant to stay on side with SMART money... Play with the big banks...
Oh and to see target two you will have to zoom out

UK100UK100 bullish idea,
1- bullish divergence
2- trend shift bearish to bullish as per dow theory.
3- price took support on daily time frame.
UK 100 SHORT ideaInverted flag pattern spotted.
This should mean that we will see down move with a good opportunity to sell.
Trend channel has broken and also retested it.
Inverted flag pattern signals a bearish move.
Trade with caution.
Cheers,
Mags

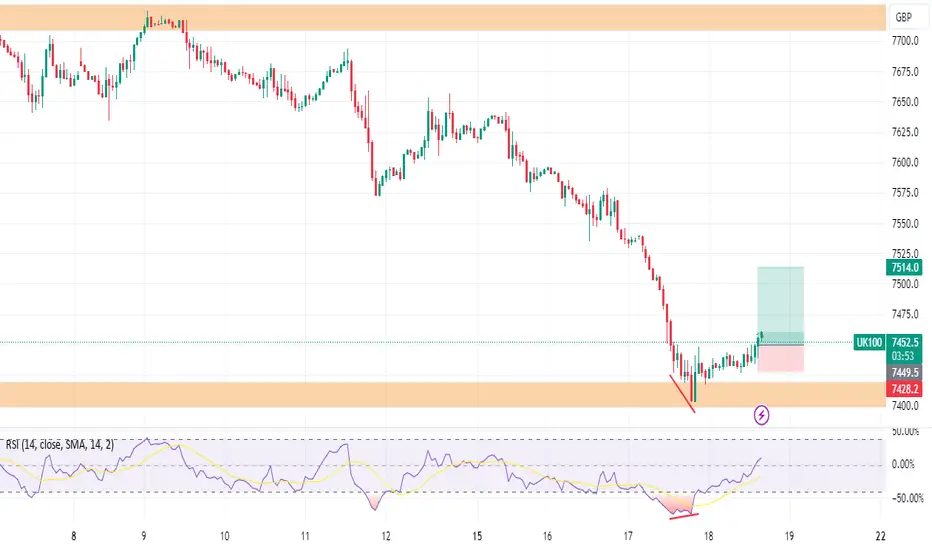
The UK100 Price Plummeted After the Publication of InflationThe UK100 Price Plummeted After the Publication of Inflation Data
Yesterday, the stock market in the United Kingdom experienced a sharp decline following the release of new inflation data. The UK100 price, reflecting the leading British stock index FTSE, dropped approximately 1.5%. Moreover, the RSI indicator on the 4-hour chart fell below the value of 18 for the first time since July 2023.
Analysts attribute this decline to the published inflation data, which not only failed to meet economists' expectations but also indicated a possible strengthening of inflationary pressure in the country. CPI values: actual = 4.0%, expected = 3.8%, previous value = 3.9%.
This raised concerns among investors regarding the Bank of England's future steps in managing interest rates and the potential slowdown in the country's economic growth.
Sectors most sensitive to changes in interest rates, such as real estate and finance, showed the greatest decline. Significant decreases were also observed in the stocks of companies in the retail and consumer goods sectors, reflecting growing concerns about consumer confidence and spending.
The UK100 chart shows that:
→ the price dropped to the lower boundary of the channel, indicated in blue;
→ market weakness could be inferred from the inability of the UK100 price to stay above the September maximum in December, as well as price action around the 7665 level, which switched roles from support to resistance.
If new negative news emerges for the stock market, support from the lower boundary of the channel may be breached. In that case, it is not excluded that the UK100 stock index will decline to the level of 7300, which served as strong support throughout 2023.
This article represents the opinion of the Companies operating under the FXOpen brand only. It is not to be construed as an offer, solicitation, or recommendation with respect to products and services provided by the Companies operating under the FXOpen brand, nor is it to be considered financial advice.

Bearish Breakdown: FTSE 100 Inverse Cup & Handle FormationBody:
The FTSE 100 index exhibits a compelling technical structure, presenting a potential bearish opportunity. An Inverse Cup & Handle pattern has formed, signaling downward pressure. This classical pattern is often indicative of a continuation in bearish momentum following a consolidation period that resembles a 'cup and handle' in reverse.
Entry Point:
The trade initiated at the 7529.3 level, a strategic entry post the pattern's confirmed breakdown.
Stop Loss:
A prudent stop loss is placed at 7583.8, positioned above the pattern's resistance to account for any potential upside volatility and false breakouts.
Take Profit Targets:
Take Profit 1: Set at 7477.1, likely derived from previous support levels or a desired risk-reward ratio.
Take Profit 2: Further down at 7421.0, which may align with extended support zones or a Fibonacci level.
Supporting Indicators:
Volume patterns align with the bearish outlook, and the RSI oscillator's neutral
read indicates there's still room for the price to move without hitting overbought or oversold levels.
Rationale:
The rationale behind this trade is grounded in classic technical pattern recognition. The Inverse Cup & Handle is a reliable pattern, hinting at a continuation of the prior downtrend. This bearish setup is further supported by the recent price action, which shows a break and retest of the pattern's support-turned-resistance level.
Trade Management:
This trade idea emphasizes the importance of risk management. Adjustments to the stop loss and take profit levels should be considered if the market environment changes or new information comes to light.
Conclusion:
Given the bearish pattern and confirmatory indicators, the FTSE 100 may be poised for a descent. As with all trades, this idea requires monitoring for adherence to the pattern's implications and adjustment based on real-time market developments.


UK100UK100 bearish idea, trend is bearish, price retrace and touch 61.1 fib level, most probably price will continue it's downtrend.
FTSE 100 Big triangle from 2023 breakout and retestOn the Daily chart for FTSE 100, we can observe a massive triangle that was forming in 2023. It started in Februaty and produced a breakout in December. For the past few days the price has been correctign and now it's retesting the resistance of the triangle, now acting as a support.
This support is aligning with the 0.382 Fib and the 200 SMA
The development on it is very important. If the price provides a reversing indication in the following hours, this can be a nice entry for a trade that can target the previous swing high at around 7750 - 7770 and bossibly higher

FTSE to find buyers at market price?UK100GB - 24h expiry
The correction lower is assessed as being complete.
Further upside is expected.
Short term RSI has turned positive.
A move through 7725 will confirm the bullish momentum.
The measured move target is 7775.
We look to Buy at 7710 (stop at 7670)
Our profit targets will be 7810 and 7830
Resistance: 7725 / 7750 / 7775
Support: 7700 / 7685 / 7675
Risk Disclaimer
The trade ideas beyond this page are for informational purposes only and do not constitute investment advice or a solicitation to trade. This information is provided by Signal Centre, a third-party unaffiliated with OANDA, and is intended for general circulation only. OANDA does not guarantee the accuracy of this information and assumes no responsibilities for the information provided by the third party. The information does not take into account the specific investment objectives, financial situation, or particular needs of any particular person. You should take into account your specific investment objectives, financial situation, and particular needs before making a commitment to trade, including seeking advice from an independent financial adviser regarding the suitability of the investment, under a separate engagement, as you deem fit.
You accept that you assume all risks in independently viewing the contents and selecting a chosen strategy.
Where the research is distributed in Singapore to a person who is not an Accredited Investor, Expert Investor or an Institutional Investor, Oanda Asia Pacific Pte Ltd (“OAP“) accepts legal responsibility for the contents of the report to such persons only to the extent required by law. Singapore customers should contact OAP at 6579 8289 for matters arising from, or in connection with, the information/research distributed.

FTSE Retreats from Resistance ZoneNew Year Hangover for the FTSE
After a strong festive period, the FTSE’s first week of trading in 2024 resembled something of a damp firework…
Having rallied from the support zone in late October all the way to the resistance zone in mid-December (see chart below), the FTSE has stalled and in recent sessions started to retreat. We’ve seen the market reject resistance five times in less than a month – indicating that FTSE bulls are starting to take profits.
It’s worth noting that the dominant market structure on the FTSE is a sideways range which has been in place since the summer. Until we see the market break and hold above the resistance, we can assume that the range will remain in play.
FTSE 100 Daily Candle Chart
Past performance is not a reliable indicator of future results
Lower Swing Highs Form on Hourly Candle Chart
Examining the hourly candle chart reveals a bearish sequence of lower swing highs after the recent rejection of resistance. In the short term, the market has found tentative support, but a breach could trigger increased selling pressure.
FTSE 100 Hourly Candle Chart
Past performance is not a reliable indicator of future results
Sector Snapshot
At the sector level, we have seen a ‘risk-off’ positioning emerge over the last seven sessions. Defensive sectors such as Healthcare, Utilities and Consumer Staples have been leading the market. While aggressive sectors linked to the anticipation of lower interest rates such as Materials, Consumer Discretionary and Real Estate have erased some of their December gains.
UK Sector Snapshot (7 Days)
Past performance is not a reliable indicator of future results
Disclaimer: This is for information and learning purposes only. The information provided does not constitute investment advice nor take into account the individual financial circumstances or objectives of any investor. Any information that may be provided relating to past performance is not a reliable indicator of future results or performance. Social media channels are not relevant for UK residents.
Spread bets and CFDs are complex instruments and come with a high risk of losing money rapidly due to leverage. 75% of retail investor accounts lose money when trading spread bets and CFDs with this provider. You should consider whether you understand how spread bets and CFDs work and whether you can afford to take the high risk of losing your money.

UK Index 100 FTSE 100 is neutralPivot
7805.00
Our preference
Short positions below 7805.00 with targets at 7540.00 & 7445.00 in extension.
Alternative scenario
Above 7805.00 look for further upside with 7930.00 & 8047.00 as targets.
Comment
The RSI has struck against a major resistance around 70% and is reversing down.
Supports and resistances
8047.00
7930.00
7805.00
7662.67 Last
7540.00
7445.00
7280.00
Number of asterisks represents the strength of support and resistance levels.
