Dow Jones Wave Analysis – 12 May 2025
- Dow Jones broke the resistance area
- Likely to rise to resistance level 43000.00
Dow Jones index recently broke the resistance area between the resistance level 42000.00, 61.8% Fibonacci correction of the downward impulse from February and the resistance trendline from the same month.
The breakout of this resistance area accelerated the C-wave of the active ABC correction (2) from the start of April.
Dow Jones index can be expected to rise to the next resistance level 43000.00 (former top of wave 4 from March).
US30 trade ideas


US30 Sell Setup before the BIG MOVE TO THE MOON" US30 has been moonwalking higher like it’s got a VIP pass—thanks to those cozy deals between the US and EU. The bulls are charging like they’ve had one too many energy drinks, and honestly, it’s getting a little too enthusiastic up here.
So, I’m eyeing a sneaky short sale for a quick snack of profit before the long-term feast. But I won’t just dive in like a reckless lemming—oh no, I’ll wait for my trusty confirmations to wave their little green (or red?) flags first.
As for the long game? Once my short-sell shenanigans hit those sweet support levels (and hopefully bounce like a trampoline), I’ll switch teams and ride the buy train. Because why pick a side when you can profit from both?"
Hope that brings a smile while keeping your trading strategy sharp! 😆📈

DOW JONES: Breached the 1D MA200. Tariff War 2018 Recovery aheadDow Jones is on excellent bullish levels on its 1D technical outlook (RSI = 62.103, MACD = 203.720, ADX = 34.693) and as it crossed today above the 1D MA200 for the first time since April 2nd, and practically validates the recovery from the Tariff War correction, it draws strong comparisons with the last U.S.-China Tariff War in 2018. Both rebounded after highly oversold 1D RSI levels, and the 2019 recovery almost hit the 0.9 Fibonacci level before turning into a less aggressive recovery. The trade is long, TP = 44,100.
## If you like our free content follow our profile to get more daily ideas. ##
## Comments and likes are greatly appreciated. ##

US 30 - Ranges overview (update) Let's have a look at US 30. Just like most markets it's trading up and following the plans we sketched out earlier.
Let's see how me trade from here.
We are currently entering the HTF inverted FVG sitting around 42115.
IF we hold the HTF inverted fair value gap expect us to aggressively trade towards 42500 and and the buyside liquidity sitting around 45000 (red line).
IF we fail to hold the HTF inverted fair value gap expect us to trade back towards 40400.
Stay safe and never risk more than 1-5% of your capital per trade. The following analysis is merely a price action based analysis and does not constitute financial advice in any form.

Weekly Forex Outlook Sun.May.11.2025 - Fri.May.16.2025Like and Comments would be appreciated :D Not Financial Advice, Just my outlook/opinion

Weekly Forex Outlook Sun.May.11.2025 - Fri.May.16.2025Like and Comments would be appreciated :D Not Financial Advice, Just my outlook/opinion

US30 Breaks Out – New Highs Incoming (12/05/2025) 📈 US30 Breaks Out – New Highs Incoming? (12/05/2025) 🚀
US30 just smashed through key resistance at 41,400–41,700 and is now trading above 42,150 🟢. After weeks of range-bound structure, buyers finally broke the chokehold with volume and momentum confirmation.
Both the 20 EMA (white) and 50 EMA (blue) are angled up — and price is riding above them. We’re in strong bullish structure 🧠.
🔑 Updated Key Levels:
📍 New Support: 41,700–41,400 (previous resistance flipped)
⚠️ Mid-support: 40,694
🧱 Major Support: 39,775
🎯 Next resistance to watch: 42,359 (previous swing high zone)
🎯 Playbook Going Forward:
✅ Hold above 41,700? → Expect continuation to 42,359 and possibly 43K+
⚠️ Fakeout alert: If we close back below 41,400 on high volume → bear trap or liquidity grab
🧠 Pullbacks into EMAs = potential long entries with confluence
🧠 Psychology Check:
Don’t short strength — wait for breakdown structure
High breakout = higher risk → let price pull back to react

Upward trend It is expected that the uptrend will continue and the index will break through the resistance level. With the consolidation above the resistance level, the uptrend will continue.

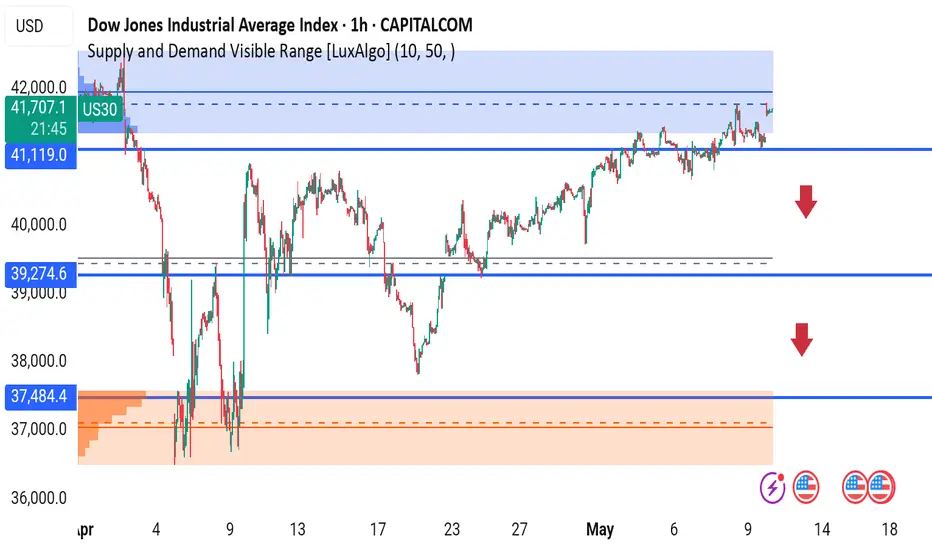
US30 Reaches Critical Resistance – Breakout or Major Rejection IThe Dow Jones is testing a key supply zone near 41,700 after a strong bullish rally. But with multiple U.S. economic events on deck, this could be a make-or-break moment for US30.
1H Technical Breakdown:
1. Major Supply Zone (Resistance):
41,119 – 41,800 zone is a major supply cluster identified by LuxAlgo’s Visible Range.
Price is consolidating right at the top – signs of distribution may be forming.
2. Key Support Levels to Watch:
39,274: If the price rejects and breaks below this, a medium-term reversal could start.
37,484: High volume demand area and previous macro support – this would be the key bounce zone in case of sharp correction.
3. Bullish or Bearish?
Bullish case: Break and hold above 41,800 could trigger a squeeze toward all-time highs.
Bearish case: If the index fails to clear this supply zone and drops below 41,119, expect pullbacks to 39,274 and potentially 37,484.
4. Macro Catalyst:
Multiple U.S. economic events approaching (highlighted on chart: CPI, FOMC, etc.)
These will bring volatility – timing your entries around them is critical!
Possible Trade Setups:
Short Setup: Wait for rejection near 41,800 with a breakdown below 41,119
TP1: 39,274
TP2: 37,484
SL: Above 41,900
Long Setup: Breakout retest above 41,800 with bullish momentum
TP1: 42,500
SL: Below 41,200
---
Let’s debate:
Is this a bull trap or the beginning of another rally?
Comment with your thoughts and setups!
#US30 #DowJones #Indices #TechnicalAnalysis #MacroTrading #SupplyDemand #LuxAlgo #StockMarket
US30 Technical Analysis – GTE VIP Sell AlertUS30 Technical Analysis – GTE VIP Sell Alert
Price has tapped into a strong resistance zone near 41,700, where previous rejections occurred. After a sharp bullish push, momentum appears to be slowing, and the market is overextended on the 1H chart. We expect a potential retracement toward the mid-range or support zone near 41,600–41,550. Stochastic is in the overbought area, signaling a possible reversal.

Trade Idea: US30 Short ( SELL STOP )Technical Analysis Overview:
1. Daily Chart:
• Price has retraced sharply into resistance (near 41,300–41,400), rejecting the 200-day EMA zone.
• MACD still negative but turning up—suggests potential for a failed bounce.
• RSI at 55.33—approaching overbought in a corrective move, ripe for reversal.
2. 15-Min Chart:
• Bearish divergence forming on RSI with lower highs.
• MACD is turning down with momentum fading after a recent high around 41,665.
• Price has broken short-term moving average support, with momentum shifting down.
3. 3-Min Chart:
• Clear bearish structure with lower highs and lower lows.
• MACD and RSI confirm short-term weakness.
• Price hovering near local support (around 41,302), if broken, would confirm further downside.
⸻
Fundamental Context (Macro):
• FOMC & NFP results (recent) suggest continued uncertainty in interest rate direction.
• US manufacturing and employment data have shown mixed signals—equities vulnerable to downside corrections amid macro volatility.
• Seasonally, May is often a pullback month (“Sell in May”).
⸻
TRADE IDEA – SHORT US30
• Entry: 41,295 (current price at resistance zone)
• Stop-Loss (SL): 41,670 (above recent intraday high and 15-min resistance)
• Take-Profit (TP): 40,500 (prior support zone on 15-min chart)
FUSIONMARKETS:US30

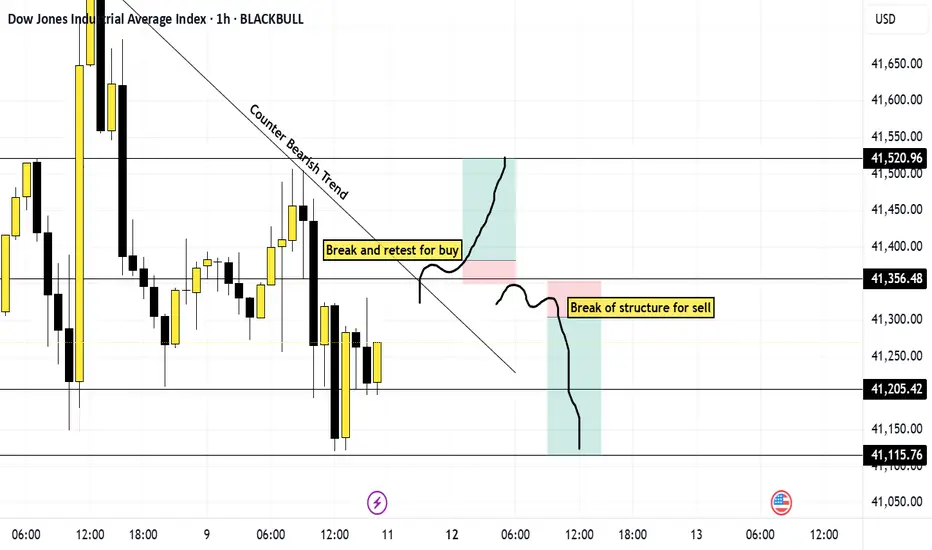
US30 Breakdown May 11thWhy don't skeletons fight each other? Cuz they ain't got guts, like you if you keep making excuses. Ok let's get to work.
Price has been steadily moving upwards this past month. Right now, there seems to be a counter bearish trend, so I plan to react to the market when it gets to my key level 41,353. If price breaks and retests that level on the 1 minute, and for extra confirmation the counter trendline, I will buy it to 41,500.
If price gets to that 41,353 level and decides to break structure and trend down, then I will sell it to 41,100 level.
But like my ex, price does whatever it wants, and it could buy earlier or sell earlier then I've predicted. So, when price gets around one of my key areas (any of the horizontal lines) and decides to start making higher highs and higher lows or breaks and retest it then I'll buy. And If price decides to start making lower highs and lower lows at my key area then I'll sell it.
Have Fun with trading. Keep smiling and I promise if you look at it with positivity you will always win
Testing Trumps Theory About StocksSo, as you can see, I just kept it simple, Trump made a claim about buying stocks because this country is about to take off like a rocket. I told my wife I will check the charts. It's been a long time but ugh I think we will see a drop towards resistance before we see what he's talking about. This is the monthly I looked at it on the 3 months chart as well same things keeps popping up some pain before profit so I will be looking to buy on our way down this is the DOW but I am for sure looking for similar patterns in other stocks. But the S&P 500 Is looking the same also.
LET ME KNOW YOUR THOUGHTS BELOW.
this is a small reminder that I am not a professional and this is not investing advice I am simply giving my opinion as a fellow student in the art of trading.

DOW JONES is targeting a NEW HIGH !The Dow Jones Industrial Average (DJI) recently showed a false breakout above its ascending price channel. After this, it tested a key support level—often called the 'golden zone.' This test suggests that the DJI is now set to swing toward a new high.

Dow Jones Correction in May 2025: Key DriversDow Jones Correction in May 2025: Key Drivers
Summary: The Dow Jones Industrial Average (DIA) is under pressure and likely headed for a correction due to the Federal Reserve’s tight monetary policy, trade uncertainty from Trump’s tariffs, and weak economic data.
Key Drivers:
➖ Federal Reserve Policy: At the May 6–7 meeting, the Fed is expected to maintain the 4.25–4.5% interest rate due to persistent inflation (2.7% forecast for 2025) and a robust labor market (+177K jobs in April). This dampens hopes for rate cuts, pressuring stocks.
➖ Trump’s Tariffs: New tariffs raise inflation risks and recession fears, reducing the appeal of Dow Jones constituents like Caterpillar and Walmart.
➖ Weak GDP and Global Volatility: A 0.3% GDP contraction in Q1 2025 and declines in Asian markets (1.6–1.8%) signal global instability.
➖ Technical Indicators: DIA trades below its 200-day moving average (~420 USD), with fewer stocks above this level (down from 76% to 55% since January), indicating market weakness.
➖ Outlook: Analysts (Long Forecast) predict volatility, with a potential drop to 38,958 in May, despite an average forecast of 43,370 by month-end. Historically, corrections occur every 1.88 years, and current conditions (tariffs, inflation, GDP) heighten the likelihood of a 10–15% decline.
Target: My downside target for the Dow Jones is 38,555.00.
Current factors and historical trends strongly suggest a near-term correction.
Idea for S&P 500:


DowJones INTRADAY important resistance retest Key Support and Resistance Levels
Resistance Level 1: 41,900
Resistance Level 2: 42,470
Resistance Level 3: 43,600
Support Level 1: 40,680
Support Level 2: 40,240
Support Level 3: 39,700
This communication is for informational purposes only and should not be viewed as any form of recommendation as to a particular course of action or as investment advice. It is not intended as an offer or solicitation for the purchase or sale of any financial instrument or as an official confirmation of any transaction. Opinions, estimates and assumptions expressed herein are made as of the date of this communication and are subject to change without notice. This communication has been prepared based upon information, including market prices, data and other information, believed to be reliable; however, Trade Nation does not warrant its completeness or accuracy. All market prices and market data contained in or attached to this communication are indicative and subject to change without notice.

Wedge at the Edge – Will the Dow Drop from Here?Price is approaching a key supply zone between 41,800 and 42,400, where previous strong selling occurred. A rising wedge pattern is forming, suggesting a potential bearish reversal. If price fails to break above the supply zone and closes below the wedge, a breakdown could lead to a bearish move targeting the demand zone around 39,000–39,300.
Bearish Bias: Watching for rejection and breakdown confirmation for a short setup.
Key Levels:
Supply zone: 41,800 – 42,400
Demand zone: 39,000 – 39,300
Support to watch: 40,600

correctionAs long as the index fluctuates above the support range, the continuation of the upward trend will be likely. Otherwise, the continuation of the correction trend to the specified support range will be possible.

US30 - LONGPrice continued making higher highs as expected with the help of trade talk agreements. I'm expecting price to continue to the upside throughout the London session into the NYSE open.

US30 SHORT SELL to Buy long term The US30 is currently on a bullish sugar rush, charging upward like it just chugged three Red Bulls. But hey, even bulls need bathroom breaks! So while it’s flexing its muscles, I’m sneaking in some quick sell scalps—because why not profit from its little caffeine crashes?
Once this over-caffeinated beast finally pauses to catch its breath (aka retraces), I’ll be waiting with open arms to buy the dip like it’s Black Friday and the US30 is on sale. Long-term buy? Yes, please—just gotta wait for that ‘premium discount’ level. Because in trading, as in life, patience (and a little bit of cheeky scalping) pays off!

