US30 - LONGExpecting price to continue this bullish momentum we've been having. Asian and London session created higher highs. Now that we've retraced I am expecting buyers to take control at market open and create another higher high.
US30 trade ideas
DowJones INTRADAY resistance retestKey Support and Resistance Levels
Resistance Level 1: 41,900
Resistance Level 2: 42,470
Resistance Level 3: 43,600
Support Level 1: 40,680
Support Level 2: 40,240
Support Level 3: 39,700
This communication is for informational purposes only and should not be viewed as any form of recommendation as to a particular course of action or as investment advice. It is not intended as an offer or solicitation for the purchase or sale of any financial instrument or as an official confirmation of any transaction. Opinions, estimates and assumptions expressed herein are made as of the date of this communication and are subject to change without notice. This communication has been prepared based upon information, including market prices, data and other information, believed to be reliable; however, Trade Nation does not warrant its completeness or accuracy. All market prices and market data contained in or attached to this communication are indicative and subject to change without notice.

the US30 may form a short-term SELL trendBased on the analysis, the US30 may form a short-term SELL trend. Based on this analysis, we can try to enter a Sell position TRADENATION:US30FU with a small risk margin.

US30 Pushing Into Resistance Again – 08/05/2025🧨 US30 Pushing Into Resistance Again – 08/05/2025 🧨
US30 is knocking on the resistance door again! 📈
After grinding up from 39,775 and defending the key 40,700–40,800 zone, price is now challenging the 41,300–41,400 area, which rejected price earlier this week.
Momentum is holding but slowing slightly — we’re stuck between strong support and a heavy ceiling 💥. EMAs still bullish, but risk of a fakeout is growing if we don’t break soon…
🔍 Updated Key Zones:
🔹 Resistance = 41,300 – 41,400
🔹 Support = 40,694 – 40,800
🔹 Last higher low = 39,775
🔹 EMA 20 + EMA 50 still trending up — short-term bullish bias ✅
🎯 Trade Scenarios to Watch:
🔺 Break + hold above 41,400 = potential expansion toward 41,800–42,000 zone
🔻 Fail to hold 40,700 → could trigger dump back toward 39,775
📉 Lose 39,775 = confirmed shift in structure → shorts into 38,800–39,200 🔥
🧠 Trader Mindset Reminder:
🟡 Don’t chase up here — wait for breakout confirmation or rejection
🟢 EMAs are still your friend → trend is your ally
❌ Avoid fakeouts — this zone has trapped before!

Bullish continuation?Dow Jones (US30) has bounced off the pivot and could rise to the 1st resistance which lines up with the 145% Fibonacci extension.
Pivot: 40,653.80
1st Support: 39,774.46
1st Resistance: 42,181.26
Risk Warning:
Trading Forex and CFDs carries a high level of risk to your capital and you should only trade with money you can afford to lose. Trading Forex and CFDs may not be suitable for all investors, so please ensure that you fully understand the risks involved and seek independent advice if necessary.
Disclaimer:
The above opinions given constitute general market commentary, and do not constitute the opinion or advice of IC Markets or any form of personal or investment advice.
Any opinions, news, research, analyses, prices, other information, or links to third-party sites contained on this website are provided on an "as-is" basis, are intended only to be informative, is not an advice nor a recommendation, nor research, or a record of our trading prices, or an offer of, or solicitation for a transaction in any financial instrument and thus should not be treated as such. The information provided does not involve any specific investment objectives, financial situation and needs of any specific person who may receive it. Please be aware, that past performance is not a reliable indicator of future performance and/or results. Past Performance or Forward-looking scenarios based upon the reasonable beliefs of the third-party provider are not a guarantee of future performance. Actual results may differ materially from those anticipated in forward-looking or past performance statements. IC Markets makes no representation or warranty and assumes no liability as to the accuracy or completeness of the information provided, nor any loss arising from any investment based on a recommendation, forecast or any information supplied by any third-party.

Trade Idea: US30 Long (BUY LIMIT)Technical Overview
Daily Chart (Macro View):
• Trend: Recent bounce from major support near ~37,600 after a sharp selloff.
• MACD: Still bearish but showing early signs of momentum reversal (histogram rising).
• RSI: Neutral (~53.8), coming up from oversold territory—indicative of potential recovery.
• Price: Holding above 41,000, a key psychological level and previous consolidation zone.
15-Minute Chart (Swing/Short-Term View):
• Price: Forming higher lows after a significant bounce.
• MACD: Nearing a bullish crossover.
• RSI: Moderately bullish at ~56.87.
3-Minute Chart (Entry Precision):
• Price: Recently broke above short-term moving average.
• MACD: Bullish with strong histogram momentum.
• RSI: Slightly overbought (~52.90), but not extreme.
⸻
Fundamental Context (as of May 2025):
• Market sentiment is cautiously bullish after Fed pause hints and solid tech earnings.
• Inflation pressures are easing slightly, supporting risk-on sentiment.
• Recent volatility due to rate expectations and macro data; however, markets are recovering from sharp selloffs.
⸻
Bias: Long Position
US30 shows a strong recovery setup with macro support, bullish lower-timeframe confirmation, and neutral-to-bullish momentum indicators.
Entry (Buy Limit):
40,960 – small retracement near the short-term EMA and previous breakout on the 3-min chart.
Stop Loss (SL):
40,700 – below the recent swing low and psychological round level.
Take Profit (TP):
41,560 – retest of minor resistance from earlier consolidation area, offering a solid risk-reward.
FUSIONMARKETS:US30

Us30 longThis is a very short term trade..
1 is a wave of fear
2 is a wave of panic
3 is a wave of stop outs, (I was stopped out too)
after wave3 buyers come in hot
I would advise entering after break and retest of the trendline. to recent high

DowJones INTRADAY awaits Fed Rate Decision Key Support and Resistance Levels
Resistance Level 1: 41,450
Resistance Level 2: 41,900
Resistance Level 3: 42,470
Support Level 1: 40,220
Support Level 2: 39,760
Support Level 3: 39,150
This communication is for informational purposes only and should not be viewed as any form of recommendation as to a particular course of action or as investment advice. It is not intended as an offer or solicitation for the purchase or sale of any financial instrument or as an official confirmation of any transaction. Opinions, estimates and assumptions expressed herein are made as of the date of this communication and are subject to change without notice. This communication has been prepared based upon information, including market prices, data and other information, believed to be reliable; however, Trade Nation does not warrant its completeness or accuracy. All market prices and market data contained in or attached to this communication are indicative and subject to change without notice.

DOW JONES Can this Channel Up hold after the Fed Rate Decision?Dow Jones (DJIA) has been trading within a Channel Up since the April 24 Low and yesterday's correction (technically its Bearish Leg) stopped on the 4H MA50 (blue trend-line). Having formed already a Golden Cross, as long as this 4H MA50 holds, it should technically fuel the pattern's new Bullish Leg.
The 'weakest' Bullish Leg within this Channel Up has been +3.58%, so we expect a minimum repeat of that, giving a Target at 42100 on the short-term. This falls perfectly at the bottom of the 5 week Resistance Zone.
If this Channel Up doesn't get invalidated after today's Fed Rate Decision, it will most likely push the price there.
-------------------------------------------------------------------------------
** Please LIKE 👍, FOLLOW ✅, SHARE 🙌 and COMMENT ✍ if you enjoy this idea! Also share your ideas and charts in the comments section below! This is best way to keep it relevant, support us, keep the content here free and allow the idea to reach as many people as possible. **
-------------------------------------------------------------------------------
💸💸💸💸💸💸
👇 👇 👇 👇 👇 👇

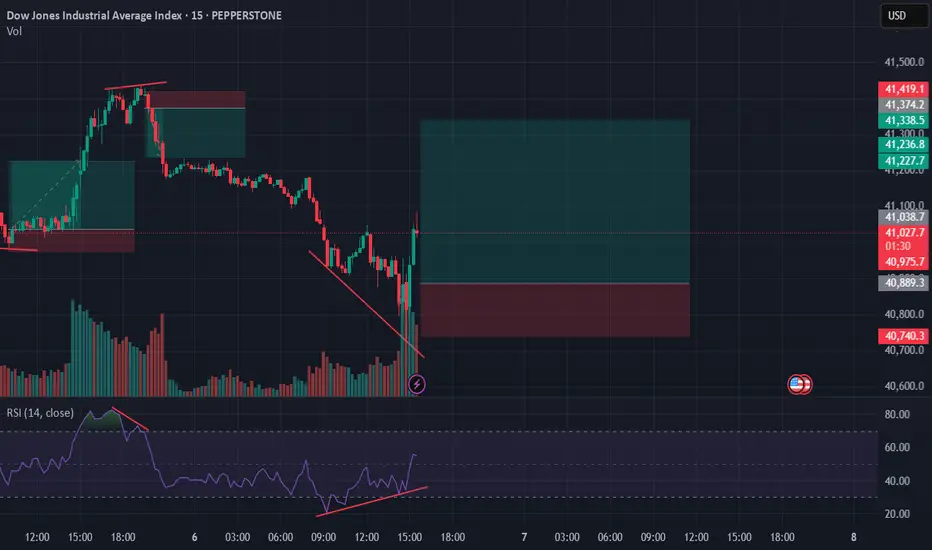
Hanzo : US30 15m : Breakouts Zones / Next Move is Confirmed 🆚 US30 – Hanzo’s Strike Setup
🔥 Timeframe: 15-Minute (15M)
——————
💯 Main Focus: Bullish After Break at 41150
We are watching this zone closely.
💯 Main Focus: Bearish After Break at 40950
We are watching this zone closely.
———
👌 Market Signs (15M TF):
• Liquidity Grab + CHoCH at 41300
• Liquidity Grab + CHoCH at 40990
• Strong Rejections seen at:
➗ 40950 – Major support / Key level x3 Retest
➗ 40690 – Major support / Key level x5 Retest
➗ 41150 – Proven resistance
Hanzo : NAS100 15m: Best Breakout Zones Confirmed After Liquidity Trap

DJI Lost over 73% in 16 years versus inflationFrom 1966 to 1982, holding on to U.S. stocks was a painful experience, especially once you factor in inflation.
But guess what thrived during that time?
Gold, silver, uranium, crude oil & friends.

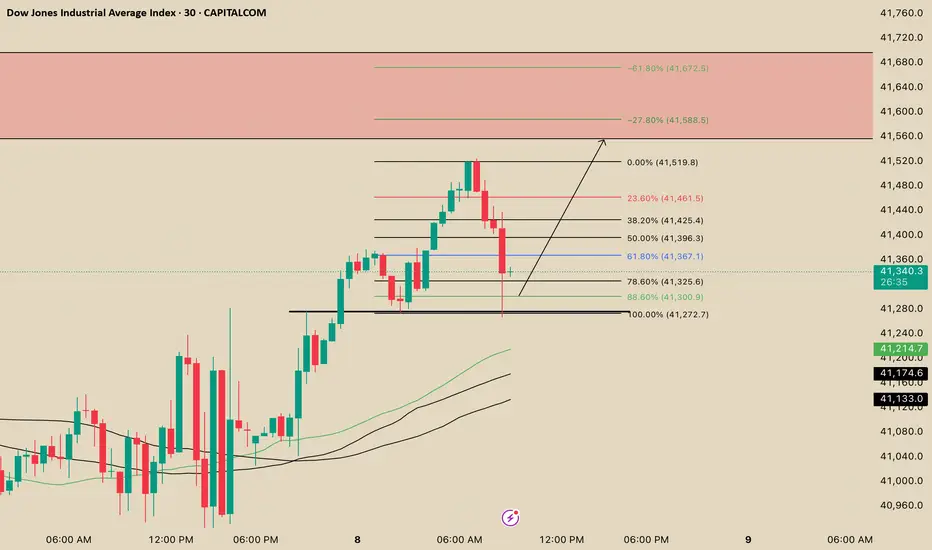
Risky Long Setup on Dow Jones Ahead of FOMC – Wait for ConfirmatPotential Risky Long Setup
If the price breaks and holds above 41,160, a risky long position could be considered. This path is illustrated with the blue line on the chart.
For a more reliable entry, we need to see the market retest the 41,392 level once more. If we get a third reaction from this level, we’ll wait for a clear trigger to go long. This potential setup is shown with the orange line on the chart.
📅 This analysis is conditional on FOMC news aligning with the overall trend of the market.
🧠 All scenarios reflect the thoughts of a risk-taking trader – remember, nothing is impossible in the market!
#DowJones #DJI #FOMC #TechnicalAnalysis #RiskyTrade #PriceAction #Forex #TradingView #MarketAnalysis #LongSetup #BreakoutTrade #DOW #US30

Dow Jones at Critical Levels!Dow Jones Technical Outlook:
Currently, the Dow Jones remains within a broader bearish structure 📉, trading near the lower boundary of its descending channel.
Nonetheless, the formation of higher highs and higher lows on the daily and 4H timeframes ⏰ suggests that a potential bullish reversal may be developing 🔄.
The 40,700 – 40,300 range is a key decision zone ⚡️:
• A confirmed breakout above this level could trigger a minor bullish rally 🚀.
• Conversely, a failure to hold above this area and the formation of new lower highs and lower lows would reinforce the ongoing bearish trend 📉.
Additionally, the recent bullish weekly and monthly closes 📅 support a bias toward further upside momentum.
In the initial phase, we may see a corrective move to the downside on lower timeframes to form a wick (shadow) for the monthly candle before any significant bullish continuation 🔄📈.
Stay flexible and monitor price action closely! 👀

DOW/US30 - we hope everyone make million last nightTeam, yesterday was a big win for all of us, twice the DOW/NAS massive win
today, the market will likely pull back toward the price set in the chart
make sure you have tight stop-loss
also, once it drops more than 50 points, bring stop loss to BE
we are looking at around 40930-40850
The interest rate decision within 12 hours time frame,
we expect the market will be volatile if it dumps toward our LONG entry position, which I set out in the chart.
Follow that, and you will kill the market with me
UNTIL then, I wish you all the best
US30 =Dow Jone (SHORT)
Resistance from Weekly time frame
Breakout of uptrend to the downside
Low low starting to form after the Double Top

DOW JONES BUY SETUP M30 market BOFYesterday market trap for buyer but main important thing was TODAY FOMC AFTER MARKET GONNA MORE FLY💸💯
MORE DETAILS DM

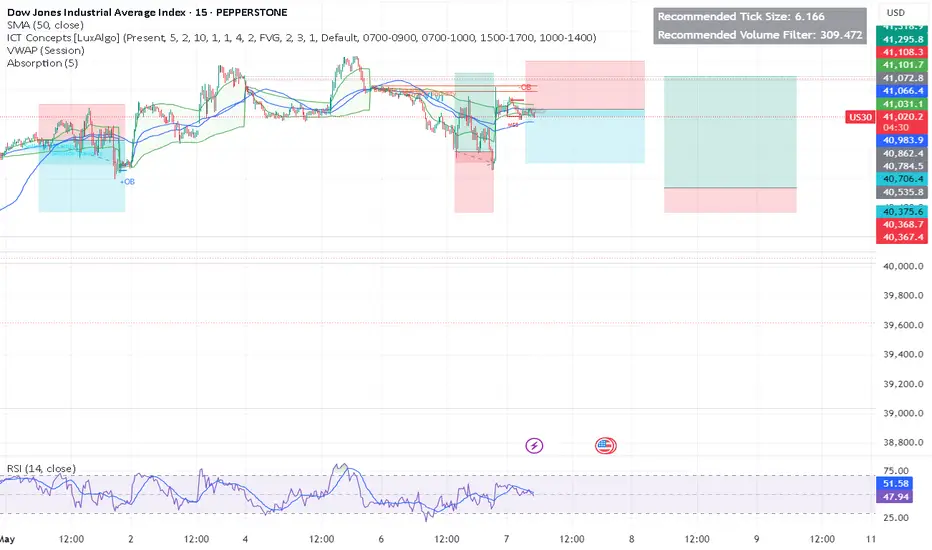
US30 Technical Analysis – GTE VIP Buy SetupUS30 Technical Analysis – GTE VIP Buy Setup
Price is respecting a strong ascending channel on the 1H timeframe, with multiple clean bounces off the trendline. Our GTE VIP entry was placed at the lower boundary of the channel, where price showed bullish rejection and confluence with previous support.
Stochastic also confirmed hidden bullish divergence, signaling continuation. Targets are aligned with the upper boundary of the channel and previous resistance zones at 41,230 and 41,319.
This is a classic trend continuation setup — riding momentum back toward liquidity at the highs.

Bullish momentum to extend?Dow Jones (US30) has bounced off the pivot which is an overlap support and could bounce to the 1st resistance that aligns with the 145% Fibonacci extension.
Pivot: 40,653.80
1st Support: 39,774.46
1st Resistance: 42,181.26
Risk Warning:
Trading Forex and CFDs carries a high level of risk to your capital and you should only trade with money you can afford to lose. Trading Forex and CFDs may not be suitable for all investors, so please ensure that you fully understand the risks involved and seek independent advice if necessary.
Disclaimer:
The above opinions given constitute general market commentary, and do not constitute the opinion or advice of IC Markets or any form of personal or investment advice.
Any opinions, news, research, analyses, prices, other information, or links to third-party sites contained on this website are provided on an "as-is" basis, are intended only to be informative, is not an advice nor a recommendation, nor research, or a record of our trading prices, or an offer of, or solicitation for a transaction in any financial instrument and thus should not be treated as such. The information provided does not involve any specific investment objectives, financial situation and needs of any specific person who may receive it. Please be aware, that past performance is not a reliable indicator of future performance and/or results. Past Performance or Forward-looking scenarios based upon the reasonable beliefs of the third-party provider are not a guarantee of future performance. Actual results may differ materially from those anticipated in forward-looking or past performance statements. IC Markets makes no representation or warranty and assumes no liability as to the accuracy or completeness of the information provided, nor any loss arising from any investment based on a recommendation, forecast or any information supplied by any third-party.

Tariff Tension = Dow Explosion? | US30 Setup You Can't MissTechnical + News-Driven Outlook
📌 What’s Happening?
The Dow Jones (US30) is sitting at a critical decision point — tightly consolidating while the market braces for potential tariff decisions from the U.S. government. With price stuck between key zones, the next move could be explosive. Here's what I'm watching:
🔍 Key Levels to Watch:
⚠️ Resistance/Imbalance Zone: 41,650 – 41,750
🧲 Liquidity Zone: 41,000 – 41,400 (range bound)
🧨 Downside Target if Broken: 40,200 → 39,750
🚀 Bullish Scenario:
If price breaks and closes above 41,400, expect a fast move toward 41,750, filling the imbalance. This setup could trigger especially if tariff news is positive (e.g., delay or reduction in trade penalties).
🛑 Bearish Breakdown:
Failure to hold 41,000 support and a strong bearish rejection could send us back toward 40,200. A hawkish trade policy update could accelerate this sell-off.
✅ Trade Idea Summary:
Buy Above 41,400, Target: 41,750
Sell Below 41,000, Target: 40,200 / 39,750
🔄 Wait for confirmation candles, avoid chasing!
💬 Follow me for real-time chart drops, high-probability setups, and news-backed analysis.
📊 Consistency | Discipline | Risk-First Thinking

Rejection at Supply Zone – Bearish Targets Loaded!Price has been rejected at the key supply zone near 41,119, with a sharp drop confirming bearish momentum.
We’re now trading below 40,736, heading toward the first demand zone around 39,884. If that breaks, the next high-volume support area is 38,397, as shown by the visible range and demand zone.
Bearish Bias
Strong rejection from supply
Lower highs forming
Watching for breakdown below 39,884 to add more short positions
Upcoming Events:
Big US data + FOMC sentiment could accelerate the move. Stay sharp!
What’s your bias – Short or Buy the Dip? Drop your thoughts below!
#US30 #DowJones #SupplyAndDemand #PriceAction #TradingView #SmartMoney #BearishSetup

$DJI & $NDX at MAJOR RESISTANCEDaily
The TVC:DJI has done well since April & we noticed a sentiment change. This is why we turned bullish. Only problem? Lack of volume. We can see that volume stayed under the pink dots. This is an average of 90 days.
We can also see this by the Money Flow. As of now the lowest peak since mid March on this indicator.
---
Weekly
The TVC:DJI RSI hasn't broken the halfway point. This is needed for more bullish momentum.
Money flow is slanting lower. The interesting tid bit is that volume for the week is not bad at all. But compare this to Jan 2024 and 4th quarter of the same year... LOWER.
Posted this yesterday, see profile for more info.

Are we staging a recover today ? Looks like the big boys are eager to buy at this level. Lets wait and see if we get a second chance to get in.
Trade Idea: Long (MARKET)Technical Confluence:
Daily Chart:
• Strong bullish engulfing recovery from recent support (~37,700).
• MACD starting to curl back up from deeply negative levels — possible trend reversal.
• RSI recovering above 50 (currently 52.49), suggesting bullish strength resuming.
15-Min Chart:
• Sustained uptrend with pullbacks respecting the moving average.
• MACD crossing positive territory.
• RSI at 64.77 with room to move higher before hitting overbought levels.
3-Min Chart:
• Tight consolidation after a sharp breakout to 40,766 — forming a potential bull flag.
• RSI at 58.89 — mid-level with upward momentum potential.
• MACD histogram shrinking — possible continuation breakout imminent.
⸻
Fundamental Context:
• Market Sentiment: U.S. markets are generally supported due to strong earnings reports and decreasing recession fears. Treasury yields have stabilized, and risk appetite is returning.
• Upcoming Events: FOMC rate decision is key — bullish bias if they hold or soften tone.
⸻
Trade Details:
• Entry: 40,770
• Price is consolidating just under this resistance. Enter on breakout with volume confirmation.
• Stop Loss (SL): 40,350
• Below recent support on the 15M chart and under the moving average. Conservative SL with volatility in mind.
• Take Profit (TP): 41,450
• Measured move from the flag pattern and aligns with Fibonacci extension and historical resistance.
FUSIONMARKETS:US30
