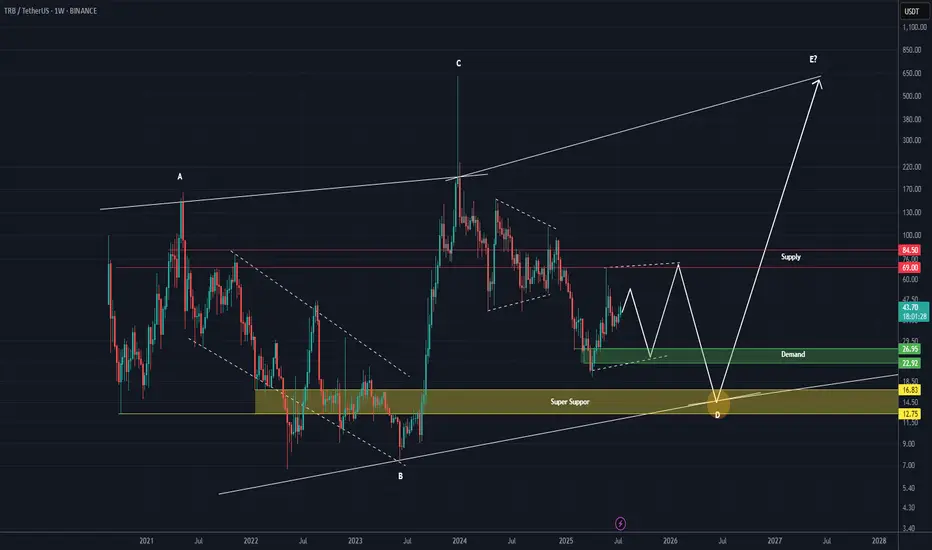
TRB Roadmap (1W)It appears to be within wave D of a larger pattern.
Given the strong rally in wave C, it is expected that this coin will enter a time-consuming correction, so considering a symmetrical pattern for wave D is not illogical.
A short-term upward swing is expected from the green zone.
However, the main buy zone is the yellow box, where wave D could end and wave E may begin.
These moves and this pattern belong to the weekly timeframe and will take time to play out. For a spot buy, it’s best to keep this asset on your watchlist.
For risk management, please don't forget stop loss and capital management
Comment if you have any questions
Thank You
TRBUSDT trade ideas
TRB : FREE SIGNALHello friends🙌
📈Given the price reaching its bottom and the buyers supporting it, you can see that a classic head and shoulders pattern has formed and buyers have entered. For this reason, you can buy with capital and risk management and move with it to the specified targets.
🔥Follow us for more signals🔥
*Trade safely with us*

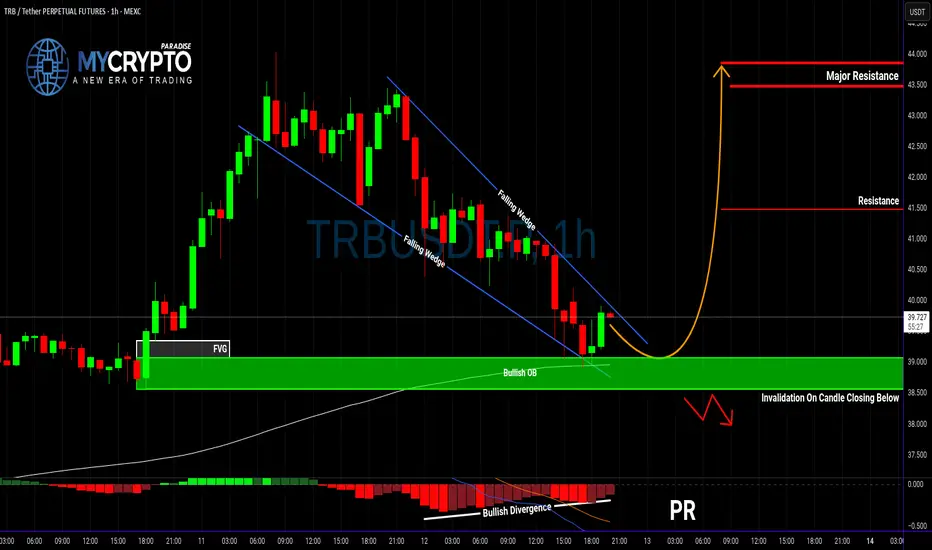
TRBUSDT: Massive Bullish Setup or a Fakeout Trap?Yello Paradisers — is TRBUSDT gearing up for a major breakout, or is this just another fakeout before a deeper drop? Our previous calls have been consistently accurate, and now this chart is flashing multiple signals that deserve your full attention.
💎Currently, TRBUSDT has formed a textbook falling wedge pattern, a well-known bullish reversal signal. What's adding strength to this setup is a clear bullish divergence, suggesting that momentum may be shifting in favor of the bulls. Even more compelling, the price is now holding firmly inside a bullish Order Block (OB) zone, which is aligned with the 200 EMA — a powerful confluence that increases the probability of a bullish move significantly.
💎For aggressive traders, this could be a valid spot to enter immediately, capitalizing on the current structure and zone. However, for those looking for a more calculated entry with improved risk-to-reward, waiting for a pullback could provide a much better setup — with the potential to offer over 4.5 RR, making it a high-probability trade idea.
💎That said, it’s important to manage risk carefully. If TRBUSDT breaks down and closes candle below the bullish OB zone, this would invalidate the bullish setup entirely. In that case, the smart move would be to wait patiently for new price action to form before making any decisions. Reacting emotionally here could lead to unnecessary losses, so discipline is key.
🎖Strive for consistency, not quick profits. Treat the market as a businessman, not as a gambler. If you want to be consistently profitable, you need to be extremely patient and always wait only for the best, highest probability trading opportunities.
MyCryptoParadise
iFeel the success🌴
TRBUSDT - at CUT n REVERSE Area? What's next??#TRBUSDT - market just reached at his ultimate supporting region and below that we can expect a further straight drop.
So we will cut n reverse below our mentioned region that is around 35 (region neck line)
Good luck
trade wisely

Today's signalHello friends🙌
🔊After the good growth of this currency, you can see that the price has corrected at the top of the channel and now that we are near the bottom of the channel, there is a good opportunity to buy in stages and with capital and risk management and move with it to the specified goals.
🔥Join us for more signals🔥
*Trade safely with us*

TRBUSDT Setup – Staggered Exits, Smart Profits📌 Entry: 36.70
🎯 TP1: +10% → Secure 50% of position
🛡️ Move to risk-free after TP1 to protect capital
🎯 TP2: Take 50% of remaining volume
🎯 TP3: Close all remaining volume
Calculated exits. Risk-managed. Momentum-ready.

TRBUSDT Setup – Staggered Exits, Smart Profits📌 Entry: 36.70
🎯 TP1: +10% → Secure 50% of position
🛡️ Move to risk-free after TP1 to protect capital
🎯 TP2: Take 50% of remaining volume
🎯 TP3: Close all remaining volume
Calculated exits. Risk-managed. Momentum-ready.

TRBUSDT Long with good RRTRBUSDT with bullish pivots, follows with divergence on smaller time frames, possible reversal with FakeBO, a good Risk Reward. First 85 daily target on fibonacci levels.

TRBUSDT on the Verge of a Major Move – Breakout or Breakdown?Yello, Paradisers! Is TRBUSDT gearing up for a bullish breakout, or is a deeper retracement coming? Let’s break it down.
💎TRBUSDT is forming an ending diagonal while showing bullish divergence, increasing the probability of an upward move. But for this bullish scenario to play out, we need confirmation.
💎If TRBUSDT breaks out and closes candle above the resistance level, the probability of a bullish move strengthens, setting up a potential wave 4.
💎However, if the price retraces further, we could still see a bounce, but given the broader market conditions, this would be a low-probability setup.
💎On the flip side, a breakdown and candle close below support would invalidate the bullish outlook, signaling that it’s safer to wait for a better price action structure before taking any positions.
🎖Remember, patience and disciplined execution are what separate winners from the rest. Stay sharp, Paradisers, and don’t let emotions dictate your trades!
MyCryptoParadise
iFeel the success🌴

TRBUSDT / LONG / 10.06.25⬆️ Buy TRBUSDT, 10.06.25
💰 Entry: 47.52
🎯 Target: 140.12
⛔️ Stop: 39.12
Reasons for entry:
— 1D
Price in consolidation for more than 1 day
Correction to the discount zone
— 1H
Divergence in long, exit from correction
Decrease in volumes during correction
Predominance of volumes for purchase
— 15m
Breakdown of structure with correction to the discount zone
Strategy: medium-term, breakout

TRBUSDT - Bottom out here? What's next??#TRBUSDT ... market just near to his bottom and looking bottom out here
Keep close and if market holds his current mentioned area than we can expect a bounce from here.
Good luck
Trade wisely

TRB/USDTKey Level Zone: 47.250 - 47.700
The setup looks promising—price previously trended upward with rising volume and momentum, then retested this zone cleanly. This presents an excellent reward-to-risk opportunity if momentum continues to align.
Introducing LMT (Levels & Momentum Trading)
- Over the past 3 years, I’ve refined my approach to focus more sharply on the single most important element in any trade: the KEY LEVEL.
- While HMT (High Momentum Trading) served me well—combining trend, momentum, volume, and structure across multiple timeframes—I realized that consistently identifying and respecting these critical price zones is what truly separates good trades from great ones.
- That insight led to the evolution of HMT into LMT – Levels & Momentum Trading.
Why the Change? (From HMT to LMT)
Switching from High Momentum Trading (HMT) to Levels & Momentum Trading (LMT) improves precision, risk control, and confidence by:
- Clearer Entries & Stops: Defined key levels make it easier to plan entries, stop-losses, and position sizing—no more guesswork.
- Better Signal Quality: Momentum is now always checked against a support or resistance zone—if it aligns, it's a stronger setup.
- Improved Reward-to-Risk: All trades are anchored to key levels, making it easier to calculate and manage risk effectively.
- Stronger Confidence: With clear invalidation points beyond key levels, it's easier to trust the plan and stay disciplined—even in tough markets.
Whenever I share a signal, it’s because:
- A high‐probability key level has been identified on a higher timeframe.
- Lower‐timeframe momentum, market structure and volume suggest continuation or reversal is imminent.
- The reward‐to‐risk (based on that key level) meets my criteria for a disciplined entry.
***Please note that conducting a comprehensive analysis on a single timeframe chart can be quite challenging and sometimes confusing. I appreciate your understanding of the effort involved.
Important Note: The Role of Key Levels
- Holding a key level zone: If price respects the key level zone, momentum often carries the trend in the expected direction. That’s when we look to enter, with stop-loss placed just beyond the zone with some buffer.
- Breaking a key level zone: A definitive break signals a potential stop‐out for trend traders. For reversal traders, it’s a cue to consider switching direction—price often retests broken zones as new support or resistance.
My Trading Rules (Unchanged)
Risk Management
- Maximum risk per trade: 2.5%
- Leverage: 5x
Exit Strategy / Profit Taking
- Sell at least 70% on the 3rd wave up (LTF Wave 5).
- Typically sell 50% during a high‐volume spike.
- Move stop‐loss to breakeven once the trade achieves a 1.5:1 R:R.
- Exit at breakeven if momentum fades or divergence appears.
The market is highly dynamic and constantly changing. LMT signals and target profit (TP) levels are based on the current price and movement, but market conditions can shift instantly, so it is crucial to remain adaptable and follow the market's movement.
If you find this signal/analysis meaningful, kindly like and share it.
Thank you for your support~
Sharing this with love!
From HMT to LMT: A Brief Version History
HM Signal :
Date: 17/08/2023
- Early concept identifying high momentum pullbacks within strong uptrends
- Triggered after a prior wave up with rising volume and momentum
- Focused on healthy retracements into support for optimal reward-to-risk setups
HMT v1.0:
Date: 18/10/2024
- Initial release of the High Momentum Trading framework
- Combined multi-timeframe trend, volume, and momentum analysis.
- Focused on identifying strong trending moves high momentum
HMT v2.0:
Date: 17/12/2024
- Major update to the Momentum indicator
- Reduced false signals from inaccurate momentum detection
- New screener with improved accuracy and fewer signals
HMT v3.0:
Date: 23/12/2024
- Added liquidity factor to enhance trend continuation
- Improved potential for momentum-based plays
- Increased winning probability by reducing entries during peaks
HMT v3.1:
Date: 31/12/2024
- Enhanced entry confirmation for improved reward-to-risk ratios
HMT v4.0:
Date: 05/01/2025
- Incorporated buying and selling pressure in lower timeframes to enhance the probability of trending moves while optimizing entry timing and scaling
HMT v4.1:
Date: 06/01/2025
- Enhanced take-profit (TP) target by incorporating market structure analysis
HMT v5 :
Date: 23/01/2025
- Refined wave analysis for trending conditions
- Incorporated lower timeframe (LTF) momentum to strengthen trend reliability
- Re-aligned and re-balanced entry conditions for improved accuracy
HMT v6 :
Date : 15/02/2025
- Integrated strong accumulation activity into in-depth wave analysis
HMT v7 :
Date : 20/03/2025
- Refined wave analysis along with accumulation and market sentiment
HMT v8 :
Date : 16/04/2025
- Fully restructured strategy logic
HMT v8.1 :
Date : 18/04/2025
- Refined Take Profit (TP) logic to be more conservative for improved win consistency
LMT v1.0 :
Date : 06/06/2025
- Rebranded to emphasize key levels + momentum as the core framework


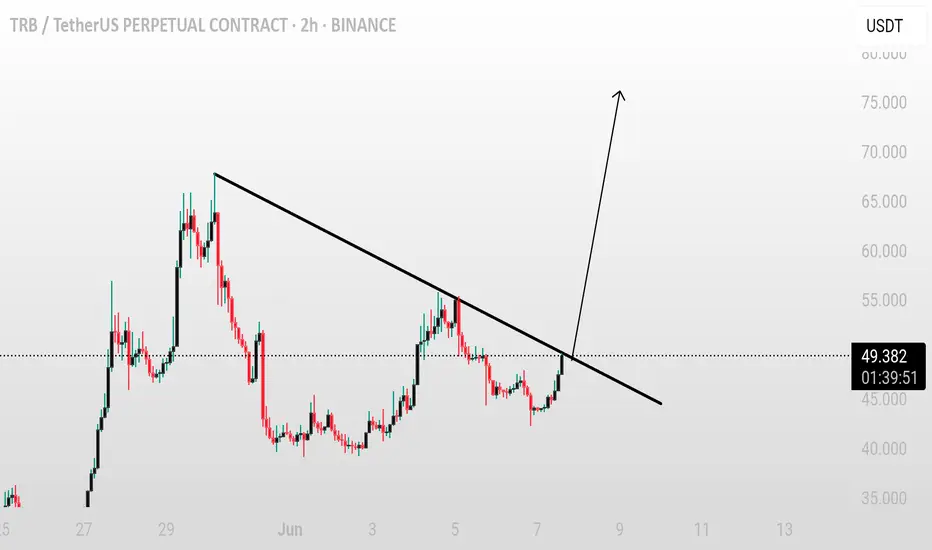
TRB/USDT – Attempting Trendline BreakoutTRB/USDT – Attempting Trendline Breakout
TRB is currently testing a key trendline resistance and attempting a breakout. If the price manages to break and hold above the trendline with strength, it could trigger a bullish move.
A confirmed breakout may lead to a 15–30% bounce in the short term.
Key levels to monitor:
– Trendline resistance
– Breakout confirmation with volume
– Immediate resistance zones above
Keep an eye on TRB — confirmation above the trendline could open the door for a strong upside move.
TRBUSDT weekly lookPrice is moving forward into a channel and is expected to touch higher band in few weeks

TRB/USDT Analysis – Short Setup
We previously considered a short setup on this asset, and the trade performed well.
After reaching key resistance levels, the coin showed strong selling activity.
We’re now looking for another short opportunity on a retest of the high-volume anomaly zone at $51–$53 — provided there's a reaction within that zone.
Our target remains the same: the POC of the previous consolidation at $42.
This publication is not financial advice.

Technical Analysis: TRB/USDT – 1D Timeframe📌 Technical Analysis: TRB/USDT – 1D Timeframe
🟢 Reversal Pattern: Inverse Head and Shoulders
A classic Inverse Head and Shoulders pattern is clearly visible on the chart, which typically signals the end of a downtrend and the beginning of a strong upward movement.
Head: Formed near the strong support level at 19.47 USDT.
Left and Right Shoulders: Built on both sides of the head, bouncing off the 24.47 USDT support area.
Neckline: Located at the resistance zone around 34 USDT.
A confirmed breakout above the 34 USDT neckline, followed by solid price action above this level, could lead to a significant bullish rally.
🎯 Potential Targets
🎯 First Target after breaking 34 USDT resistance:
Price level: around 48.95 USDT
Gain: +14.95 USDT, approximately +78.19%
🎯 Second Target if uptrend continues:
Price level: around 60 USDT, a major daily resistance
Gain: +27.01 USDT, approximately +78% from current price
🛑 Key Support Levels
🟩 Strong Daily Support: 19.47 USDT (dark green)
🟩 Intermediate Support: 24.47 USDT (medium green) – if a correction occurs, this zone may trigger a bullish reaction.
⚠️ Bearish Scenario
If the price fails to break above 34 USDT and gets rejected, a correction down to 24.47 USDT (around −14%) is likely. This could act as a right shoulder retest, potentially offering a good entry point.
🧠 Summary
The "Inverse Head and Shoulders" pattern, supported by strong horizontal support levels, suggests the possibility of a medium-term bullish trend. However, confirmation depends on breaking and holding above the 34 USDT resistance.
First target is around 48.95 USDT, and the second major target lies at 60 USDT.

TRB/USDTKey Level Zone: 43.500 - 43.900
HMT v8.1 detected. The setup looks promising, supported by a previous upward/downward trend with increasing volume and momentum, presenting an excellent reward-to-risk opportunity.
HMT (High Momentum Trending):
HMT is based on trend, momentum, volume, and market structure across multiple timeframes. It highlights setups with strong potential for upward movement and higher rewards.
Whenever I spot a signal for my own trading, I’ll share it. Please note that conducting a comprehensive analysis on a single timeframe chart can be quite challenging and sometimes confusing. I appreciate your understanding of the effort involved.
Important Note :
Role of Key Levels:
- These zones are critical for analyzing price trends. If the key level zone holds, the price may continue trending in the expected direction. However, momentum may increase or decrease based on subsequent patterns.
- Breakouts: If the key level zone breaks, it signals a stop-out. For reversal traders, this presents an opportunity to consider switching direction, as the price often retests these zones, which may act as strong support-turned-resistance (or vice versa).
My Trading Rules
Risk Management
- Maximum risk per trade: 2.5%.
- Leverage: 5x.
Exit Strategy
Profit-Taking:
- Sell at least 70% on the 3rd wave up (LTF Wave 5).
- Typically, sell 50% during a high-volume spike.
- Adjust stop-loss to breakeven once the trade achieves a 1.5:1 reward-to-risk ratio.
- If the market shows signs of losing momentum or divergence, ill will exit at breakeven.
The market is highly dynamic and constantly changing. HMT signals and target profit (TP) levels are based on the current price and movement, but market conditions can shift instantly, so it is crucial to remain adaptable and follow the market's movement.
If you find this signal/analysis meaningful, kindly like and share it.
Thank you for your support~
Sharing this with love!
HMT v2.0:
- Major update to the Momentum indicator
- Reduced false signals from inaccurate momentum detection
- New screener with improved accuracy and fewer signals
HMT v3.0:
- Added liquidity factor to enhance trend continuation
- Improved potential for momentum-based plays
- Increased winning probability by reducing entries during peaks
HMT v3.1:
- Enhanced entry confirmation for improved reward-to-risk ratios
HMT v4.0:
- Incorporated buying and selling pressure in lower timeframes to enhance the probability of trending moves while optimizing entry timing and scaling
HMT v4.1:
- Enhanced take-profit (TP) target by incorporating market structure analysis
HMT v5 :
Date: 23/01/2025
- Refined wave analysis for trending conditions
- Incorporated lower timeframe (LTF) momentum to strengthen trend reliability
- Re-aligned and re-balanced entry conditions for improved accuracy
HMT v6 :
Date : 15/02/2025
- Integrated strong accumulation activity into in-depth wave analysis
HMT v7 :
Date : 20/03/2025
- Refined wave analysis along with accumulation and market sentiment
HMT v8 :
Date : 16/04/2025
- Fully restructured strategy logic
HMT v8.1 :
Date : 18/04/2025
- Refined Take Profit (TP) logic to be more conservative for improved win consistency

TRB/USDT Analysis: Potential Reversal Setup
After a prolonged correction, this asset has entered an accumulation phase. The internal structure of the range indicates buyer dominance. This is evidenced by strong absorption of market sells (as shown by cumulative delta) and volume distribution.
We're considering a long entry either on a test of the POC-$42 (Point of Control — area of highest volume concentration), or on a false breakout below the $39 low.
Upside potential: $50
This publication is not financial advice.

TRBUSDT Forming classical Bullish BreakoutTRBUSDT has recently broken out of a long accumulation zone, forming a classic bullish breakout structure on the daily chart. The asset saw a significant surge from the key support zone between $28 to $32, which has now been confirmed as a strong demand area. The breakout was backed by a sharp spike in volume, indicating strong buyer conviction and institutional interest entering the market. This breakout marks a pivotal shift in momentum and suggests that the bulls are in full control.
The technical setup points to a potential rally of 100% to 130%, targeting levels around the $75 mark and beyond. The previous resistance zones have been decisively cleared, and the strong green candles hint at the possibility of a sustained uptrend. If the asset holds above the breakout level and continues to consolidate at higher levels, it could build a strong base for the next impulsive move. This kind of vertical price action is often seen in assets with growing investor demand and limited supply pressure.
Investor interest in TRB is noticeably rising, as reflected in the increased social media chatter, positive sentiment across crypto forums, and higher engagement on trading platforms. The coin is benefiting from renewed market confidence and strong fundamentals. With macro tailwinds in the crypto market and a technically sound chart, TRB appears poised to outperform in the coming weeks.
Traders should closely monitor the price action around $50–$52 for potential retest opportunities. A successful retest followed by bullish continuation could offer a high-risk/reward long setup. The projected upside remains highly favorable, supported by robust volume and clean technical structure.
✅ Show your support by hitting the like button and
✅ Leaving a comment below! (What is You opinion about this Coin)
Your feedback and engagement keep me inspired to share more insightful market analysis with you!

TRBUSDTREEntry Refinement (15min / 5min TF)
Wait for Pullback: Look for price to pull back to the $53.00 – $55.00 zone.
Confirmation:
Bullish Candlestick Patterns: Hammer, Engulfing, etc.
Break of Structure (BOS): Price breaking above a recent lower high.
Fair Value Gap (FVG): Identify gaps that price might fill

trb usdt resultParameter Value Notes
Entry Zone $51.00–$51.20 Within 5min OB and FVG
Stop Loss $50.70 Below the recent swing low
Take Profit 1 $53.30 Previous high / internal liquidity
Take Profit 2 $57.00 Daily resistance / external liquidity
Take Profit 3 $60.00 Psychological level / extension target
Risk-Reward Ratio 1:2 to 1:6 Depending on TP levels

trbusdt sniper entry📌 Notes:
Wait for confirmation, don’t buy blind at $51.20 – dapat merong bullish break sa micro structure.
You can enter via limit order sa OB, or market execution after BOS + retest.
Add confluence with MACD crossover or bullish divergence for extra confirmation.
