TRB/USDT 1DAY UPDATE AND 4HOUR UPDATE BY CRYPTOSANDERS !!Hello friends, welcome to this BITCOIN update from Crypto Sanders.
Chart Analysis:- 1-day update TRB USDT is bouncing back from fib retracement label 0.5 by breaking out in a triangle pattern and entry-level would be good to take around 0.382 which has a very small stop loss and for long-term TRP USDT will be right.
4 Hour You can see in the chat that the TRB/USDT up trend is going up trend and its support label is 100 MA and the entry level is around $120. Stop loss will be small and it is trading for a long time. Make sure to set end-stop loss.
This is not a piece of financial advice.
I have tried to bring the best possible results in this chart.
If you like it, hit the like button and share your charts in the comments section.
Thank you.
TRBUSDT trade ideas

TRB - Stronger Than Ever 💪Hello TradingView Family / Fellow Traders,
↗️ After breaking above the 100.0 round number and support zone, TRB has been bullish trading inside the rising channel in red.
📈 According to my trading plan, as TRB approaches the lower red trendline, I will be looking for bullish reversal setups on lower timeframes to catch the next bullish impulse.
🎯 As the next bullish impulse begins, we will be targeting the 140.0 supply zone marked in gray.
📚 Always follow your trading plan regarding entry, risk management, and trade management.
Good luck!
All Strategies Are Good; If Managed Properly!
~Richard Nasr

Trb : I am bullish Trb/usdt
Trb looks very strong,
Looking at the 24h trading volume, we can see that most people shorted it and the price still increased. There will be a strong rising wave soon
Not Financial advice

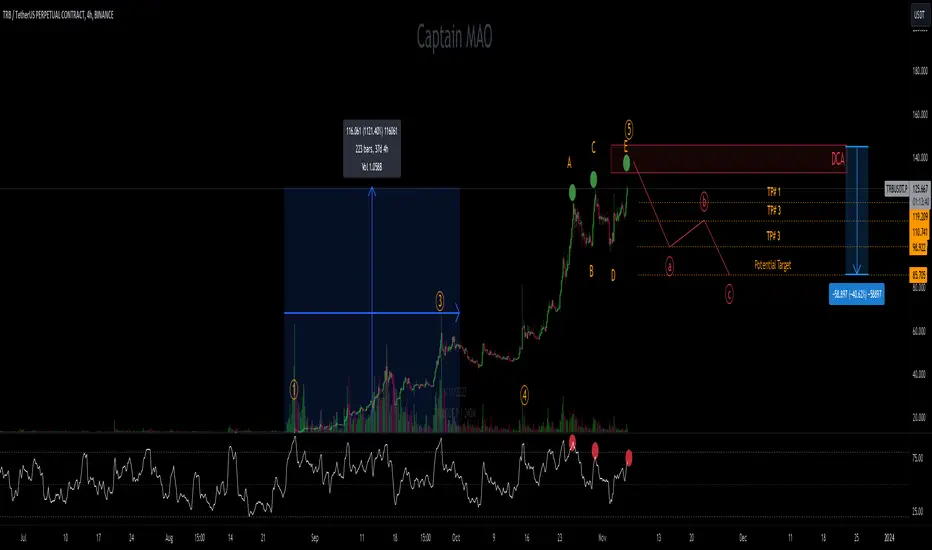
Trb Elliot 🌊 🏄♂️I have been analyzing Elliott Wave patterns and ABC correction phases. We have successfully completed Wave 4 and the ABC correction, transitioning from Wave 3 to 4.
Surf the wave up guys🏄♂️🏄♂️🏄♂️
Red line is support and resistance

TRB could rise and make ATHIn my analysis of CRYPTOCAP:TOTAL2 , I wrote that I am optimistic about the potential for further growth in altcoins. One particular altcoin that has captured my attention is TRB.
Upon examining the chart, a notable trend emerges. Following precisely one year of consolidation and accumulation within the 10 to 20 range, TRB experienced a remarkable surge, catapulting its value by over 10 times in a mere two months.
The recent correction, subsequent to reaching a peak of 144, appears to have concluded at present, indicating that the coin is poised for a new upward trajectory. This pivotal moment presents an opportune time for strategic investment.
Observing the current market conditions, it is advisable to consider purchasing during dips around the 100 mark.
As the title suggests, I am anticipating a swift ascent to a new all-time high in the near future.
In summary, the analysis of CRYPTOCAP:TOTAL2 underscores the potential growth in altcoins, with TRB standing out as a promising candidate. The historical performance, coupled with the recent correction and its subsequent stabilization, sets the stage for a compelling investment opportunity.
Strategically capitalizing on dips around 100 positions investors well for potential gains, aligning with my expectation of a forthcoming ATH for TRB.

TRB is going to DROP HEAVILY... pls be careful!!!!Attention: please dont FOMO. TRB is extremly overvalued and overbought.
There are 2 scenarios, either it goes down from current level which is around 122/110. Or it continue until 135/155 dollar. Either way, it will DROP HEAVILY and very strong.
Expect a drop of MININUM 50%. This uptrend can NEVER SUSTAIN without heavy CORRECTION. according IntoTheBlock data, 95% of HOLDERS are making money now because of TRB, 0% are in loss.
when you see this data, you know TRB is about to DROP MASSIVELY and shake up everyone.
BINANCE:TRBUSDT COINBASE:TRBUSD BINANCE:TRBUSDT.P KUCOIN:TRBUSDT

Trb looking strong and bullish to me After failing to fall below $87 when other coins fell on Monday morning, Trb seems to be building momentum for a upward move to $140 plus

TRBUSDT is BearishTRB was in an uptrend from past couple of days, however the bearish divergence coupled with double top formation signals a potential reversal. Targets are mentioned on the chart.

✴️ Tellor Short | The Chart Says Sell Now After 1,854% GrowthThis is an incredible trading pair, TRBUSDT or Tellor.
➖ After hitting a low 10-June, this pair went ahead and produced a massive, amazing, crazy, astonishing bullish wave ending in 1,854% growth . The entire process lasted 152 days or more than 5 months.
➖ After a strong bullish wave, a correction develops and this is normal and expected and that's exactly what the chart is saying will happen next.
I don't know how far down it will go... But all I can say is that correcitions are normal and at this point even expected, welcome and healthy, so do what you have to do to adapt and adjust.
This is not financial advice.
Market conditions can always change.
Do your own research before taking any action and build a plan for higher success if you decide to trade.
Thank you for reading and see you on the next one.
Namaste.

#TRB 60 USD Again. But First 22% PUMP#TRB 60 USD Again. But First 22% PUMP..TRB will go upside to 112 $ Then After Taking stoploss earlier seller it,ll go down for earlier buyer . TRB 66 USD SOON

TRBUSDT... Long/Short ...A simple chart with few limited idea of mine that i know...
Just have good look onto b4 take a long / short...
sharing just my thoughtz as a have a look onto...
ThankYou
NAFA n DYOR

TRB playout TRB currently trading 88$ before going further down taking liquidity and stop order area as well retesting 3 month broken trendline from last rally , waiting for another 30-40% correction at this level . trade will be invalidate if price manage to break the resistance line with nice volume so far not much volume to push price break the trend line

TRBUSDTTRBUSDT
Daily and 4-hour time frame
With the start of the upward trend of Bitcoin and Ethereum, this currency also started to grow
Entry area 1
28.315
Stop 24.990
Entry area 2
21.297
Stop 15,595
Tellor is hosted on the Ethereum network and represents the Oracle network that feeds off-chain data to Ethereum-based smart contracts. In fact, the project acts as an intermediary between smart contracts on Ethereum (by connecting them to off-chain data) and creating trusted feeds for users on the network. This use of oracles and decentralization by Tellor eliminates its need for third parties.
To provide reliable and secure information, Tellor relies on a network of interconnected miners who work on solving problems, i.e. mathematical equations, to verify and validate information feeds for the requested data types. Miners provide accurate solutions to queries and receive rewards in return; Of course, if the slightest mistake in the correctness of the information appears, they will lose their shared tokens.
On the other hand, the underlying protocol of this mechanism is Proof of Work (PoW) consensus. In this way, Tellor prevents the potential manipulation of data whose source is off-chain. Also, data feeds are updated every 5 minutes by Tellor smart contracts. All these things together have been able to create a safe platform for crypto users

#TRB/USDT - Long - Potential 28.72%Strategy: Long
Exchange: BINANCE
Account: Spot
Entry mode: Market order in range
Invest: 2.5%
Exit:
Target 2 : 118.37 27.2%
Target 1 : 98.96 6.34%
• Entry: 93.06 ⌁ 93.06
Current market price: 93.08
• Stop: 89.59 (-3.73%)
Technical indicators:
Very nice trendline break with volume spiking. Bullish RSI ready not yet overbought as price recovers from a severe steep sell off in early November. This was the results of a twitter hack / phishing scam that has artificially dropped price. We're trying here to catch price reverting to its mean but feel free to skip if that kind of crypto scam vulnerability gives this play too much risk for you!
Employ a trailing stop triggered by TP1 to insulate against further volatility / twitter scams!
• ⎿ 24h Volume: 28008931.5495
• ⎿ Satoshis: 93.06
• ⎿ Analysis: TradingView

Buying strategy - buy on pull backSome may present a second opportunity to buy if you miss the break out above EMA200. Anyway, not hurt to enter a small amount and keep in the watch list to buy on pull back to EMA200.

TRB Don't Miss Out! Grab the Bull by the Horns and Invest Smartl**Short Fundamental Analysis of TRB Coin**
Trident Protocol (TRB) is a decentralized protocol that aims to provide a secure and efficient way to trade assets across different blockchains. The protocol uses a unique approach called "cross-chain atomic swaps" that allows users to exchange assets without the need for a centralized exchange. This makes TRB a potential solution for the growing problem of asset liquidity in the decentralized finance (DeFi) space.
**Recent News**
* **Trident Protocol Integrates with Arbitrum** (December 6, 2023): Trident Protocol has announced the integration of its cross-chain atomic swap technology with the Arbitrum blockchain. This integration will allow users to trade assets between Ethereum and Arbitrum, which can be used to reduce gas fees and improve transaction speeds.
* **Trident Protocol Releases TRB Staking Program** (November 29, 2023): Trident Protocol has launched a staking program for TRB holders. Stakers can earn rewards in the form of TRB tokens by locking up their tokens in the protocol. The staking program is designed to encourage long-term holding of TRB and to support the development of the Trident Protocol ecosystem.
* **Trident Protocol Announces New Partnerships** (October 20, 2023): Trident Protocol has announced partnerships with several DeFi projects, including Decentraland, Aave, and Synthetix. These partnerships will help to integrate TRB into the DeFi ecosystem and expand its potential use cases.
**Disclaimer**
Please note that I am not a financial advisor and this information is not financial advice. Always do your own research before investing in any cryptocurrency.
I am also not affiliated with Trident Protocol in any way. I am providing this information for educational purposes only.

Symbol search more than one exchange selectableNow when you search for a coin pair on the chart you can only select 1 exchange there where it searches. I would like to put checkmarks there so I can search for that coin pair on multiple exchanges.

TRB UPDATE (4H TF)This is the question of many fans of risky coins, what will happen to TRB. There is no doubt that TRB is in the correction phase.
Given the correction that is forming and the waves that have formed, it looks like we have a diametric. From the supply range, we can move towards the demand range.
For risk management, please don't forget stop loss and capital management
Comment if you have any questions
Thank You

TRBUSDT Elliott wave DailyTellor nice move to the upside!
Further, impulsive-looking price action, will add credence to the bullish scenario, and suggest wave (v) of (3) upper is underway.
Below 55.40 we are looking to the downside for a correction wave (4) Possible pullback into 45.71 - 49.40 zone and than we are expecting to go upside to finish wave (5) of the wave (5) of wave (3) with possible target 72.30 zone.
Future updates will be posted as updates to this count.
Daily intraday updates on 1H and 4H time frame, don`t miss them!!
Good luck!

Trb Breakout ✌Trb
Breaking out ascending pattern, The perfect entry will be on retest level .let's see
Keep eyes on it.
Dyor, This Is Not Financial Advice

TRB Play out TRB performed +1000% since Aug 2023 one of pairs outperform BTC from low market cap to mid market cap .clearly can see cycle is about over time for main correction.
Note:
volume declinc while price going up > bearish
Rsi on 4hr time frame making LL and price making HH > bearish
price in range of golden pocket > bearish
SL> 151
TRBUSDT is going downAfter an unexpected pumping in the price of TRBUSDT, it is now expected to go down.
There are no fundamentals to keep the price going to the moon.
Shorting in OKX using GRID.
This is not financial advice... remember that cryptos are gambling.

update trbprice is making range box
so wait for a break
the possible view in RTM is Drop Base Drop and Drop Base Rally
Now we are in Base side
