Tellor Tributes TRB price analysis⁉️ We don't know what caused yesterday's rise in the price of #TRB, but it is a very, very manipulative asset, just remember the “short squeeze” liquidation on New Year's night 2024.
Now the price of OKX:TRBUSDT has come to the zone where longs had been taking for more than six months, with the hope that the growth trend is about to resume.... but no...
🔽 You shouldn't short it, because it's a very manipulative asset - see p.1
🔼 But whether to take longs with the hope of increasing the deposit or sitting in a drawdown is a matter of individual choice.
We depicted our thoughts at the chart.
_____________________
Did you like our analysis? Leave a comment, like, and follow to get more
TRBUSDT trade ideas

TRBUSDT Breakout from Falling Wedge — Next Stop $32+?🕊️ TRBUSDT breaks out of a multi-month falling wedge pattern with clean structure and increasing volume.
✅ Entry: $26.90 - 24.00
🔻 Invalidation: Below $22.50
🎯 Targets:
TP1: $32.63
TP2: $40.10
TP3: $48.95
The 100 EMA overhead may act as resistance, so watch how price reacts near $32.
Are you watching TRB? Let me know your thoughts below 👇
#TRBUSDT #Altcoins #BreakoutTrade #CryptoTrading #ChartPattern #FallingWedge #TechnicalAnalysis #TrendReversal #CryptoSignals

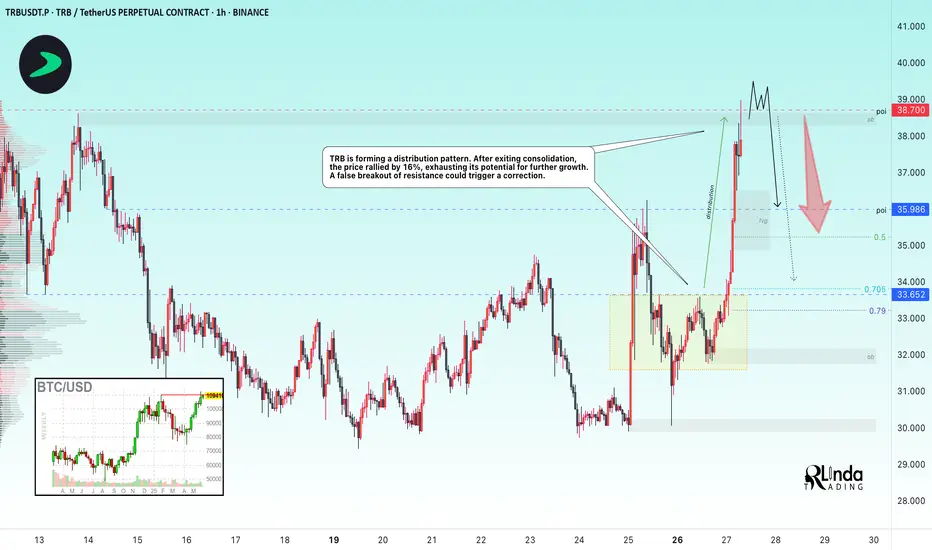
TRBUSDT → High probability of a false breakoutBINANCE:TRBUSDT.P is testing resistance in the 38,700 range as part of a rally. The current strong movement may end in a false breakout...
TRB is forming a distribution pattern. After exiting consolidation, the price rallied 16%, exhausting its potential for further growth.
A false breakout of resistance could trigger a correction.
Bitcoin looks controversial in the overall situation. After a false breakout of the 110K resistance, the price is consolidating below the level. If the flagship correction begins, it may also trigger a correction in altcoins...
Resistance levels: 38,700
Support levels: 35.98, 33.65
If the price fails to consolidate above the level and continue to rise, this will confirm the absence of bullish potential. A false breakout and price consolidation below 38.700 will trigger a correction to 36 - 33
Best regards, R. Linda!
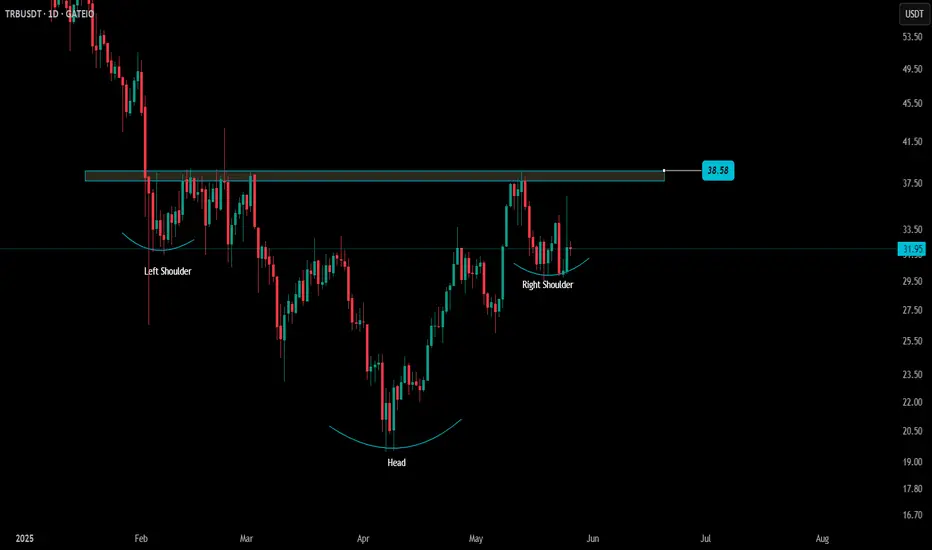
Tellor Double iH&S —Marketwide Higher High NextYou can never miss a bullish market. Whenever the market stops, goes sideways, some pairs just can't take it and continue growing. They grow bullish and continue bullish and move straight up. Aren't we supposed to crash? Isn't the market going lower?
Hold on, the question: Will Bitcoin continue and hit $120,000 or is it $100,000 next?
When Bitcoin crashes, everything crashes.
Just a few days ago, it was AAVE that was moving straight up. See how Tellor is moving today, some pairs are sideways and there isn't strong bullish momentum marketwide but still, some pairs are moving ahead. This moving ahead is what reveals what comes next marketwide; bullish continuation of course.
Super high volume on this TRBUSDT chart just two days ago.
Notice the double inverted head and shoulders pattern.
Notice the change from a bearish to a bullish trend.
Notice the full green candle...
Cryptocurrency will continue growing; it is already growing and will continue to do so long-term.
Namaste.

TRB – Channel Support Test and Inverse H&S Formation🕓 On the 4H timeframe, TRB is trading within a channel and is currently testing the lower boundary.
⚠️ This zone could lead to either a quick reversal or a clean breakdown — it's a critical level to monitor 👀
📆 On the daily chart, an inverse Head & Shoulders pattern is starting to take shape.
📍 Key resistance lies at the 38+ region — bulls need to reclaim and hold this zone for any meaningful upside 🔼
👁️ Keep this setup on watch — confluence across timeframes adds weight to the potential move.
TRB Weekly mapWe see a very clear Gartley Pattern which is completed and triggered
Wave ABC is completed in zigzag pattern after a 5 wave impulse wave
Now price is at very first step of second impulse wave
Targets are clear !

TRBUSDT | MAJOR RESISTANCE OF THE LAST 100 DAYS🚀 TRBUSDT is currently testing a MAJOR resistance zone! 🚧🔥
After breaking out of a 134-day downtrend line 📉, and reclaiming the lowest high 🔄, TRB has now entered a critical 100-day resistance area 🧱.
📍 This zone has acted as a strong supply level in the past ⛔ — a successful breakout ✅ could open the path toward the previous major high around $95 🎯.
📈 RSI is holding above 65, indicating strong bullish momentum 💪🐂 — but the breakout still needs to be confirmed with volume 🔊 for continuation.
If rejected 🚫, a pullback to the $32–$29 support zone is likely 🛡️.
📊 Key Levels to Watch:
🔴 Resistance: $37.9 – $39.5 (MAJOR 100-DAY RESISTANCE)
🟢 Support: $32.1 and $29.0
🧠 Stay alert and manage risk wisely! 🛑

TRB SELLHello friends
Due to the sharp drop in price, we can open a trade in the direction of the trend, of course with capital and risk management.
*Trade safely with us*

#TRB/USDT#TRB
The price is moving within a descending channel on the 1-hour frame, adhering well to it, and is heading for a strong breakout and retest.
We are seeing a bounce from the lower boundary of the descending channel, which is support at 30.84.
We have a downtrend on the RSI indicator that is about to be broken and retested, supporting the upward trend.
We are looking for stability above the 100 Moving Average.
Entry price: 28.20
First target: 29.00
Second target: 29.87
Third target: 30.84

$TRB/USDT Targeted setup $TRB/USDT – Targeted Setup
Clear descending wedge breakout
Retest of the resistance zone holding as support
Bullish structure forming with higher lows
- Entry zone: CMP
- Target: $98
- Stop-loss: $26
This is a clean breakout-retest setup, with momentum favouring bulls.
As long as $29.98 holds,
Eyes are on $97. 👀
DYOR, NFA

TRB Back Inside Macro Range — Accumulation Likely?TRB has re-entered a long-standing macro range between $9.93 and $44.24, a zone it previously consolidated in for over a year. Current price action and volume behavior suggest we could be in for another extended accumulation phase.
Key Highlights:
Macro Range Reclaimed: Weekly candle closes confirm acceptance back inside range
Low Volume Environment: Subdued volume across the board reduces breakout probability
Historical Precedent: TRB traded sideways here for 371 days before its last breakout

TRBUSDT 1D#TRB has broken above the falling wedge pattern on the daily chart.
In case of a successful retest of the pattern and a breakout above the daily MA50, the targets are:
🎯 $32.11
🎯 $37.98
🎯 $48.79
🎯 $57.53
🎯 $66.27
Use a tight stop-loss.

TRBUSDT 1WTRB ~ 1W Analysis
#TRB Buy back from here with a short -term target of at least 20%+ from here.

TRB/USDT(UPDATE)Hello friends
Given the price drop, you can see that buyers supported the price on good support and were able to build a higher ceiling.
Now we have identified important and practical support areas for you to buy in steps and with capital management.
Price targets have also been identified...
*Trade safely with us*

TRB...Hello friends
According to the formation of a trading range, if the price manages to break through the price, the specified ranges can be a good support.
*Trade safely with us*

Tellor (TRB) a hidden gem, will previous price action repeat?Hello again dear reader for a another analysis.
From August to December 2023 TRB has seen a MASSIVE move of 7000% gains over the course of just 126 days. Since then it has corrected a whopping 96%!
There is now a reason to be bullish on this coin. Looking at the drawn structure we can see multiple important touch zones described with the letters ''A till F'' (NOT ELLIOT). It is quite possible price action might correct further till 19$ where a big support zone lies, but there is no guarantee that ''will'' happen.
Target: 1200$ (M-cap of 3B which is very achievable)
Stoploss: 15$
I aim to keep analysis simple and easy to understand. Any questions of requests for analysis feel free to ask!
Rustle

TRB SHORT !!!!#TRB/USDT
Entry zone : 42.219 - 41.153
Targets : 40.783 - 39.959 - 39.135 - 38.311 - 37.487 - 36.663 - 35.839 - 35.015
Stop loss :43.8593
#TRBUSDT remains bullish📈 LONG BYBIT:TRBUSDT.P from $38.35
🛡 Stop Loss: $38.00
⏱ 1H Timeframe
✅ Overview:
➡️ BYBIT:TRBUSDT.P is in a strong uptrend, breaking the key $38.35 resistance level.
➡️ POC (Point of Control) at $34.47 indicates the highest liquidity zone far below the current price, confirming strong buyer support.
➡️ The price has broken through the $38.30 area and is consolidating above, opening potential upside toward $39.30.
➡️ If the price holds above $38.35, bulls may continue pushing towards target levels.
⚡ Plan:
➡️ Enter long after confirmation above $38.35, signaling a bullish continuation.
➡️ Risk management via Stop-Loss at $38.00, placed below the support zone.
➡️ Primary upside targets:
🎯 TP Targets:
💎 TP1: $38.90
🔥 TP2: $39.30
🚀 BYBIT:TRBUSDT.P remains bullish—expecting further upside!
📢 BYBIT:TRBUSDT.P shows strong buying momentum, breaking key resistance levels.
📢 If $38.35 holds as support, the probability of reaching $39.30 increases.
📢 However, if the price drops below $38.00, a pullback to lower levels may occur.

TRBUSDT 1WTRB ~ 1W Analysis
#TRB Back to this support,. Buy from here if you still have a Conviction on this coin with a minimum target of 20%++

TRBThe TRB token has reached the bottom of its range, according to the market conditions, one should wait until the fate of Bitcoin is known
2 areas specified in the image are very attractive areas for medium-term buying
If the price reaches 23-30 dollars, I will buy it with my eyes closed

TRBUSDT:100% Daily Volume Surge – A Bullish Setup in the Making!Extreme Bullish Potential with Smart Entry Points
"TRBUSDT is catching attention with a 100% daily volume increase. Big moves like this don’t happen by accident – the market is speaking, and we’re listening."
Here’s What I See:
Black Line Manipulation: If the price manipulates the black line, I believe the chart will enter an extreme bullish condition. However, patience is key – no trades without confirmation of an upward breakout.
Breakout and Retest: The golden rule – wait for the breakout, then target the retest for a strong and safe entry.
Demand Zones Below: Let’s not forget, there are solid demand zones below that could provide additional opportunities.
Key Observations:
"As always, I rely on the data: CDV, volume profile, and liquidity heatmap must confirm the expected price action before I commit to a trade. No confirmation, no entry!"
This is a chart full of potential. Be patient, act smart, and let the market show its hand. 🚀
Let me tell you, this is something special. These insights, these setups—they’re not just good; they’re game-changers. I've spent years refining my approach, and the results speak for themselves. People are always asking, "How do you spot these opportunities?" It’s simple: experience, clarity, and a focus on high-probability moves.
Want to know how I use heatmaps, cumulative volume delta, and volume footprint techniques to find demand zones with precision? I’m happy to share—just send me a message. No cost, no catch. I believe in helping people make smarter decisions.
Here are some of my recent analyses. Each one highlights key opportunities:
🚀 RENDERUSDT: Strategic Support Zones at the Blue Boxes +%45 Reaction
🎯 PUNDIXUSDT: Huge Opportunity | 250% Volume Spike - %60 Reaction Sniper Entry
🌐 CryptoMarkets TOTAL2: Support Zone
🚀 GMTUSDT: %35 FAST REJECTION FROM THE RED BOX
🎯 ZENUSDT.P: Patience & Profitability | %230 Reaction from the Sniper Entry
🎯 DEXEUSDT %180 Reaction with %9 Stop
🐶 DOGEUSDT.P: Next Move
🎨 RENDERUSDT.P: Opportunity of the Month
💎 ETHUSDT.P: Where to Retrace
🟢 BNBUSDT.P: Potential Surge
📊 BTC Dominance: Reaction Zone
🌊 WAVESUSDT.P: Demand Zone Potential
🟣 UNIUSDT.P: Long-Term Trade
🔵 XRPUSDT.P: Entry Zones
🔗 LINKUSDT.P: Follow The River
📈 BTCUSDT.P: Two Key Demand Zones
🟩 POLUSDT: Bullish Momentum
🌟 PENDLEUSDT.P: Where Opportunity Meets Precision
🔥 BTCUSDT.P: Liquidation of Highly Leveraged Longs
🌊 SOLUSDT.P: SOL's Dip - Your Opportunity
🐸 1000PEPEUSDT.P: Prime Bounce Zone Unlocked
🚀 ETHUSDT.P: Set to Explode - Don't Miss This Game Changer
🤖 IQUSDT: Smart Plan
⚡️ PONDUSDT: A Trade Not Taken Is Better Than a Losing One
💼 STMXUSDT: 2 Buying Areas
🐢 TURBOUSDT: Buy Zones and Buyer Presence
🌍 ICPUSDT.P: Massive Upside Potential | Check the Trade Update For Seeing Results
🟠 IDEXUSDT: Spot Buy Area | %26 Profit if You Trade with MSB
📌 USUALUSDT: Buyers Are Active + %70 Profit in Total
🌟 FORTHUSDT: Sniper Entry +%26 Reaction
🐳 QKCUSDT: Sniper Entry +%57 Reaction
📊 BTC.D: Retest of Key Area Highly Likely
This list? It’s just a small piece of what I’ve been working on. There’s so much more. Go check my profile, see the results for yourself. My goal is simple: provide value and help you win. If you’ve got questions, I’ve got answers. Let’s get to work!

TRB new ath or dump?TRB pumped over 1000% in a few months. What next? BINANCE:TRBUSDT.P
Possible Targets and explanation idea
➡️Weekly chart. Fib relevant. We bounce after long accumulation around 0.27 zone
➡️Now tested and got reaction at 0.5 lvl. Red block marked sellers zone
➡️Why exactly red block because its around 0.78 + 124.56 and its a 0.5 lvl of wick fib
➡️Interesting we still not see any signals to sell like it was in 2021.
➡️It means whales can push price higher to new ath and only after that dump to main block
➡️Main block for correction will be Monthly FVG what we will forming in October
➡️Based on Money Power indicator in June 2023 we got touch of bottom on money inflow
➡️Green circle - MACD div on weekly timeframe
➡️Now we are in distribution zone where whales can start take profit (look on previous times how this zones playing out)
Hope you enjoyed the content I created, You can support with your likes and comments this idea so more people can watch!
✅Disclaimer: Please be aware of the risks involved in trading. This idea was made for educational purposes only not for financial Investment Purposes.
---
• Look at my ideas about interesting altcoins in the related section down below ↓
• For more ideas please hit "Like" and "Follow"!

TRADE PLAN FOR TRB FOR PROFITSHello traders, Happy new year, a look into TRB and its opportunity.
We follow the chart and we can see the price just touched the support zones for a buy .
Enjoy the profits our target long term is $93
Tradehubng
