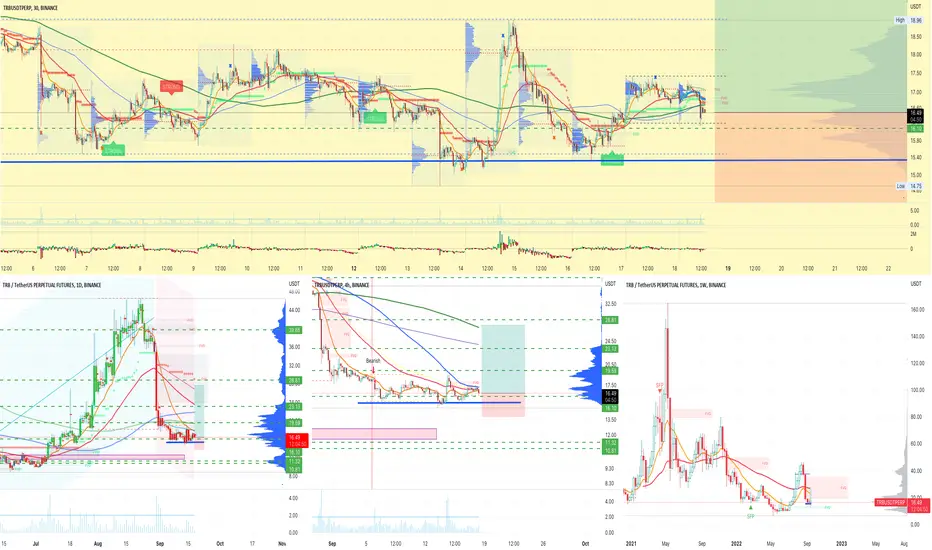
TRBUSDT | WATCHOUT ZONETRBUSDT after hitting a top at 45 has been trading in downtrend, The price has approached to the strong horizontal support zone . The bulls took control from support zone. The broken rising support now acts as resistance. The price has been trading in range. The price need to broke above the resistance.
Manage your trades accordingly.
TRBUSDT trade ideas

TRB short opportunityTRB Has formed bearish flag and now it's about to crash. tomorrow if the CPI report is negative it will crash to 13.20 or even below that price. we can take shoer position after breaking out of bearish flag
entry after breakout
tp: 13.50 - 13.25
stop loss: 15
happy trading

TRB SELL TRADE SETUPHello, dear traders. how are you ? Today we have a setup to buy/long the TRB symbol.
For risk management, please don't forget stop loss and capital management

TRBUSDT SHORTRisk warning, disclaimer: the above is a personal market judgment based on published information and historical chart data on Tradingview, all analysis is only subjective. Hope investors consider, I am not responsible for your investment decision. Thank you.
Good luck!

TRB SMALL SPOT LONGHello,
TRB USDT I will search for spot at 15.11 (wait for the entry), Targeting (16.98 - 17.89 - 19.48), SL 4h close under 14.14.
Dyor Not financial Advice.


TRADE ALERT - LONG TRBUSDTPosition = TRB
Entry = 13.87
Stop Loss = 12.63
Final Target = 21.82
Risk/Reward = 7.33/1
Leverage = 5x
Profit Potential = +58%

Trb usdt longTrb possible long idea if break the channel resistance and hold above the green support box
Then it can tap orange TPS

$TRB - Double Bullish DivergenceHello my Fellow TraderZ,
$TRB is ranging inside a FALLING WEDGE Pattern on 4 HTF.
I've mentioned here that the Double BULLISH DIVERGENCE is in formation on 4H RSI.
Price is just getting hit by EMA 55 if clears and breaks out of the Wedge Pattern, we can see the mentioned targets.
Also if we lose $14.7 , look for SHORT,
Trade well FAM. CHEERS!!!

Trb interesting zone for DCATRB, i truly don't know nothing about it
Forked, respecting the 50% line and camping at the golden pocket. Fed will price inflation soon. Be careful. Good DCA position. Stochastic also gaining some traction.
NFA

Smc, wyckoff divergence and patternsIn studying the chart of this trb coins i saw bullish divergence in 1 day tf so i tightly stand for long position because based upon to my experience divergence s playout like.

TRBUSDT | BUY ON SUPPORTTRBUSDT has been trading in bearish trend. The price is making lower lows and lower highs. Currently it is trading at rising support trendline The rising trendline is 4 months long support and price multiple times took support. There is also a confluence point having horizontal support too. . The bulls can show strength at this point. The bullish candles formation on support will confirm the bulls strength.
The bulls need to hold the support zone .
Trade your levels accordingly.

TRBUSDT needs to have a retracement?The price had an amazing bullrun and after a false breakout of the daily resistance on the 42$ area, the price is testing the 4h support after the breakout of the dynamic support
How to approach it?
IF the price is going to lose the support and retest as new resistance, According to Plancton's strategy , we can set a nice order
–––––
Keep in mind.
🟣 Purple structure -> Monthly structure.
🔴 Red structure -> Weekly structure.
🔵 Blue structure -> Daily structure.
🟡 Yellow structure -> 4h structure.
–––––
Follow the Shrimp 🦐

TRB, time to shine? Hey, I was short on TRB some time, but change to bullish due to bottom formation on 4h. Will we reclaim MA200? What do you think?
TRB/USDT just my idea Maybe next week till weekend may we see usdt index below around 6.6% .So btc and crypto all grown up

LONG TRB PART2!!as we can see in the previous chart we finished B wave and we got a great bounce to wave 1 of wave C and are heading to wave 2 and we might have a great pump in wave 3

Long position idea on $TRB [risky!]Quite a simple straightforward trade which could prove to be a big fail considering the FUD going around the project and how it is being called the next $LUNA but from a pure TA point of view this is a very valid trade.
Using adequate risk percentage / position sizing is vital and I can't stress enough on that.
Crazy funding rates on exchanges right now as well; -1.5% on ByBit right now for an example and that on its own is worthy of a shot at a long imo.
Entry and target zones marked.
LFG 🚀

TRBUSDT 4H TRBUSDT is about to breakout. Next stop is 22 level. BUY here and hold . Support level is at 15 and resistance level is at 22.5.

TRBHELLO GUYS THIS MY IDEA 💡ABOUT TRB is nice to see strong volume area....
Where is lot of contract accumulated..
I thing that the buyers from this area will be defend this long position..
and when the price come back to this area, strong buyers will be push up the market again..
UPTREND + Support from the past + Strong volume area is my mainly reason for this long trade..
IF you like my work please like share and follow thanks
TURTLE TRADER 🐢

$TRB short ideaHello dear Traders,
Here is my idea for #TRB
Price closed below yellow line (previous month low)
Wait for close below purple trigger line to enter trade.
Targets marked in the chart (black lines)
Invalidation level marked with red line
Good luck!
❤️Please feel free to ask any question in comments. I will try to answer all! Thank you.
Please, support my work with like, thank you!❤️

TRB/USDTTRB/USDT
He managed to break the roof of the channel, but returned to the channel again.
The $16 level is a critical level.
If it manages to maintain it, it can grow up to $27, otherwise, the target of $8 is available.
#TRBUSDT #TRB #BTCUSDT #BTC #ETHUSDT #DOGE #DOGEUSDT

TRBUSDT - 15M (15.09.2022)TRBUSDT
TF: 15M
Side: Long
Pattern: Falling Wedge
Entry: Between $16.6888 & $18.9769
SL: $16.6888
TP 1: $17.4931
TP 2: $17.7767
TP 3: $18.0059
TP 4: $18.2350
TRB is coiling on 15M TF and getting ready to go on a wild ride.
