TRBUSDT trade ideas

TRB SHORTI think TRB decline will continue. It came to its first resistance and today it has got some response increase till its resistance.
I guess it will continue to decrease its 35 sma daily which is 33.27usdt and then target will be 28usdt as a big resistance.
disclaimer: purpose of this post is educational. this post is not an investment advice.

Tellor (TRB) formed bullish Shark for upto 26% pumpHi dear friends, hope you are well and welcome to the new trade setup of Tellor ( TRB ) token with US Dollar pair.
Now on a 4-hr time frame chart, TRB has formed a bullish Shark .
Note: Above idea is for educational purpose only. It is advised to diversify and strictly follow the stop loss, and don't get stuck with trade

TRBUSDT SHARKShark
The Shark pattern is a distinct 5-point reversal structure that was discovered by Scott Carney in 2011. It is similar to the Bat Pattern, except for the C point exceeding the BC leg. It can point to a strong counter-trend move. The potential Reversal Zone (PRZ) is defined by the following harmonic levels: the 0.886 retracement of initial leg and the 1.13 reciprocal ratio of the initial leg. Targets can be various retracements of the CD leg, all the way up to C itself. There are different methods of determining where the stop would go. Some put it beyond the next structure level after the D point, others choose the 1.41 extension of XA.
Conservative traders look for additional confirmation before entering a trade based on an indicator value, a specific candlestick pointing at a reversal or confluence with other methods. The Shark pattern can be either bullish or bearish. It is as effective as other harmonic patterns and a common variation on trading this pattern is to trade the last leg to completion. TradingView has a smart drawing tool that allows users to visually identify this price pattern on a chart.

Wyckoff with smcA combination of wyckoff and smc strategy because i saw two lower low in the previous and present swing also ob bound at support area where it has a high probability of bouncing up

TRB retrace for shortHTF weekly show rejection, poor fundamentals and macro bearish sentiment. Short term can expect regression to mean before we re-enter and take price lower to sub 30,20 etc depending on market at the time.

TRB/USDTTRB/USDT
The downtrend line has broken on the daily time frame.
We will have a pullback to the $27 level and from there it will start its upward trend.
#TRBUSDT #TRB #BTCUSDT #BTC #ETHUSDT #DOGE #DOGEUSDT


TRB Swing Short IdeaWeekly Bearish Divergence with declining volume
Confluence with 0.236 fib retracement level
Confluence with D1 and H4 rising wedge
Think we see quite a large correction here
Invalidation on break above $46.60
Playing level to level

TRBUSDT | SELL ON BREAKTRBUSDT has been trading in a rising wedge . The price action is currently trading near the lower boundary of wedge . We are watching out the breakout of wedge and price action on lower boundary of wedge.
The bulls need to sustain price above the lower boundary of wedge, While below break of wedge bears will get strength.
Manage your levels accordingly.

TRB / USDThi guys
📌According to the market conditions, we should now look for coins that have more favorable conditions to start falling.
TRB can be one of these coins that has these conditions:
1 - Rising Wedge
2 - 3 drives
3 - Reject from the upper level of the parallel channel.
👍(If you find this post useful, give it a thumbs up, share your thoughts in the comments, and feel free to spread the word).

Trb/usdt making a ascending triangle We can see ascending triangle on 1h tf for shorter time frame you can long it and tp us mentionoed

Short TRBAs always, candles don't lie. We have completed Wave 5 at a key resistance. These doji daily candles are done and we have a great short opportunity at play. Resistance is at $43 and it can't close above it. I am going to ladder short this so I don't get wicked out. I have the ABC correction laid out with Fibonacci levels that traces back to Wave 1. Momentum and the RSI are also flipping bearish.
This chart based off of The Elliot Wave Theory, Fibonacci, EMA’s, MacD , RSI , Momentum, and resistance/support zones combined with patterns.


shortLet's go for the first analysis
Due to the existence of a heavy vacancy in the 6-hour time frame and the formation of the Wykoff pattern, the probability of this currency falling is high.

TRB/USDT Waiting for confirmations! Good morning guys,
We see a great opportunity for TRB once it breaks down from out zone at $38. Tellor is sitting at very interesting zone where breaking from there would mean going for a bearish run. As always Red zone is our sell zones/ Stops and green zone is open for targets!!!
If you like ideas provided by our team you can show us your support by liking and commenting.
Yours Sincerely,
Swallow Team 🔱
Disclamer:
We are not financial advisors. The content that we share on this website are for educational purposes and are our own personal opinions.

TRBUSDT Future position shortTRBUSDT - open short position in Binance exchange with 1:1.5 risk to reward ratio entry at 41.7 and stop loss at 42.7 and take profit at 40.4.
I don't anyone's financial condition, I'm a day trader open for 2-3 hours.

Bear flag On the weekly , here’s strong resistance at 44$
There for , it’s a short scalp
Entry point in the red shaded area
Not a financial advice

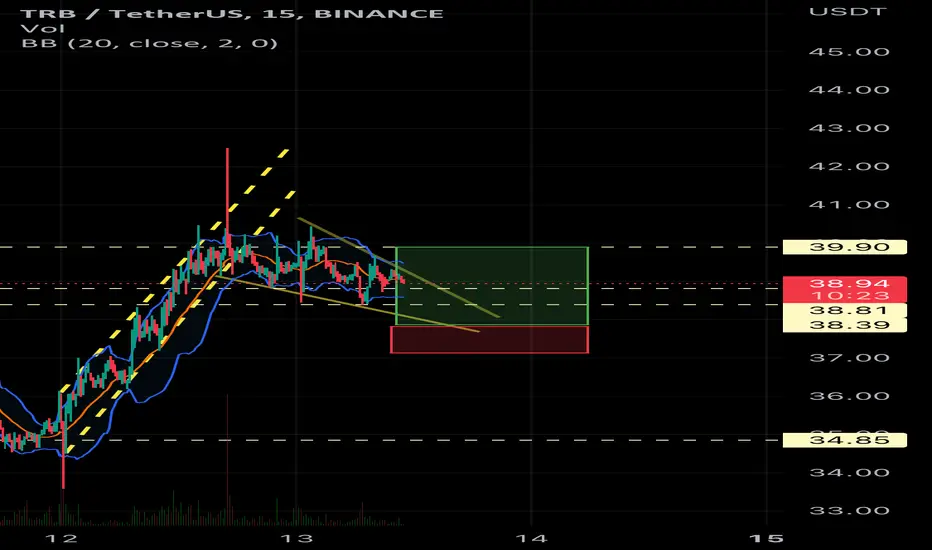
TRB quick H&STellor just formed Head and Shoulders 🤷 pattern on 15m and also broke the yellow uptrendline IF price breaks the Neckline 39.15 and stays below for a few bars, I will set SELL LIMIT order to the neckline level to catch the backtest as I think there is chance for drop to 35.9 later.
ENTRY : backtest of the Neckline @ 39.1
STOPLOSS (SL) : Left Shoulder @ 40.47
TARGET (TP) : Inverted H&S target projection @ 35.9
REWARD RISK RATIO (RRR) : 2.5
INVALIDATION : when SL level hit
Check my other stuff in related ideas.
Please boost🚀, comment🗣️, follow me✒️, enjoy📺!
⚠️Disclaimer: I'm not financial advisor. This is not a financial advice. Do your own due dilingence.

Short set up for TRBTrb has been a positive trend since the dip from 18 june. If Btc can not break the resistance at 24700usdt and start to pull back, i expect trb to pull back 24usdt area which is a decrease approx. %35.

BuyBull flag
Short scalp
Entry point 36.8- 37.4
Stop loss 36.4
Take profit 39.8
Not a financial advice
on watch for pivot break 👀#TRBUSDT $TRBUSD on watch for pivot break 👀
break past 44.80 long trigger/pivot will lead to rally towards 46-65.8-85.59
