TRB/USDT looking very interestin!Good morning guys,
We see a great opportunity for this coin names TRB. So what is this TRB? Tellor or TRB is a decentralized oracle protocol. Oracles are a key part of blockchain infrastructure that update valuable off-chain data, making it available for on-chain smart contracts. Here we are.... After few weeks ago when we had a breakout from $16 zone it just rallied up towards $38 zone where is has stopped for now.
As always Breaking from here would mean a massive bullish wicks and breaking down from here would mean going back to this sideways path it tries to exit at the moment.
If you like ideas provided by our team you can show us your support by liking and commenting.
Yours Sincerely,
Swallow Team 🔱
Disclamer:
We are not financial advisors. The content that we share on this website are for educational purposes and are our own personal opinions.
TRBUSDT trade ideas

TRBUSDT - Long by Supertrend, Pivot & ADX 8/11/20221. HIGH/LOW PIVOT:
- Pivot Left: 10 | Pivot Right: 10
Long trend identification:
- Higher High occurs after Higher Low.
2. ADX INDICATOR: 1h & 4h timeframe have a strong strength for open trade.
- ADX smoothing: 14.
- DI length: 14.
- ADX STRONG > 25.
3. SUPERTREND INDICATOR:
- Long trend when closes candle is above the green line.
4. OPEN POSITION RULE:
- BUY/LONG: reject to Supertrend at current timeframe.

TRBUSDT | BEARISH SIGNSTRBUSDT has been trading in a bullish parallel channel . The price with in a bullish channel was trading with in a defined range of support and resistance . Now it has broken support and trading below the support zone . We are expecting price will took a beat from broken support now act as resistance zone .
The bulls need to break above the broken support. While bears will be active below the bullish channel .
Manage your trades accordingly.

trbusdtIf the trading range support is broken, you can enter the position after a pullback or a suitable entry point

TRB/USDT LONG1. Good drop.
2. Fall support zone .
3. Entry from the support zone .
4. Good risk to reward ratio.

TRB/USDT LONG 🚀Disclaimer: I am not a financial advisor. Do not take anything on tradingview as financial advice. Do your own research!

Short TRBTRB can't break this double top with all the bearish indicators suggesting a reversal. TRB is at a strong Fib level on the daily timeframe. A Wave 5 impulse at the top of a strong resistance are solid shorts to take. I highlighted the Wave A target based off Fib levels (lower time-frame fibs) as well.
This chart based off of The Elliot Wave Theory, Fibonacci, EMA’s, MacD , RSI , Momentum, and resistance/support zones combined with patterns.


TRB is ready for a shorti will short TRB USDT above 21$
75% and 25% will be closed on two take profit lines.
in case it goes wrong,i will update for a stop loss

Please helpHey, i need help with my entries and setting a stop loss... This is the trade you took today on TRB, and my perspective, how i would have taken the trade (which sucks)...

TRBUSDT Inverted Head and Shoulder on going tradeentered on price 16.9 for intraday trade and will be taking profit at around 18ish

thats my thought on trbusdt - waiting to short it soon thats my thought on trbusdt - waiting to short it soon

Don't miss opportunity for short position Daily Scalp
all you need to know is in the chart
look closely and make your position smartly
this is just my idea and not financial advice or a signal for buy/sell


TP 1 reached, wait for TP 2We reached the target and made 36% profit with 20x
Keep following for getting notification of new idea
Target 2 is also possible. Sell 75-80% now and keep remaining 20-25% for target 2. And also put stoploss at Entry price
N.B. Don't enter this trade now

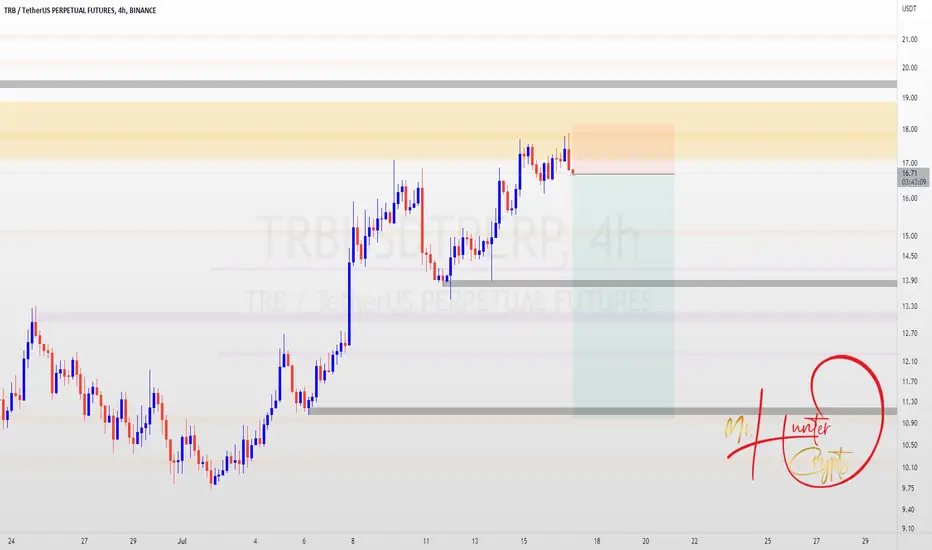
TRBUSDTPERPDue to the weakening of the upward steps in the movement of this currency and the creation of a double ceiling, it is expected to fall to lower prices.
Trendline Breakout!! Short TRB to ScalpTP 1= 16.55
TP 2= 16.23
S. L.= 17.15
Forming a possible double top, As well as facing a trendline resistance. It can go even lower. But this post is a scalping idea. Always do your own analysis before you enter

LETS see TRB/USDTTrb printed a bearish triangle pattern and breaked it and we can see a clear breakdown
now we will see a clear downward movement after a retest
Targets are
🚀15.80
🚀15.65
🚀15.36
🚫Stoploss at16.6🚫 use risk management always

LETS see TRB/USDTTRB is rejected 4 times from this resistance zone and this time we will see a downward movement again trb is alredy rejected from here so cath the short position and enjoy profit (Use ris management always)

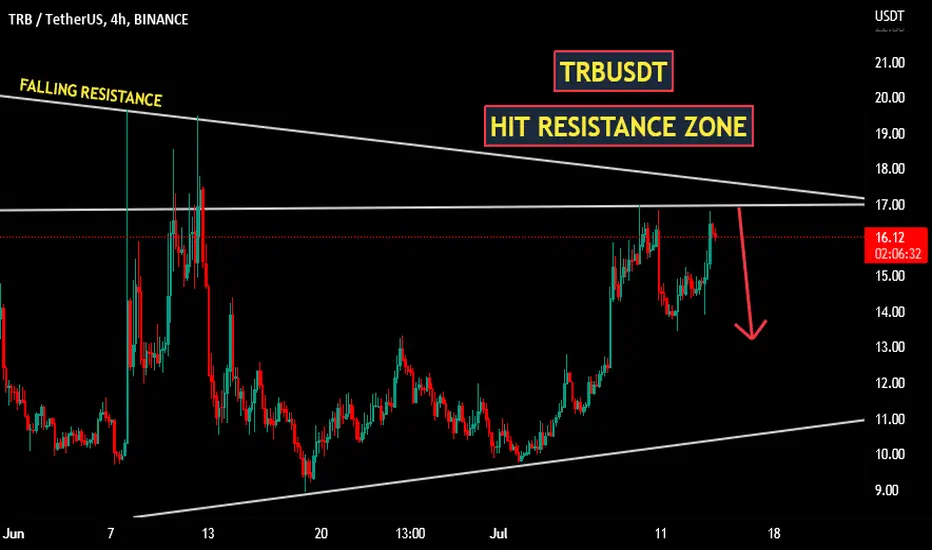
TRBUSDT | HIT RESISTANCE ZONETRBUSDT has hit the upper boundary of channel, Which is a horizontal resistance zone. The price action took a beat from that resistance zone.
We are expecting a downfall of price from resistance zone towards it support zone. The bears will take control from resistance zone. While bulls will be only in party if price closed above falling resistance line.
Trade your levels accordingly.