TRBHello Traders, as you can see 1 hour candle closes out of the bump and run, so that's mean it gonna go up, it seems a perfect trade and I am longing. NFA
Good Luck
TRBUSDT trade ideas

Tellor Token (TRB) Technical Analysis TRB/USDT TArget $75Tellor Token (TRB) Technical Analysis TRB/USDT TArget $75
as per my analysis trb is ready to burst and it formed the perfect bullish chart pattern
Target 1 - $75

trb to targets!trb is going to reach targets!
according to fib retradcement and a small cup model the probable target will be about 90$

Tellor THE SKY IS THE LIMIT!looking good here. Strong project with good fundamentals. I would like to see a bounce back up from the green circle. This would give the perfect entry. Once the two resistances are flipped, the sky is the limit for this one
I hope you found the idea interesting:)


TRBUSDT look Bullish!TRBUSDT (1H Chart) Technical analysis
TRB/USDT (1H Chart) Currently trading at $8.95
Buy level : Above $60
Stop loss: $57.00
TP1: $63.90
TP2: $66.50
TP3: $70
Max Leverage: 2x
Always Keep Stop loss

TRB - a quick trade, don't miss it❗🚀A potential quick trade. TRB broke through the local key level of $52.2. And is now testing as support. The target is $57 to $59.
Write in the comments all your questions and instruments analysis of which you want to see.
Friends, push the like button, write a comment, and share with your mates - that would be the best THANK YOU.
P.S. I personally will open entry if the price will show it according to my strategy.
Always make your analysis before a trade

TRB USDTTRB is already moving up this is my position. TRB broke out of consolidation i think it wil test the resistance


TRBUSDT is testing the weekly resistance 🦐TRBUSDT is testing the weekly resistance. If the price is going to have a breakout, According to Plancton's strategy (check our Academy ), we can set a nice order
–––––
Follow the Shrimp 🦐
Keep in mind.
🟣 Purple structure -> Monthly structure.
🔴 Red structure -> Weekly structure.
🔵 Blue structure -> Daily structure.
🟡 Yellow structure -> 4h structure.
⚫️ Black structure -> <4h structure.


Another Idea Is Ready. In Sha AllahHello Everybody! Again Share With my Idea. I think Market move in that direction. In Sh Allah

TRB/USDTWhat do you think about this TRB trade?
I think this is one other gainer opportunity in the cryptocurrency market.

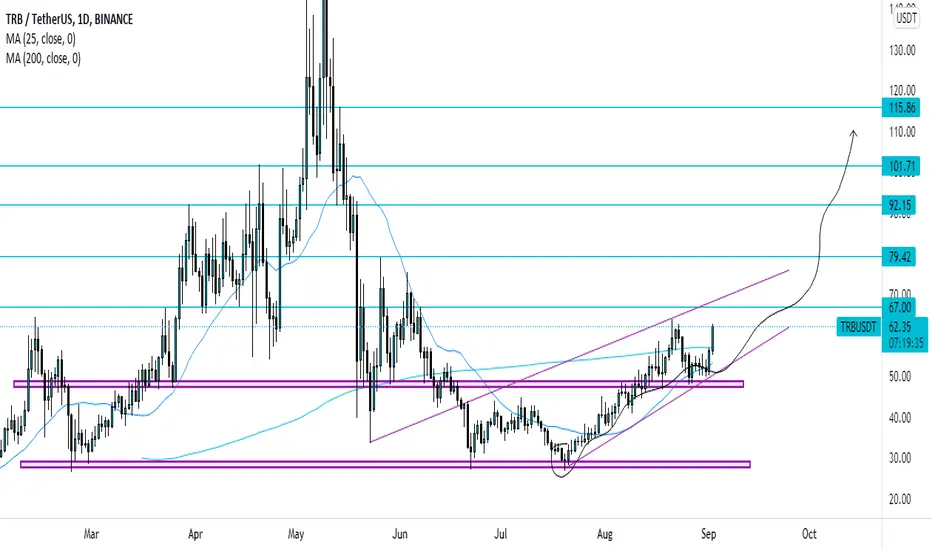
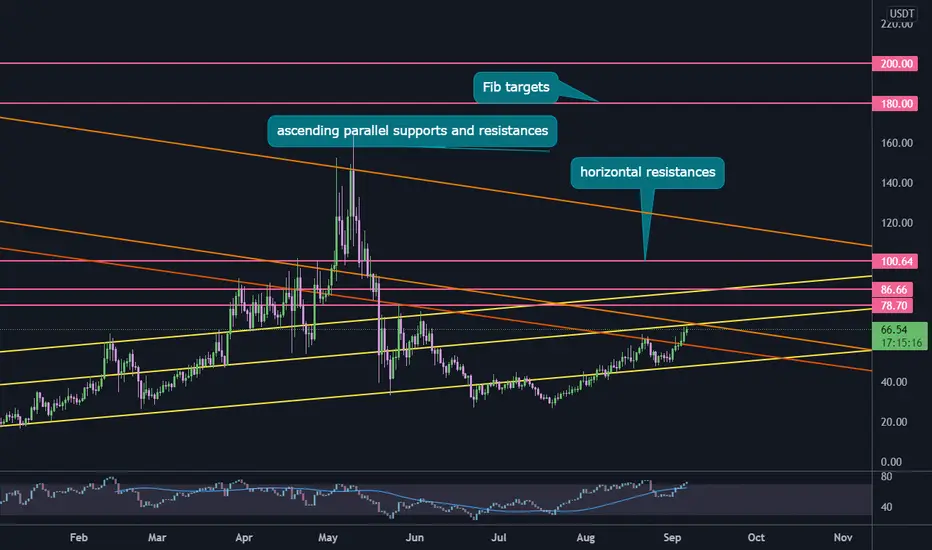
TRB below resistances#TRBUSDT
$TRB is trading below 2 long term descending and ascending resistances.
nearest support is around $58.
#TRB price if break this resistance zone, can reach $85 and even $100. which is 50% increase from here.
If $TRB go up to make a new all time high it will be around $180 and $200.
TRB CoinBuying Zone - Around 60$ And Selling Zone - 61.5-62$.
If it breaks the resistance ( Selling Zone ) than the next selling zone or resistance will be at 65$. Don't Forget to Follow Fore More.

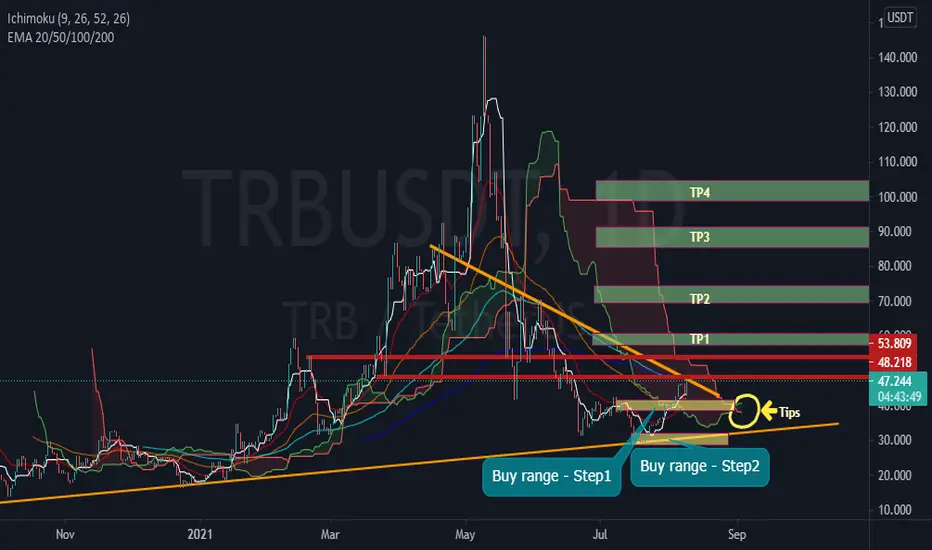
Cup and Handle in TRB Support : MA200 & Ichimoku 103
and
Cup and Handle in TRB
BEST For Buy In Daily ( step by step )

TRB/USDT Playing Wave 3 Bullish RR 1:16In detail my current finish wave was 2 and starting to wave 3 with atleast 161.8
Let long. Hope have a good day.

TRBIt has reached its dynamic and static resistance
It is hard work to break the resistance
I hope this resistance will be broken due to the good market conditions
$ 48 and then $ 53 are important limits to achieve the specified target
In case of fall, shopping areas are marked with a yellow box
TRB is trying to break the last resistance with a C&H patternTRB is trying to break the last resistance with a C&H pattern to vitis the next one at 1.618 fib

TRBUSDTWait for break on key Daily level.
Price target seems extreme but remember there is a very small amount of coins in circulation for TRB.
This always leads to a massive imbalance between buyers and sellers leading to extreme moves for TRB when price breaks key levels.

Binance is an investor in $TRB and it hasn’t performed much yet#TRB Going for a breakout on a higher timeframe with support Around $50. and heavy accumulation detected massive breakout is very much possible for it🚀
Binance is an investor in #TRB and it hasn’t performed much yet.