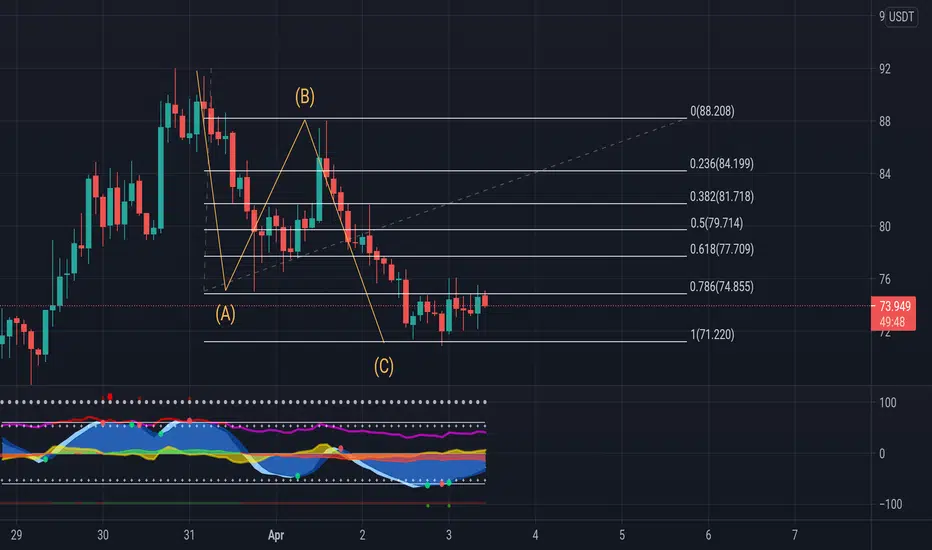
TRB/USDT-LONGThe new uptrend rally is commencing after reaching 1st target and complete pullback on downtrend line.
Pay attention please, this isn't financial recommend.
TRBUSDT trade ideas


TRBUSDT Daily S/R| Swing High| Price Action| Trend Evening Traders,
Today’s analysis – TRBUSDT – trading above its Daily S/R where continuation is probable,
Points to consider,
- Price Action corrective
- Daily S/R Support
- Swing High Objective
- Low Volume 200 MA
TRBUSDT’s immediate price action is corrective, trading at a key daily level that has technical confluence with the .618 fibonacci, allowing for a long bias.
The swing high is the immediate objective, exceeding this level increases the probability of a trend continuation.
Current volume profile is below average, an influx is imminent when an expansion occurs.
Overall, in my opinion, TRBUSDT is a valid long with defined risk, price action is to be used upon discretion/ management.
Hope this analysis helps,
Thank you for following my work
And remember,
"The hard work in trading comes in the preparation. The actual process of trading, however, should be effortless."
Jack Schwager – Author of Market Wizards

TRB Buying ZoneTRB is currently struggling on a bearish red trendline. MA has been stabilizing to a steady descending trend. Here's the thing, by the looks of it, it seems to be forming a descending triangle.
This heavily depends on how everything turns out. If BTC can recover its 58k place, it'll be a healthy sign that altcoins need, what I'm most assured of is that when TRB fall to the green support line, it'll be a rejection but I don't know for how strong it'll be

TRBUSDT longRisk warning, disclaimer: the above is a personal market judgment based on published information and historical chart data on Tradingview, all analysis is only subjective. Hope investors consider, I am not responsible for your investment decision. Thank you.
Good luck


TRBUSDTHello to you all. Mars Signals team wishes you high profits at all times.
The price is in an ascending triangle and is trapped in a triangle. We intend to break the triangle and move towards the top targets.
Warning: This is just a suggestion to you and we do not guarantee profits.
Wish you luck!

Short idea for TRBUSDTIF rising wedge formation works, TRB may have a slight pullback and chance for a quick scalp.

Tellor TRB signals in BinanceTellor - decentralize oracle network
Rank #388
Market cap 117 mln
Volume 90 mln
Max supply 1.7mln
TRBBTC - forming a triangle with upward breaking potential
TRBUSDT forming bullish flag
RSI -bullish
No pumping yet
Potential 100$+
Best regards EXCAVO


TRBUSDT CUP AND HANDLE PATTERN TO 100$+
A Cup and Handle being formed for TRB/USDT pair.
Target 100$+
Entered at 48$ and 68$
No Financial Advice

TRB / USDT First time Here's a quick look at TRB 4 hr chart. As we can see, we saw a retest on 65$ level on Fibonacci golden ratio the purple is the minor support level and the yellow is the long term trend line. If we break the triangle(80$) with a good volume we might try to do new ATH to the 92$. If we get rejected by the resistance we might see retest on the triangle support and if support fail we might see retest on 1. And 2. Blue line and if these support level fails we might see fall to 57$ levels. But I'm positive on TRB. Let's see what will happen. We might see a breakout in a few days if we stay above black Support Line with a good volume.
MACD crossed Up its mean bullish
RSI Level is okay as well
This is not financial advice! Just my idea about TRB!
Do your own research.
If do you see a mistake or want to help, you can write in the comments.
It's my first time so take your own risk.
Not investment advice.
My ideas are only helpful and not advice to buy or sell, you are the decision maker.
Thank you!


TRB looks like it's hit the bottom of a dipTRB looks like it's completed an ABC correction wave and is just coming out of it to the upside.