Bullish on $TRB1. We have a market structure shift on H4
2. We have the setup react bullish to the daily breaker at discount
3. We have a clean draw as the OB on the daily chart
4. We have a Buyside wick to purge at 122.0
TRBUSDT trade ideas

TRB 149$ is next , TRB healthy retrace After 100 % Pump TRB 149$ is next , TRB healthy retrace After 100 % Pump with a Juicy retrace to give you an epic entry to DCA from 60 $ ,
you will be paid off if you start accumulate from 6X Area as things will be really wild after 80 $
don't miss this opportunity as charts never lies :)


#TRB/USDT Ready to go up#TRB
The price is moving in a descending channel on the 1-hour frame and sticking to it well
We have a bounce from the lower limit of the descending channel, this support is at 65.90
We have a downtrend, the RSI indicator is about to break, which supports the rise
We have a trend to stabilize above the moving average 100
Entry price 67.20
First target 68.64
Second target 70.00
Third target 71.24

TRB.usd eyes on $72: key barrier to break for next run brewing? TRB is a runner but also dumps after each massive run.
Currently working off a mini spike and a rounded bottom.
Look for a powerful break or break and retest for entries.
$ 70.82-71.43 is the current barrier of interest.
$ 76.66-77.75 is the next resistance above.
$ 62.88-63.95 is the support that must hold.
==================================================
.

#TRB/USDT#TRB
The price is moving in a descending channel on the 1-hour frame upwards and is expected to continue.
We have a trend to stabilize above the moving average 100 again.
We have a downtrend on the RSI indicator that supports the rise by breaking it upwards.
We have a support area at the lower limit of the channel at a price of
62.
Entry price 70.10.
First target 77.23.
Second target 86.91.
Third target 97.86.

#TRB/USDT breaks the Diagonal Trendline in 1-hour TF!#TRB/USDT breaks the Diagonal Trendline in 1-hour TF!
Wait for a successful retest to long $TRB. The local support level is PDL $65.347, and the resistance level is PDH $71.525.
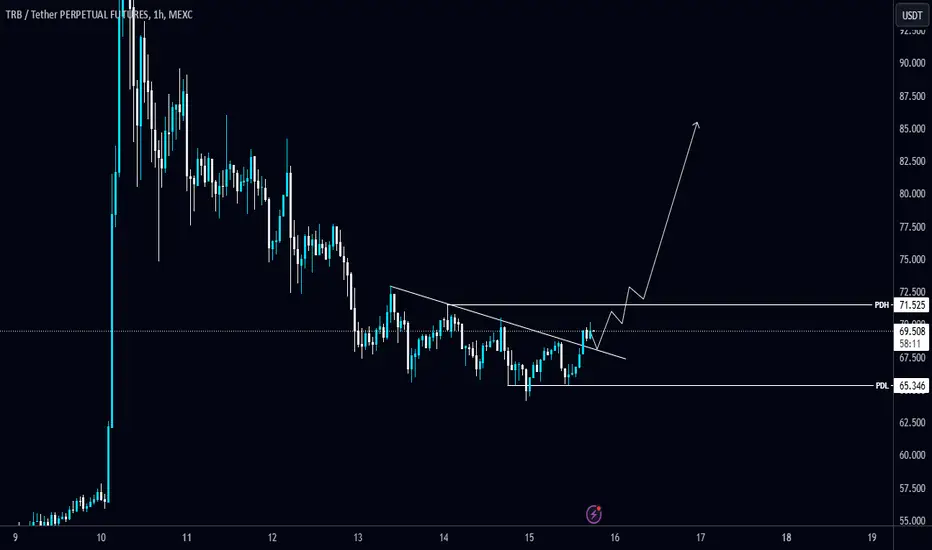
Trb usdt This is a great entry point for the next move, broke out from the pattern now let’s see it play out.

TRB to $100As a context made on this chart, following patterns to be formed to see if it reaches the 100$ mark

TRBUSDT LONGbuy the asset at the levels marked by green lines and take profit at the levels marked by red lines.

#TRB Double Bottom Structure📊#TRB Double Bottom Structure 📈
🧠From a structural perspective, we broke through the neckline, which means that the bullish double bottom structure is established. The ideal target area for this structure is 121.74-146.527. At present, the price has returned to the neckline support area again. You can pay attention to the long trading opportunities in this area.
Let's see 👀
🤜If you like my analysis, please like 💖 and share 💬
💕 Follow me so you don't miss out on any signals and analyze 💯
BITGET:TRBUSDT.P

Tellor | Data Oracle or Price Miracle? The TRB Mystery UnfoldsTellor is a decentralized oracle network designed to support DeFi. It primarily provides high quality, reliable price data by allowing parties to request off chain data, which miners then compete to add to the blockchain. The main Tellor smart contract tracks requested data over time, aiming to serve as a trusted data source for decentralized applications.
TRB token has experienced a substantial price increase recently, with factors linked to its role as a decentralized oracle network driving the demand
The main reasons behind TRB's recent pump are:
Increased Demand for Decentralized Oracles: As TRB serves as the native token for the Tellor network, it allows users to access off-chain data within blockchain ecosystems, especially for DeFi (Decentralized Finance) projects. The growing demand for reliable data oracles in decentralized applications may be boosting TRB's value.
Market Liquidity and Limited Supply: Tellor’s circulating supply remains low, contributing to price sensitivity and making it more susceptible to large price swings. High trading volumes combined with increased buying pressure can lead to rapid price escalations.
Network Utility and Staking: TRB is used within the Tellor network for staking, rewards, and governance. Increased interest in staking TRB for governance rights may also be affecting its market price. Additionally, miners and data providers require TRB to participate and earn rewards, increasing the token's intrinsic demand.
Speculative Investment and Market Sentiment: General market sentiment around TRB has been positive, with investors potentially betting on the project's growth and long-term utility in blockchain ecosystems. Strong market performance in broader crypto and a wave of renewed interest in decentralized projects could be contributing to this surge
Major resistance: breaking 77$ resistance which was a huge warzone for trb bulls
This combination of demand for oracle services, limited supply, utility based staking, and positive market sentiment explains the recent surge in TRB's value
Dont miss this crypto bull market

Tellor Tributes | TRB The price of Tellor Tributes is $25 today with a 24hour trading volume of 100 million dollar. This represents a 42% price increase in the last 24 hours and a 75% price increase in the past 7 days. With a circulating supply of 2.5 Million TRB, Tellor Tributes is valued at a market cap of 65 million dollar.
Tellor is a decentralized oracle protocol.
Oracles are a key part of blockchain infrastructure that update valuable off-chain data, making it available for on-chain smart contracts.Tellor’s oracle supplies data that can be requested, validated and put on-chain permissionlessly with data reporters competing for incentives of TRB. Data reporters bring valuable information on-chain for a wide range of DeFi applications.
TRB bulls successfully broke 19$ and we hit 29$ as well,the volume is good and most indicators are bullish

TRB - Target $ 255 - Double Bottom breakt outTRB looks great! Strong pump and if it's holds strong it can go right to $ 255.

TRB no looking backAfter that back to back Fbuy prints there is no looking back. FBuy is an aggressive buy print where market is on full throttle. I think next stop is 150.
Remember last time TRB went to 400 with our buy prints.
text me for indicator access

TRB coming back to supportTRB price is currently coming back to support.
The 1h shows a flag or descending channel with price consolidating lower and lower.
RSI on 4h is close to 30. If rsi turns around would indicate strong bullish divergence on 4h.
If TRB price loses 49.8 I would assume it would head down to the support at 41.8.
A swing long entry could be around 49.8 with a stop below the support ~37.9.
Pay attention to BTC as we could see a pullback from where price is now down to the 72 or even as far as the 69.xxx level.

TRBUSDTTRB ~ 1W
#TRB Make purchases gradually on this support block. with a short term target of at least 20%++. So far this support block continues to hold the price.

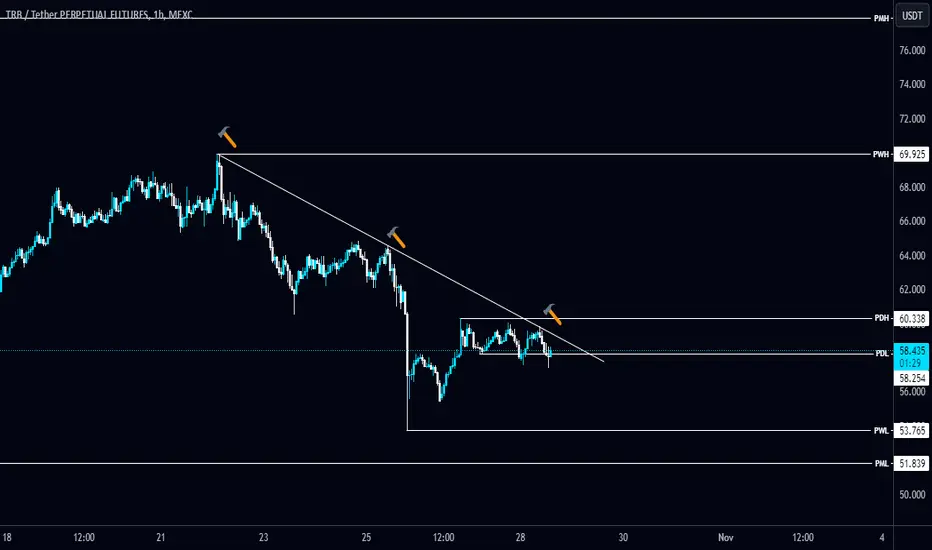
#TRB/USDT is trying to break the Diagonal Trendline in 1-hour TF#TRB/USDT is trying to break the Diagonal Trendline in 1-hour TF!
Wait for the breakout and retest to long it. The local support level is PML $51.840, and the resistance level is PWH $69.925.
TRB/USDT is showing strong bullish potential!🚀 TRB/USDT is showing strong bullish potential! 📈💎
The TRB/USDT pair has recently broken out on smaller time frames and is now undergoing a retest of the breakout zone. This key level is acting as support, and if it holds, we could see a significant upward movement in the coming days. Volume is starting to pick up, indicating growing buying pressure, which could lead to a major breakout toward higher levels. 📊🔥
The trend is currently bullish, with key resistance levels above that could be tested soon. Traders may look for confirmation of the breakout with higher highs and strong volume to signal a continuation of the bullish trend. 🌕🚀
⚠️ This is not financial advice. Always do your own research (DYOR) before making any trading decisions. 🔍

TRB can Start To Increase SoonThe TRB is in a ascending triangle now which means the price will increase and also It is expected that the price would at least grow as good as the measured price movement(AB=CD)
Note: we should wait for the breaking of the triangle and than make a move!
✨We spend hours finding potential opportunities and writing useful ideas, we would be happy if you support us.
Best regards CobraVanguard.💚
_ _ _ _ __ _ _ _ _ _ _ _ _ _ _ _ _ _ _ _ _ _ _ _ _ _ _ _ _ _ _ _
✅Thank you, and for more ideas, hit ❤️Like❤️ and 🌟Follow🌟!
⚠️Things can change...
The markets are always changing and even with all these signals, the market changes tend to be strong and fast!!

TRB bullish ideaWatching TRB for a reaction in this area.
A couple of options.
1. Potential for a long scalp here.
2. For a swing trade, if price comes back to 49.x, potential to ladder in for a swing trade with a stop below the previous low.


#TRB/USDT#TRB
The price is moving in a descending channel on the 12-hour frame and is sticking to it very well and is about to break upwards
We have a bounce from the lower limit of the channel at a price of 54
We have an upward trend on the RSI indicator that is about to break, which supports the rise
We have a trend to stabilize above the moving average 100
Entry price 67.00
First target 85.00
Second target 96.91
Third target 114.70
