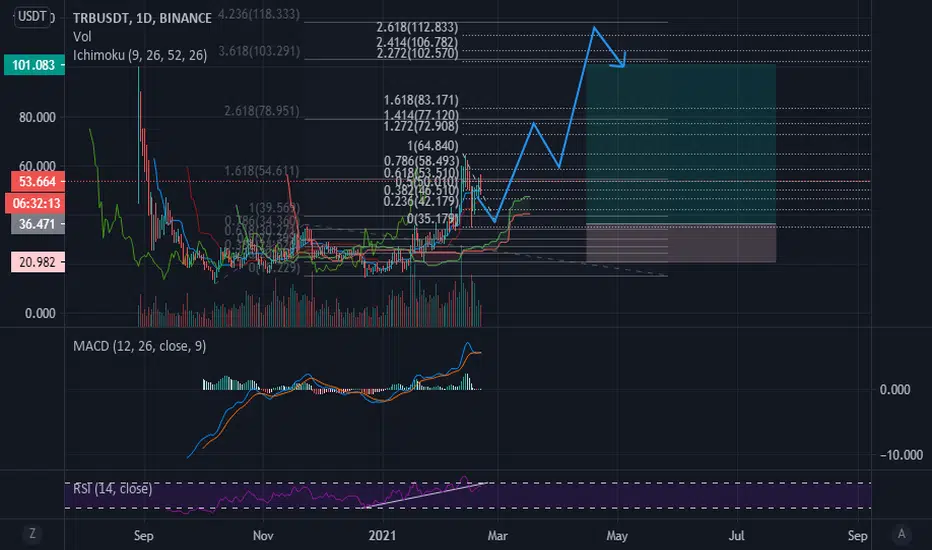
TRBUSDT is testing 0.618 Fibonacci level 🦐TRBUSDT is testing 0.618 Fibonacci level on weekly timeframe. If the price will have a breakout from daily resistance, According to Plancton's strategy (check our Academy), we can set a nice order
–––––
Follow the Shrimp 🦐
Keep in mind.
🟣 Purple structure -> Monthly structure.
🔴 Red structure -> Weekly structure.
🔵 Blue structure -> Daily structure.
🟡 Yellow structure -> 4h structure.
⚫️ Black structure -> <4h structure.
Here is the Plancton0618 technical analysis, please comment below if you have any question.
The ENTRY in the market will be taken only if the condition of the Plancton0618 strategy will trigger.
TRBUSDT trade ideas

What is Next for TRB ?Bull Flag on TRB.
If it falls below the 78.2% we will give up on a trend resumption and consider it a range, as long as it does not retraces more than 75% approx. we can consider it a bull trend in play.
Accumulation Distribution is above its EMA13.
Observe the pink circles, there has been two clear rejections, it shows some kind of exhaustive volume, but bulls bought relentlessly at these levels.
There is a possible if not almost confirmed divergence in MACD (below there is a question mark because the move is not yet finished).
Got some possible targets based on the vertical distance of the last swing. Drew some fib extensions to obtain possible targets.
Got some possible reversal levels (rectangles in green).
Perhaps entering on a limit order at one extreme of the resistance line is a smart move.
Just an OPINION, If it is useful please LIKE and FOLLOW. Best of Best my friend :)


TRBUSDT PERP: why wont you break Well BTC took a dump on us! It has to break through the small zone above or else it stays in the cucked zone for eternity (long enough for me)
Great token with some good fundamentals (I know nothing about) but it needs to pump like all the other Oracles, its about Time TRB, dont do me dirty!

TRBUSDTentry: around 54
TP1: 66
TP2: 79
TP3: 86
TP4: 93.5
TP5: 99
SL: 39.4
Check my website for tutorials, examples and calls :)
cry-pto-surf.com
- My trades are not financial advices
- always use stop-loss
- invest only the amount of money you are ready to lose
- trade with a strict money management method


hi my friendsHello friends, very good pattern of butterflies and abcd waves in the region of resistance. Please like to support me.


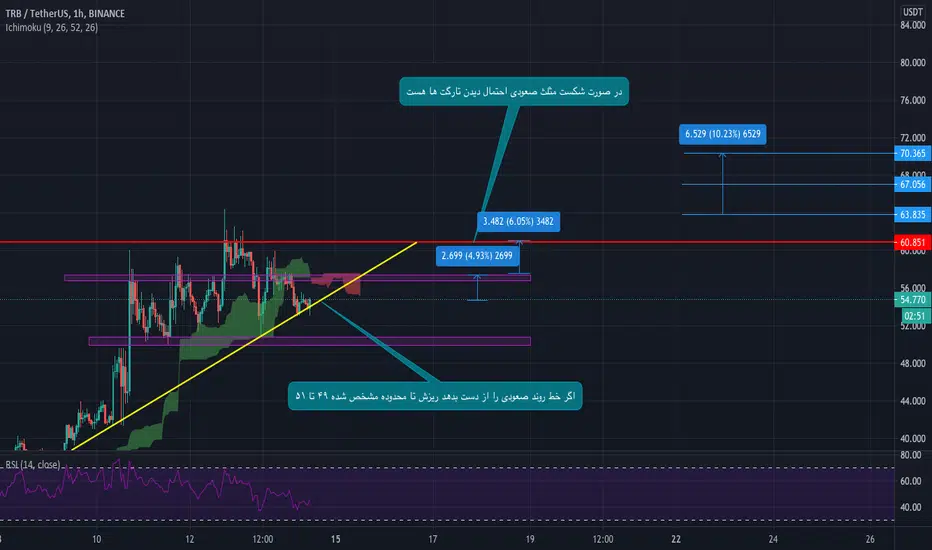
TRB/USDT : Retest on support, Ready for breakoutBINANCE:TRBUSDT
Hello everyone 😃
TRB was trying to break 60$'s resistance.
Now it had a retest on support line !
📌 Also MACD is being Bullish...
It could be a good zone to but TRB after breakout and holds above 60$.
Attention: this isn't financial advice we are just trying to help people on their own vision.
Have a good day!
@Helical_Trades

TRB 1H BUYAlso set some Buy orders near the Trendline
Remember no more than 5% of the deposit in one trade
SL: next sell signal

TRBUSDTSince Alts/Btc Pairs are at risk IMO, I'm trying to find more and more USDT pairs. Among those, #TRB looking Bullish. If btc stays Above 48k, it'll just matter of time when Trb will hit 75$.


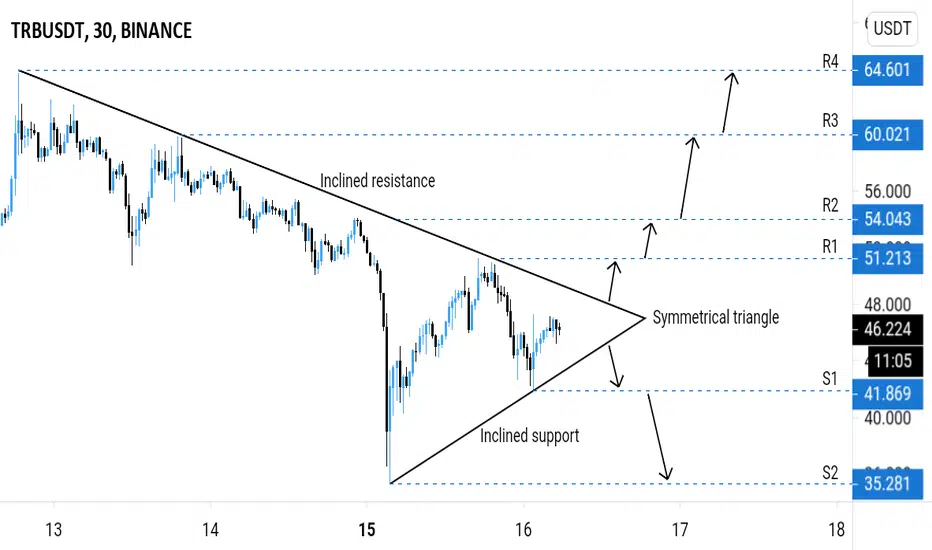
TRBUSDT (TRB) - POSSIBLE PRICE ACTIONS ANALYSIS 🔎
- TRBUSDT is consolidating in a symmetrical triangle pattern .
- A relatively big move is imminent.
POSSIBLE PRICE ACTIONS
- Uptrend ⬆️: breakout above the symmetrical triangle's inclined resistance.
- Downtrend ⬇️: breakdown below the symmetrical triangle's inclined support.
TARGETS 🎯
- Uptrend ⬆️: Horizontal resistance levels (R1, R2, R3, R4).
- Downtrend ⬇️: Horizontal support levels (S1, S2).


My thoughts on TRBUSDT PerpetualJust a simple idea , not much of a pro analyst but its my guess. lets see how it goes


TRB/USDT IF YOU MISSED IT, LAST CALL 🚂Hey hey my friends 👋
If you missed the call the other day here is your chance to board
Buy the break of this line! Very bullish oracle crypto, undervalued 🙊
Going to 80-90 🚀
Enjoy 🍿


