trxusd buytrxusd buy .. buy above the resistance 1 at 0.059200 .. first target resistance 2 .. finally target resistance 3 and 200ma
TRONUSD trade ideas

TRX-USD: possible sellTRX-USD: possible sell. If you see a bearish candle in 4 hr below midline, sell for purple line.

Tron: BearishTron bounced off the upper boundary of descending channel. Bearish movement to support level 0.612 is expected to happen.

TRON (TRX) - January 17Hello?
Welcome, traders.
If you "follow", you can always get new information quickly.
Please also click "Like".
Have a nice day.
-------------------------------------
(TRXUSD 1W Chart)
Above 0.04413840 point: Expected to create a new wave.
If the price is maintained above the volume profile section formed near the 0.04413840 point, it is expected to continue the upward trend in the mid to long term.
However, in order to continue the uptrend, it must break out of the downtrend line.
If it fails to rise above the 0.07500028 point, there is a chance that it will fall near the 0.04413840 point, so trade cautiously.
-------------------------------------
(TRXBTC 1W Chart)
Over the 259 Satoshi-318 Satoshi section: Expected to create a new wave.
------------------------------------------
We recommend that you trade with your average unit price.
This is because, if the price is below your average unit price, whether the price trend is in an upward trend or a downward trend, there is a high possibility that you will not be able to get a big profit due to the psychological burden.
The center of all trading starts with the average unit price at which you start trading.
If you ignore this, you may be trading in the wrong direction.
Therefore, it is important to find a way to lower the average unit price and adjust the proportion of the investment, ultimately allowing the funds corresponding to the profits to be able to regenerate themselves.
------------------------------------------------------------ -------------------------------------------
** All indicators are lagging indicators.
Therefore, it is important to be aware that the indicator moves accordingly with the movement of price and volume.
However, for convenience, we are talking in reverse for the interpretation of the indicator.
** The MRHAB-O and MRHAB-B indicators used in the chart are indicators of our channel that have not been released yet.
(Since it was not disclosed, you can use this chart without any restrictions by sharing this chart and copying and pasting the indicators.)
** The wRSI_SR indicator is an indicator created by adding settings and options to the existing Stochastic RSI indicator.
Therefore, the interpretation is the same as the traditional Stochastic RSI indicator. (K, D line -> R, S line)
** The OBV indicator was re-created by applying a formula to the DepthHouse Trading indicator, an indicator disclosed by oh92. (Thanks for this.)
** Support or resistance is based on the closing price of the 1D chart.
** All descriptions are for reference only and do not guarantee a profit or loss in investment.
(Short-term Stop Loss can be said to be a point where profit and loss can be preserved or additional entry can be made through split trading. It is a short-term investment perspective.)
---------------------------------

trxusd ... after the breaktrxusd two scenarios ... A scenario] buy after the break above the resistance level and 200ma at 0.070862 .. finally target 0.075000 B scenario] sell after the break under the resistance level and 20ma at 0.068622 finally target 0.066300

TRX (TRON) WILL BREAK RECENT LOWTRX (TRON) will break recent low and after that where it can go this is confusing for now because i can see 2 alt count.
DISCLOSURE - Please be informed that the information I provide is not a trading recommendation or investment advice. All of my work is for educational purposes only. All labeling and wave count have been done by me manually and I will keep changing according to the LIVE MARKET PRICE ACTION. So don't bias, hope on my trade plans. Try to learn Elliott Wave or other strategies and make your own strategy. Following is not that much easy. I am not responsible for any losses if u took the trade according to my trade plans.
#TRX #TRON

Tron TRXUSDT - 2020 Wedge + Breaking down on the weekly chart- The current situation for TRX on the weekly timeframe is not looking good right now.
- The price is now below the main trendline established in March 2020.
- Also we are breaking down from the ascending broadening wedge.

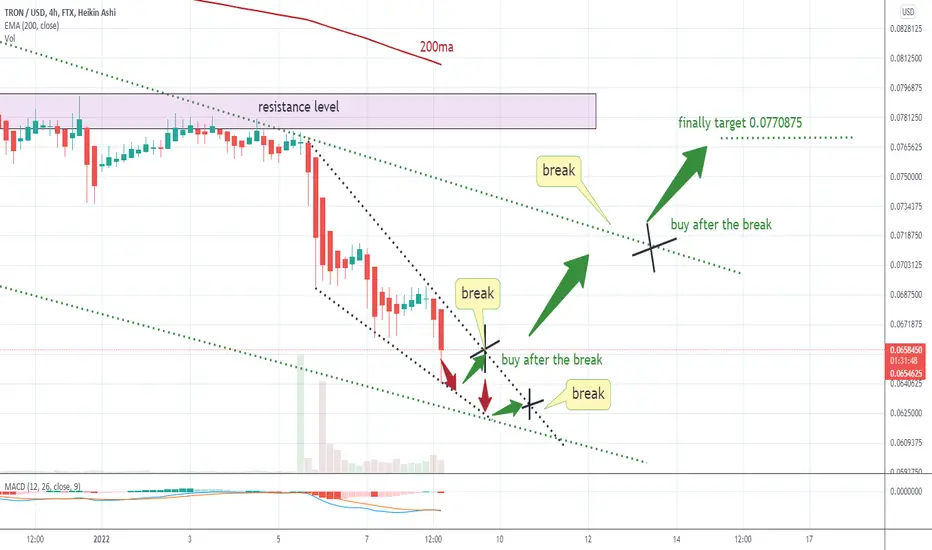
trxusd buytrxusd buy .. buy after the break .. finally target above 200ma and the resistance level at 0.0770875
TRON must breakout of this symmetrical triangle soonTRON tested the low end of the big symmetrical triangle in this weekly chart.
There are 2 supports to buy for very good risk to reward ratio….ma100 at around 0.0624 & ma200 at around 0.045 which is also a double bottom of a big descending triangle.
Bullish scenario will be for TRON to bounce off ma100 & beakout the triangle somewhere around
0.085.
Happy New Year & Happy Trading!
This is only my analysis. Pls practice due diligence.

TRX 1H shortSetup: As BTC is having no signs of reversal currently, it is time to take advantage of this window and short some coins. TRX is one of them. TRX is bearish on 1h, 4h and daily timeframe, increasing the probability of success for this trade. It also breakdown from its daily support.
Entry: We will wait for a macd to cross up and then cross down again before we enter the trade. This will be ideally the 1 h 20 EMA
SL: We will trail using 1 ATR above the 50 EMA
TP: The next daily support at 0.0563975

Trx future movement strong breakoutAn idea about trx movement to bullish breakout. it will soon breakout to a huge bullish movement watch it

TRXUSD - Dailycompleted a diametric and now can go upper in a triangle
I think Tron has a bright future !!

TRON - TRX - Double bottom - Position - Long-termA double bottom is formed following a single rounding bottom pattern which can also be the first sign of a potential reversal. Rounding bottom patterns will typically occur at the end of an extended bearish trend. The double bottom formation constructed from two consecutive rounding bottoms can also infer that investors are following the security to capitalize on its last push lower toward a support level. A double bottom will typically indicate a bullish reversal which provides an opportunity for investors to obtain profits from a bullish rally. After a double bottom, common trading strategies include long positions that will profit from a rising security price.
$TRON $TRX


TRX - My Trading Plan in 3 mins!Hello everyone, if you like the idea, do not forget to support with a like and follow.
Here is the top-down analysis for TRX, feel free to request any pair/instrument or ask any questions in the comment section below.
Best of luck!

TRXUSD D1: 200% gains XABCD BEST LEVEL TO BUY(SL/TP)(NEW)Why get subbed to me on Tradingview?
-TOP author on TradingView
-2000+ ideas published
-15+ years experience in markets
-Professional chart break downs
-Supply/Demand Zones
-TD9 counts / combo review
-Key S/R levels
-No junk on my charts
-Frequent updates
-Covering FX/crypto/US stocks
-before/after analysis
-24/7 uptime so constant updates
🎁Please hit the like button and
🎁Leave a comment to support our team!
TRXUSD D1: 200% gains XABCD BEST LEVEL TO BUY(SL/TP)(NEW)
IMPORTANT NOTE: speculative setup. do your own
due dill. use STOP LOSS. don't overleverage.
🔸 Summary and potential trade setup
::: TRXUSD 1days/candle chart review
::: updated/revised outlook
::: still great setup for 200% gains
::: speculative XABCD setup in progress
::: BULLS get ready to BUY LOW point C
::: from my level TP +200% gains
::: this is BUY/HOLD setup
::: patient traders only
::: not for gamblers
::: SPECULATIVE SETUP
::: do your own due dill
::: and use proper risk management
::: TP bulls is +200% gains 0.2 USD
::: details: see chart
::: FINAL TP +200% gains point D
::: recommended strategy: BUY/HOLD
::: SWING TRADE: BUY/HOLD IT
::: bull run not over yet
::: good luck traders!
::: BUY/HOLD and get paid. period.
🔸 Supply/Demand Zones
::: N/A
::: N/A
🔸 Other noteworthy technicals/fundies
::: TD9 /Combo update: N/A
::: Sentiment mid-term: BULLS/PUMP/point D
::: Sentiment short-term: BEARS/PULLBACK/point C
RISK DISCLAIMER:
Trading Crypto, Futures , Forex, CFDs and Stocks involves a risk of loss.
Please consider carefully if such trading is appropriate for you.
Past performance is not indicative of future results.
Always limit your leverage and use tight stop loss.

TRXUSD -$ 0.7 - $1.1 if we have a New Year RallyHi, iJustCoiners!
I am here to post a pretty much SPECULATIVE idea regarding future TRX price .
I already did that once on LINK and it appears that my prediction has nothing to do with what really happend.
So i am quite sceptical on that one too. However it's an interesting study.
Looking at the White Energy at the 8D timeframe i assume that we will have a reversal to the upside around Mid January.
That's quite common for crypto to have a run up right at the begining of the year.
Using Fibonacci and Pithcfork i projected possible price range TRX may touch.
If we have a New Year Rally and if it sustains the price would touch Red Rectangle i pointed on the chart.
I placed it right between pitchfork historical resistance.
If we do touch the rectangle we may reach $0.75 - $1.11
We as well may go higher if we OEVEREXTEND to the yellow/red pithfork diagonals.
That way TRX may reach $3.5 - $6.1 levels
I am already anxious to take a look at this publication at the March 2022.
Till thats moment i'll be making trades, fixing profits, investing, staying calm. The opportunity is always here.
And remember this market doesn't respect doubters!

tron is bullishi think TRX will touch these targets soon
I will sell at last target/lets see what will be happen

Trx future movement strong breakoutAn idea about trx movement to bullish breakout. it will soon breakout to a huge bullish movement watch it

Tron trxusdt ready to dump! 🌩️Hello Traders,
BINANCE:TRXUSDT is on support and probably will break it.
Targets on the chart.
Ba careful.
Tron Price Analysis — December 17TRX maintained a bearish trajectory on Friday, as the price nears its last week’s low of $0.0790. The bearish sentiment comes amid a persistent marketwide sell-off that has plagued the industry for several weeks. Bearish trading volume on TRX remains on the high side, indicating that we could see a bearish break below my descending tripwire. While significantly unlikely, a defense of the $0.0800 line by bulls over the coming hours could stall the bearish momentum allowing bulls enough time to reassemble and push for the $0.0900 mark.
Meanwhile, our resistance levels are $0.0850, $0.0900, and $0.0950, and our support levels are $0.0780, $0.0760, and $0.0740.
Total Market Capitalization: $2.15 trillion
Tron Market Capitalization: $8.21 billion
Tron Dominance: 0.38%
Market Rank: #24

Tron TRC20 May get a sharp Up waveNext Up wave prediction on Tron Network.
You may see my previous down wave prediction
of this coin from my Tradingview profile.
Now you might make money with me too.

MULTI YEAR CUP AND HANDLE! Breakout Coming TARGET $3+ HOLD ON!Tron and many other older cryptos are in this massive multi year cup and handle. TRON looks like it will hit around $3 or more on this run before correcting and consolidating. This is a good possible buy in opportunity at these levels. Good luck and happy trading.
This is not financial or trading advice just my opinion. If you like my ideas then give me a like and a comment and follow me for more frequent updates. Also if you have a chart you would like me to look at then let me know. Thank you.
