OFFICIAL TRUMP Last Barrier · $30 or $100 Next · MixedThe last barrier is on now. The last barrier as in the last and final resistance level TRUMPUSDT (OFFICIAL TRUMP) needs to conquer before a major rise. Will this rise reach $30 or $100 or higher? Continue reading below.
Make sure to boost this publication and follow to show your support.
Hah! Resistance is confirmed as EMA89, what a drag. This is the blue dotted line on the chart but notice something else. Look at the magenta line, EMA55. TRUMPUSDT is trading above EMA55 but below EMA89. Bullish and bearish. Bearish and bullish. Mixed?
There is nothing mixed.
The main low happened 7-April. A higher low in 22-June. Can you see?
This is not mixed, this is bullish confirmed.
If the market were to move lower, then in 22-June we would have either a test of the 7-April low or a lower low. The fact that the drop stopped higher means that buyers were present. People were actually expecting for prices to drop and once they dropped they bought everything that was being sold. Prices couldn't move any lower because people were buying up. These are smart trader, smart money; experience for sure.
They managed to buy some tokens at a lower price within the "opportunity buy zone." This zone is available no more and now we have the mix of resistance and support; EMA89 and EMA55. What happens next?
Based on the previous signal I just showed you and marketwide action, Bitcoin super strong, we know that TRUMPUSDT will follow and break-up. Yes! Massive growth.
Both targets are good and will hit. Short-term, we will see a challenge of $30 and long-term we will see $100 and beyond.
Thanks a lot for your continued support.
Namaste.
TRUMPUSDT trade ideas

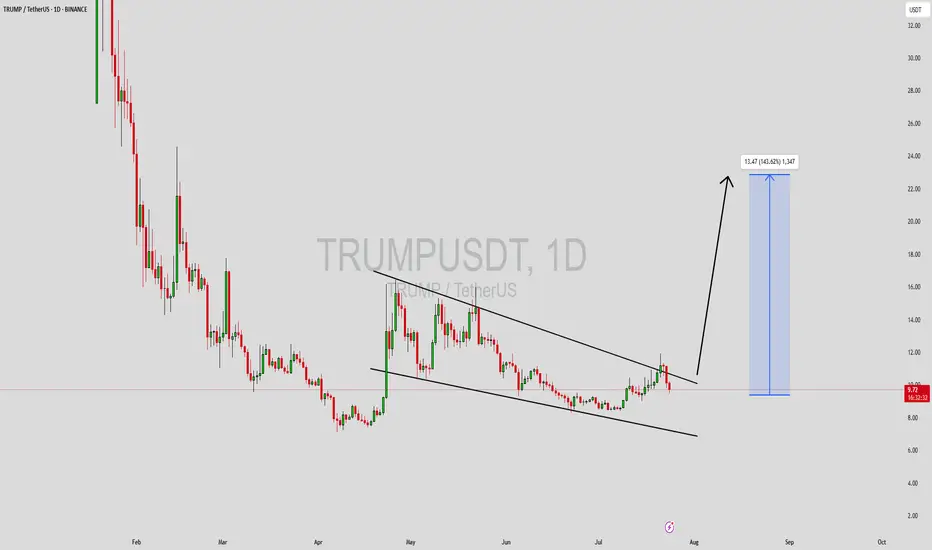
TRUMPUSDT Forming Falling WedgeTRUMPUSDT is currently forming a well-defined falling wedge pattern—a bullish reversal structure that often leads to significant upside breakouts. The price has been consolidating within narrowing trendlines and now appears to be approaching a breakout point. Historically, falling wedge patterns in the crypto market have led to aggressive rallies, especially when combined with rising volume and strong community sentiment. With good volume backing this setup, a breakout could trigger a sharp move to the upside, projecting an expected gain of 90% to 100%+ in the coming sessions.
Investor interest in the TRUMPUSDT project has been steadily increasing, likely fueled by the coin’s strong branding and community-driven momentum. Meme-based and politically themed tokens have seen explosive growth in recent bull cycles, and TRUMPUSDT may be positioning itself to capitalize on similar attention. With sentiment aligning positively and technicals flashing bullish signals, the coin is attracting both short-term swing traders and long-term speculative holders.
If TRUMPUSDT confirms a breakout above the upper wedge resistance with volume confirmation, we could see rapid price expansion. Traders should monitor key levels and consider re-entry on retests or strong bullish candles. The momentum shift is already becoming apparent, and this coin could turn into a trending asset in the meme-token segment very soon.
Keep this setup on your radar as it may provide high-reward opportunities. Monitor community updates, upcoming events, and broader meme coin momentum across the market for additional confirmation.
✅ Show your support by hitting the like button and
✅ Leaving a comment below! (What is You opinion about this Coin)
Your feedback and engagement keep me inspired to share more insightful market analysis with you!
TRUMPUSDT: Massive Reversal Incoming? Reaccumulation Zone!
📉 Current Market Outlook:
TRUMPUSDT is currently positioned at a highly strategic technical level. After an extended downtrend since February—dropping from the 60 USDT region to a low of around 7.13 USDT—price has now stabilized and entered a strong reaccumulation zone between 8.50 and 10.20 USDT.
This zone has acted as a reliable support range and shows signs of smart money accumulation, as evidenced by volume spikes and strong price reactions off this base.
---
🧠 Technical Pattern & Structure:
🔸 Base Accumulation / Reaccumulation Rectangle
Price has been consolidating in a tight horizontal range, forming a classic reaccumulation pattern, often seen before major breakouts.
🔸 False Breakdown – Bull Trap Reversal Setup
The brief dip below 8.50 USDT (to 7.13) followed by a strong recovery suggests a potential “shakeout” phase to remove weak hands before a rally.
🔸 First Higher Low Formation
Recent price action has formed a higher low, a key structural signal of a potential trend reversal from bearish to bullish.
---
🟢 Bullish Scenario (Primary):
If price continues to hold above the reaccumulation zone and breaks above 12.48 USDT with strong volume:
Short-Term Targets:
🔹 15.11 USDT
🔹 17.11 USDT
Mid-to-Long Term Targets (if bullish momentum sustains):
🔸 21.59 – 27.96 USDT
🔸 Ultimate target: 46.65 USDT (retest of previous major supply zone)
📈 Potential upside: Over 200% from current levels
---
🔴 Bearish Scenario (Alternative):
If the price fails to hold above the demand zone (drops below 10.00 USDT):
Possible retest of key supports:
🔹 8.50 USDT
🔹 7.13 USDT (major swing low)
⚠️ A confirmed breakdown could signal a continuation of the macro downtrend.
---
🔍 Key Levels to Watch:
Price Level Type Notes
7.13 USDT Major Support Previous swing low
8.50–10.20 USDT Demand Zone Reaccumulation / strong buyer interest
11.25 – 12.48 USDT Key Resistance Breakout trigger zone
15.11 – 17.11 USDT Minor Resistance First bullish targets
21.59 – 27.96 USDT Extension Targets Bullish breakout continuation
46.65 USDT Major Supply Historical resistance zone
---
🧠 Conclusion:
TRUMPUSDT is showing early signs of a macro reversal, with clear accumulation structure and breakout potential forming above a well-defined base. If confirmed by volume and price structure, the upside could be significant.
However, traders should remain cautious and watch for volume confirmation and failure points around key support.
#TRUMPUSDT #CryptoBreakout #AltcoinSetup #BullishReversal #TechnicalAnalysis #ReaccumulationZone #SmartMoneyMoves #PriceActionCrypto #AltcoinAnalysis#CryptoSignals #AltseasonReady

TRUMP Looks Bullish (1D)It seems that the bullish phase of the Trump coin has started from the point where we placed the green arrow on the chart.
We appear to be at the end of wave B of the bullish phase. As long as the price holds above the green zone, it can potentially move toward the targets marked on the chart.
A daily candle closing below the invalidation level would invalidate this analysis.
For risk management, please don't forget stop loss and capital management
Comment if you have any questions
Thank You

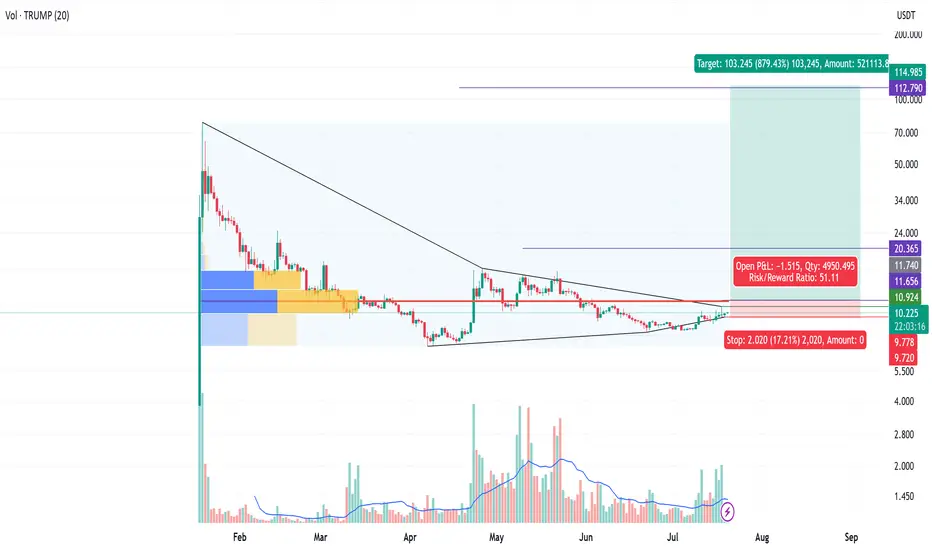
TRUMP - Tight Squeeze Huge R/R 50+, a bit of a wild card as in the pattern maybe still forming and developing. It appears to be bottomed, with supporting OBV (buying volume rising). I will take a 2x leverage on this one.
Entry - 10.924
Stop - 9.778
Interval 1 - 11.7
Interval 2 - 20.36
Target - 112.79
TRUMP IS PUMPING!!!Hello friends🙌
📈Given that the price has reached its bottom and buyers support it, you can buy at 3 specified points with capital and risk management and move with it to the specified targets.
🔥Follow us for more signals🔥
*Trade safely with us*

TRUMPUSDT – Explosion Loading...TRUMPUSDT is showing strong confluence between Elliott Wave and Gann techniques, suggesting a potential breakout phase is underway. The WXY corrective structure has matured, and price is unfolding impulsively with textbook internal wave symmetry.
This setup is not just technical—it's mathematical precision in motion.

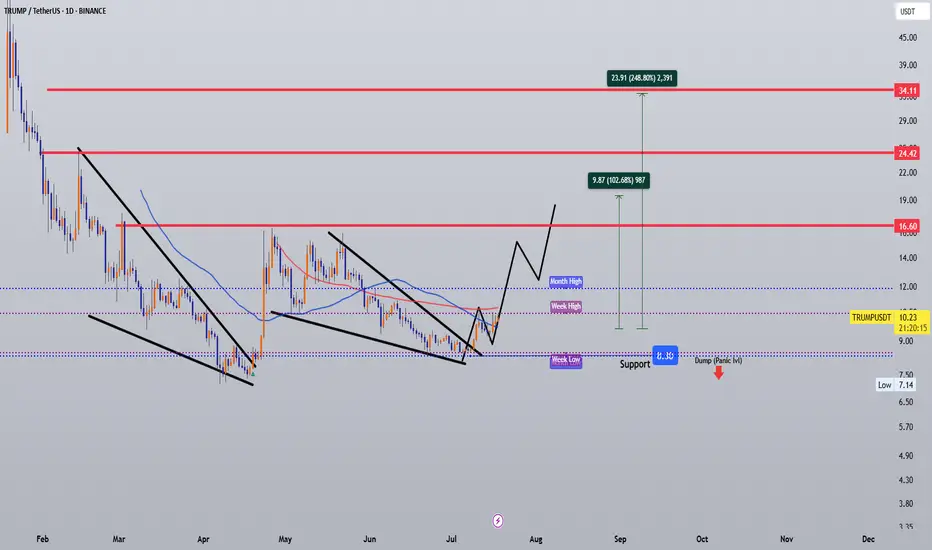
July 2025 - 100% Trump token move to $18 before October"Trump token, it's gonna be huge, believe me. We're talking about a tremendous move, a total win, unlike anything you've ever seen. The fake news, they won't tell you but this token it's exploding. It's happening folks everyone knows it, everyone is talking about it."
Alright, enough of that...
On the above 1 day chart price action has corrected 45% since the month of April. The chart now displays a compelling technical setup for a 100% move to $18.
Bullish Arguments:
Support and resistance
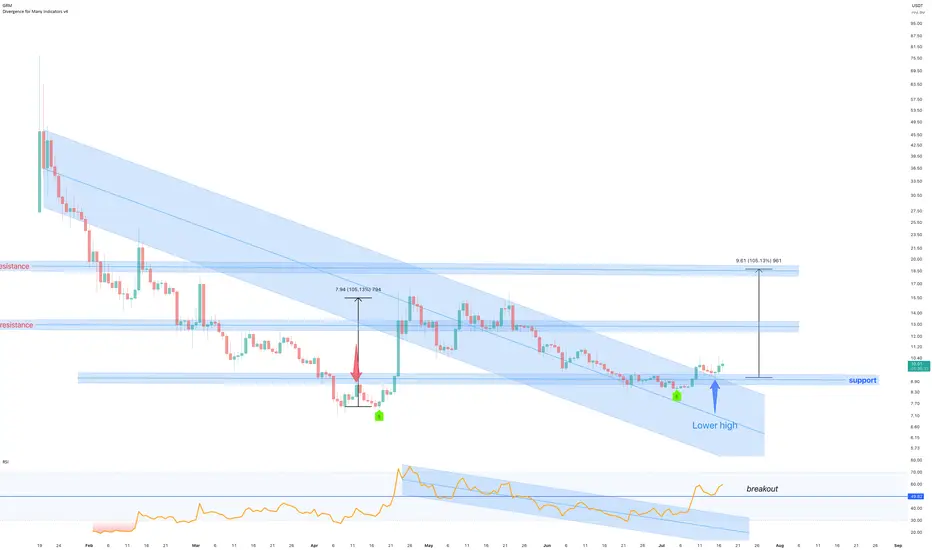
Price action and Relative Strength Index (RSI) breakout from downtrend resistance. Price action also confirms support on past resistance (red / blue arrows).
The trend
A higher low print is confirmed with the downtrend resistance breakout. The RSI also mirrors this trend reversal with a higher low print.
Divergence
Look left. Five oscillators now print positive divergence with price action.
Conclusions
The downtrend clearly now shows signs of reversal. The next two resistance levels are shown, beyond that is unknown until the upper resistance confirms support. Not expected to occur in this market cycle.
Is it possible price action continues to print lower highs? Sure.
Is it probable? No.
Ww
TRUMP UPDATEHello friends🙌
👀You can see that the price formed a reversal pattern after falling at the specified support and the buyers supported it.
⚠Considering the entry of buyers, the price is expected to move to the specified targets, of course, don't forget about capital and risk management.
🔥Follow us for more signals🔥
*Trade safely with us*

OFFICIAL TRUMP Main trend. 16 05 2025Logarithm. Time frame 3 days. After a super pump and a drive of "stupid money", a descending channel was formed on a natural dump. The price came out of it. Now a triangle is forming. The price is clamped. The reversal zones and percentages to the key support/resistance levels are shown extremely accurately according to TA.
If there is no aggressive exit in the medium term, then there will be consolidation and, as a consequence, the formation of a horizontal channel "sholtai / chattai", its key zones are shown.
Now, this "cryptocurrency" is now on 16 05 2025 in 41st place by capitalization.
Reductions from the price highs are about -90%.
From the liquid zone about -84%.
These are not the minimum values of the decline of such hype cryptocurrencies. Just take this into account in your money management. For clarity, the level zones and the % of potential decline if the trend breaks again are shown on the chart (pull the chart down).
Even with such a decline, the price is now at a huge profit. I am not speaking for the creators of the cryptocurrency, but for the first speculators and "investors" who may not have sold everything on the hype.
For the creators of the cryptocurrency, perhaps these are manipulators close to the Trump family, for them, any sale is super profit. But in order to sell, you need to maintain liquidity, and from time to time make interest in speculation and asset retention by investors, that is, do pumps and hype. Use this, and do not be greedy...
Levels and zones, pump/dump, which the price will "feel" are shown in advance. Click "play" on the chart and move the chart up. With a high degree of probability, the hype and pumping of the price of this cryptocurrency will be repeated, given the hype and the long term of the political figure whose name this cryptocurrency bears. Now it is a Trump dump, in the future it will become a Trump pump for some time.
Do not forget to sell on the next hype. If you understand that you are very greedy, and the news background affects you, then sell in parts, or use stop losses to protect profits.
There is no need to guess the minimums and maximums. It is important to know these zones, and have an acceptable average price, from the position of the trend, and its potential. It is regulated by the distributed entry volume (in advance) at potential reversal zones.

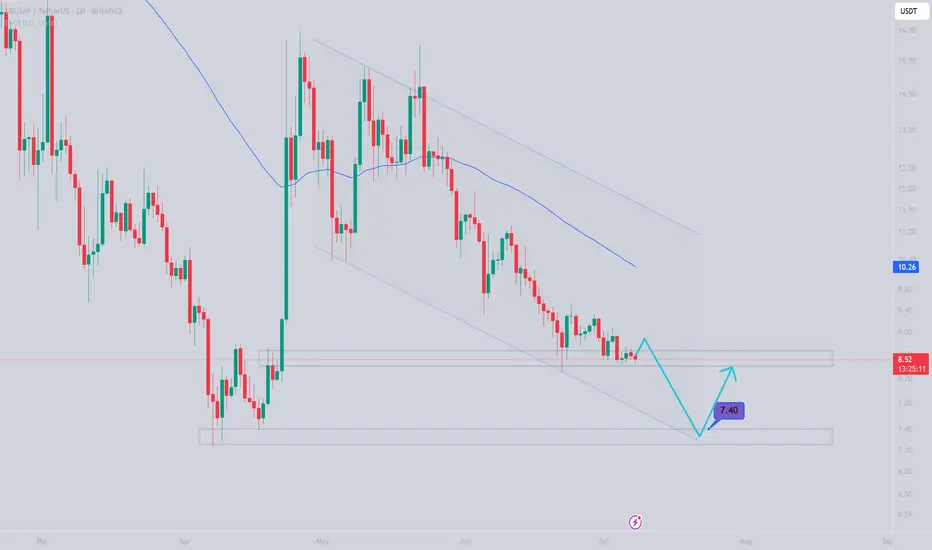
OFFICIAL TRUMP Trading Within Opportunity Buy Zone—About To ExitThis is the last chance to get OFFICIAL TRUMP (TRUMPUSDT) within the opportunity buy zone, the best possible entry prices before a major bullish wave.
Good morning my fellow Cryptocurrency trader, this market has endless opportunities to offer. There is always a second chance; it is never too late.
This "Opportunity Buy Zone" has been available only once briefly before the current period. The first three weeks of April. The second entry into the opportunity buy zone within a higher low happened in June and has been active for 41 days. Time is running out.
Since 11-March, when the current zone was activated through present day, we have more than four months. That's four months of consolidation, sideways... The market can remain neutral only for so long, and it isn't bearish anymore.
The downtrend ended with the 7-April low, the big red falling wedge. After this date the market started a recovery and then we have a retrace—the small falling wedge—and within this retrace market conditions remain bullish based on a higher low.
The main low and market bottom happened 7-April 2025 and the higher low 22-June 2025. This means we are already on the bullish train.
The higher low will lead to a higher high which simply means higher prices. Let's skip the technical analysis and move to the good part.
Maximum growth
How do you see the market right now? How do you see TRUMPUSDT?
It is not going to be the same forever actually, we are expecting big change.
All those days going sideways, down, boring, the market retrace; when it changes it will be so much different. Imagine, visualize, 100%+ in a single day. Then repeat this process over and over. Still some swings and corrections, but that is how you get to 1,000%+ or even 2,000% growth in 30 days.
The meat of the bullish move can happen within 1-2 months. It can also take 4-6 months. What happens is that the start date is not the date when prices start to rise fast but the date the market hit bottom. This means that we are already three months in (100 days) into this bullish wave. Why? Because the low happened 7-April. When you get a strong bullish breakout and the market peaks after two months, total duration of the bullish cycle wouldn't be two months but five months.
We are already on the other side. Now that the next low is in, TRUMPUSDT will be moving to produce a higher high.
Patience is key. The best is yet to come.
Hold strong; rest easy... You will be happy with the results.
Namaste.

Trump 4hr time frame bullish cup and handleactivated cup and handle pattern with targets: 11, 11.7 and 12.7
invalidation: a close below 9.6

#TRUMPUSDT About to PUMP! 📌 Coin: TRUMP (MAGA Coin)
💰 Buy Levels:
✅ First Entry: $10.25
✅ Second Entry: $9.25
🧠 Fundamental Analysis (FA) – In Short
*️⃣ Sector: Meme Coin / Political Narrative
*️⃣ Use Case: TRUMP (often listed as MAGA) is a politically-themed meme coin that gained traction by aligning with Donald Trump’s 2024 campaign momentum.
*️⃣ Tech: Runs as a standard ERC-20 token — no special tech layer, but thrives on narrative, attention, and symbolic value.
*️⃣ Narrative Fit: Built on the intersection of politics, crypto, and meme culture. It’s more of a sentiment play than a utility coin.
*️⃣ Community: Backed by meme traders, political crypto users, and speculators tied to the U.S. election cycle.
*️⃣ Speculation Angle: Price action closely tied to Donald Trump’s public performance (polling, election debates, legal news). Speculators treat it as a bet on narrative dominance.
*️⃣ Uniqueness: Unlike other meme coins, TRUMP has explicit real-world symbolism and has even been linked to NFT collections and donation rumors, fueling spikes.
🎯 Bull Market Target (Realistic)
Target Range: $18 – $25
*️⃣ Based on previous meme coin performance and election-season news surges.
🚀 Mega Bullish Target (Speculative Top)
Target Range: $45 – $75+
*️⃣ Requires viral meme season + Trump leading the election narrative, combined with broader meme coin mania (similar to DOGE/PEPE-style runs).
✅ Final Take
🧠 TRUMP is not a tech play — it’s a cultural sentiment token. It can deliver explosive gains in short timeframes, but risk is narrative-based and high.
we ask Allah reconcile and repay
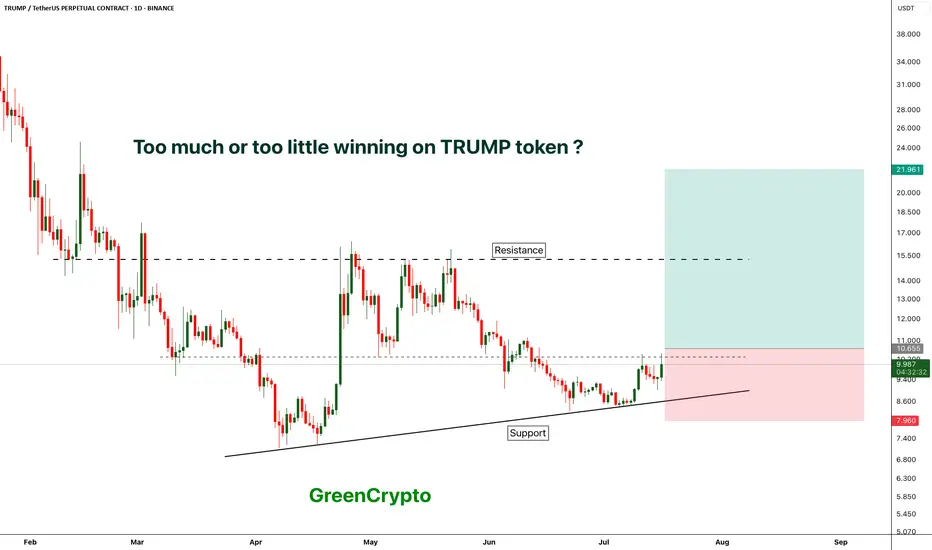
TRUMP - TOO MUCH WINNING ?Trump token is finally seeing some greens after hitting the bottom
currently price is trading near the local resistance.
We have long trade opportunity if the candle closes above local resistance.
Entry Price: Above 10.655
Stop Loss: 7.9
TP1:12.592
TP2: 15.218
TP3: 21.843
TP4++: Keep 20% of the position running with trailing stoploss.
Max Leverage: 5x
Don't forget to keep stoploss
Cheers
GreenCrypto
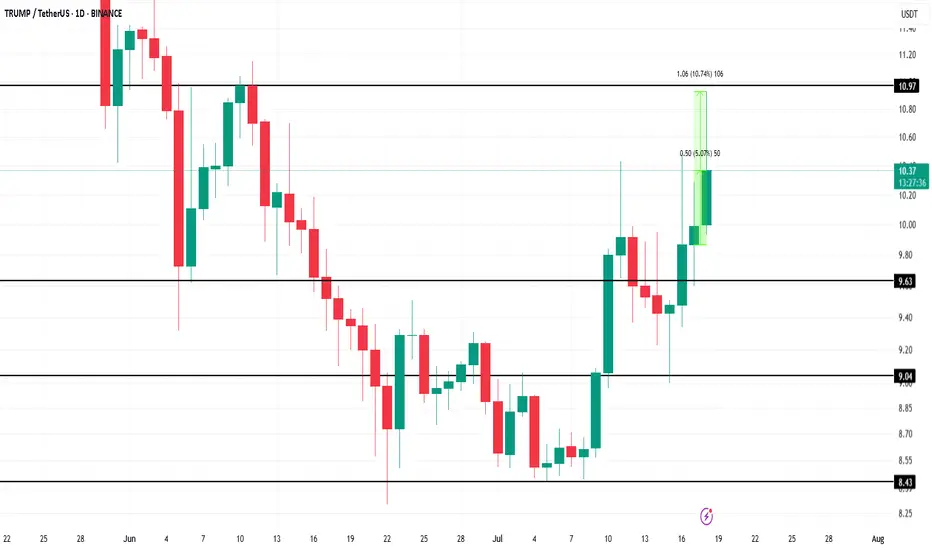
TRUMP Token's $950 Million Unlock Sparks Short-Lived Price RallyBINANCE:TRUMPUSDT recently saw its first major token unlock in six months, which flooded the market with fresh supply. The 90 million TRUMP tokens unlocked today are much smaller than the previous unlock in January, yet they still increased liquidity significantly.
However, the lack of response to the unlock, despite the substantial capital entering the market, further indicates a cooling of investor enthusiasm around the meme coin
BINANCE:TRUMPUSDT price rose by 5% today, trading at $10.39 at the time of writing. It briefly surged by 10% during the intraday high , but the rally was short-lived, and the price retraced.
If BINANCE:TRUMPUSDT fails to breach the $10.97 resistance level again, the coin could face potential corrections to $9.63 , making recovery difficult. The token will need strong demand to push past this resistance and secure more gains.
However, should BINANCE:TRUMPUSDT capitalize on broader market bullish momentum, it could break past $10.97 and reach $11.00 . This would likely invalidate the current bearish outlook and provide an opportunity for a further rise to $12.18.
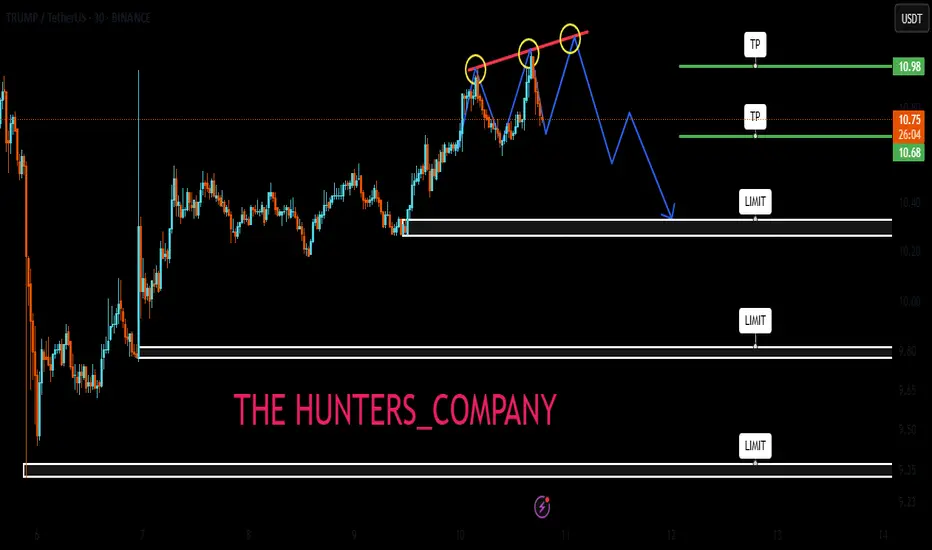
TRUMP Held the Retest — Now Pushing Into Resistance AgainTRUMP bounced clean off the retest zone after holding structure at $9.80.
Now it’s knocking on the same resistance that sparked a sharp pullback just days ago.
If buyers want a real breakout, this is where they’ve got to show up loud.
Risk is rising, but so is the setup.
#TRUMPUSDT #MemecoinCharts #BreakoutRetest #CryptoMomentum #ChartAnalysis #BacktestEverything #QuantTradingPro #TradingView

trumpusdt.1h= Trumpusdt pair analysis
= The strongest scenario is a rebound upwards
= The analysis is based on trend analysis, support, and resistance, and is on the hourly timefram

Trump's signalHello friends🙌
🔊Given the good growth we had, you can see that the price has hit resistance and you can see that the upward waves are getting weaker, which indicates that we are likely to have a correction until the support areas are identified...
You can buy in the identified support areas in steps and with capital management and move with it to the specified targets.
🔥Join us for more signals🔥
*Trade safely with us*
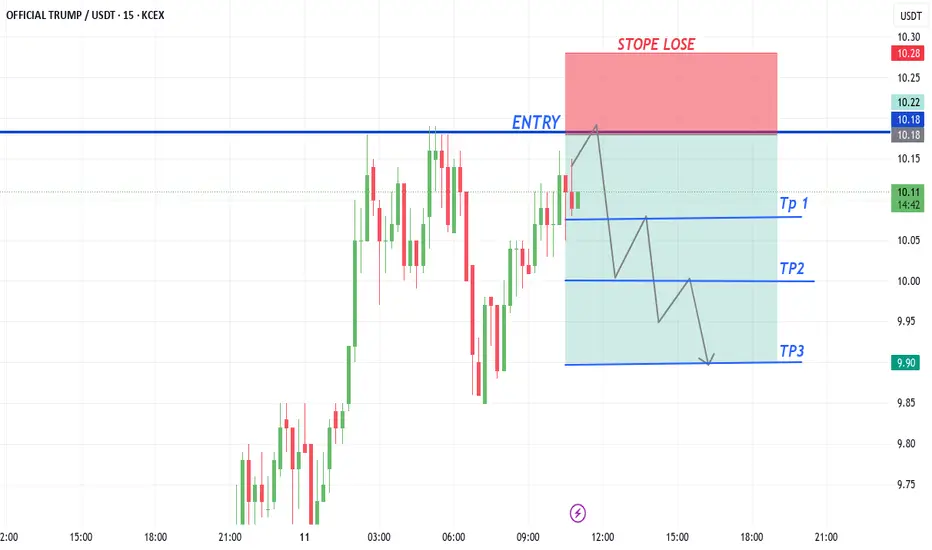
TRUMP COINtrump sell from 10.18
tp1 10.11
tp2 10.00
tp2 09.90
Stope Lose 10.28
Trade at your own risk
TRUMP/USDT Eyeing a Breakout – Key Levels Ahead!Trump is currently trading just below the resistance zone.
If we see a daily candle close above this key area, it could trigger a move toward the red trendline, and possibly even into the major resistance zone above.
Eyes on the breakout!
DYOR, NFA

TRUMP BUY ???Hello friends🙌
🔊As you can see in the picture, we have brought you two Trump charts:
1_TRUMP/USDT, in which we see an upward trend.
2_TRUMP/BTC, in which we see a downward trend.
✔Now what is the conclusion? When this negative divergence occurs, it means that money flows from Bit to Tether, and we can expect good growth from it to the specified targets, given the price reaching important support and its return📈
🔥Join us for more signals🔥
Trade safely with us.

TRUMPUSDT looks very bullishhi traders,
🧠 Chart Overview
Asset: TRUMPUSDT
Timeframe: Daily
🔍 Technical Analysis
Price Structure: We can see a double bottom or rounded bottom formation, suggesting a potential trend reversal from bearish to bullish.
RSI Indicator: The RSI has broken out of its long-term downtrend, which is a key early bullish signal. It has also crossed above its moving average, hinting at growing momentum.
Confirmation: The price has confirmed a bottom around the $7–$8 range, with multiple tests of support and a slight upward curve forming.
💡 Trading Setup
Entry: It is still early to enter a long position at the current levels (9$)
Target: The upside target is the major resistance at $15.70, aligning with the previous high marked by the red horizontal line.
Stop Loss: The stop loss is placed below the recent lows, around the $8.12 level, ensuring protection if the bottom doesn't hold.
⚠️ Notes
Entering now is aggressive and speculative, but early positioning can offer higher R:R.
Conservative traders might wait for a confirmed breakout above $10 before entering.
Volume confirmation would strengthen this setup further.
This is a classic early-reversal setup — worth watching closely!

TRUMPUSDTGiven the deep correction and the expectation of a deeper correction and the lack of good demand from the breakeven range,
we expect further declines to the specified range.
With due risk management, it would be reasonable to enter around this area.