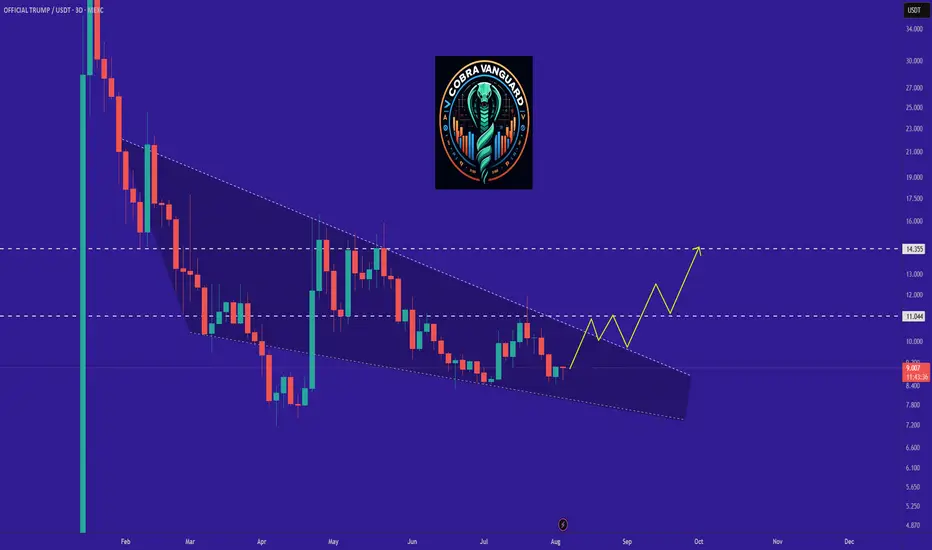
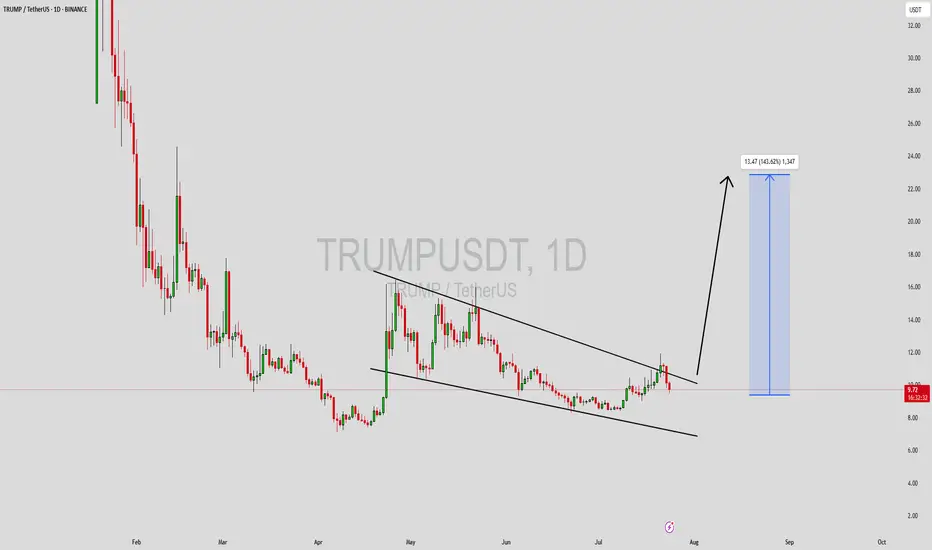
TRUMP is bullish now and many Traders don't see it !!So if you pay attention to the TRUMP chart you can see that the price has formed a Ascending wedge which means it is expected to price move as equal as the measured price movement.( AB=CD )
NOTE: wait for break of the WEDGE .
Best regards CobraVanguard.💚
TRUMPUSDT trade ideas
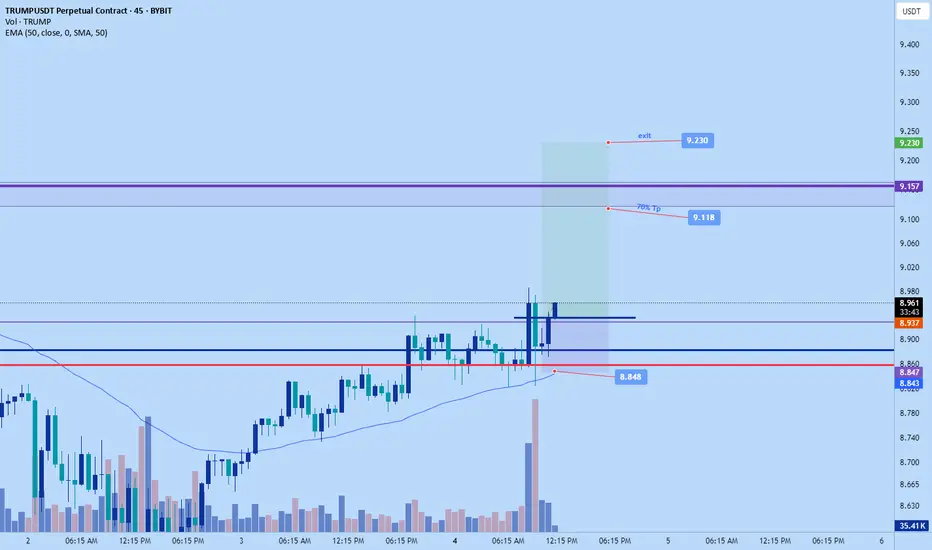
Trumpcoin short to $8.292Just now opened up a short position on Trumpcoin. Market is low and soon I anticipate reversal to the upside but not just yet. Based on my DTT analysis market is likely to make new lows ago.
Sl: $8.745
Time sensitive

Trump/USDT -DOGE mirror 2021TRUMP/USDT is shaping up with a structure that closely mirrors DOGE/USDT’s 2021 price action just before its explosive rally. After an extended period of accumulation and liquidity sweeps, TRUMP appears to be entering the final phase of consolidation — the calm before the storm.
With growing attention, solid community backing, and price behavior aligning with historic meme coin cycles, the setup suggests we could be on the verge of a parabolic breakout.

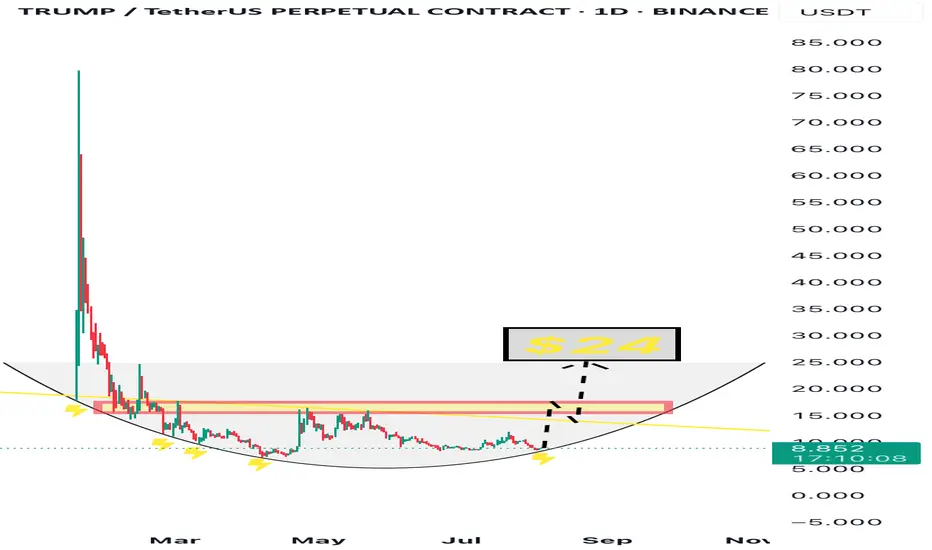
$TRUMP - Rounding Bottom + Strong Narrative We’re currently witnessing a classic rounding bottom formation on the $TRUMP chart.
The price has touched the base 4 separate times, each followed by a bounce — clearly indicating strong support and accumulation.
Now, once again, $TRUMP is testing this base, and structurally the chart suggests a potential breakout toward $24, the top of the cup.
But it’s not just a technical story — the fundamentals are stronger than ever:
• 🎲 A Trump-themed Monopoly game has been officially confirmed by Bill Zanker and the project’s team
• 💸 Justin Sun has publicly announced he will purchase $100 million worth of $TRUMP tokens
• 🛡 Eric Trump revealed that $TRUMP will be added to WLFI’s strategic reserves
This is no longer just speculation — it’s momentum backed by real players.
All eyes on the $24 breakout.
Trump Coin Wave Analysis – 8 August 2025
- Trump Coin reversed from the support area
- Likely to rise to resistance level 10.75
Trump Coin recently reversed from the support area between the support level 8.440 (lower border of the sideways price range inside which the price has been moving from June) and the lower daily Bollinger Band.
The upward reversal from this support area stopped the previous short-term ABC correction ii from last month.
Given the strongly bullish sentiment seen across the cryptocurrency markets, Trump Coin can be expected to rise to the next resistance level 10.75 (upper border of the active sideways price range).

trump/usdt=Trump/USDT Analysis.
= The analysis is based on trend analysis, support and resistance levels, and price action.
= We need a breakout of the trend to begin the upward movement toward the targets.

Buy opportunityThere is a clear W formation on a bigger scale and the buy signal confluence of a small w after the descending channel.
TP1 and TP2 have been indicated.

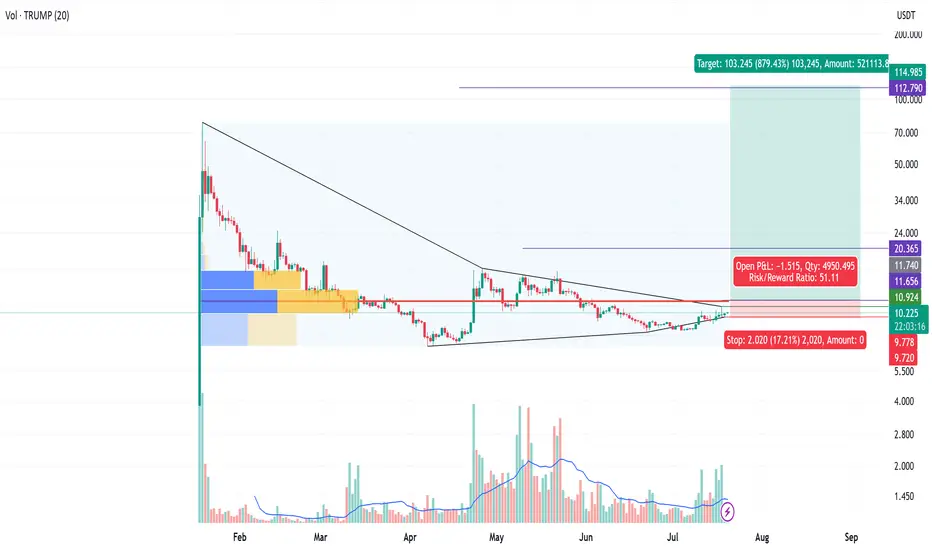
TRUMP - Tight Squeeze Huge R/R 50+, a bit of a wild card as in the pattern maybe still forming and developing. It appears to be bottomed, with supporting OBV (buying volume rising). I will take a 2x leverage on this one.
Entry - 10.924
Stop - 9.778
Interval 1 - 11.7
Interval 2 - 20.36
Target - 112.79
TRUMPUSDT – Daily Supply & Demand AnalysisTRUMPUSDT is showing signs of a bullish reversal after bouncing from the key demand zone around $7.20 – $7.80. Price is now pushing higher, with two major resistance levels ahead.
🔍 Key Observations:
Demand Zone: $7.20 – $7.80 (orange zone)
This zone has held multiple times and is fueling the current bullish momentum.
First Major Resistance: $12.23
A breakout above this level could accelerate the rally toward the next target.
Supply Zone: $15.00 – $15.74 (blue zone)
A strong historical resistance area where sellers may step in.
📈 Possible Scenarios:
Bullish Breakout – If price closes above $12.23, expect continuation toward $15.74.
Rejection – If sellers defend $12.23, price may pull back toward $9.50 or even retest the demand zone before attempting another breakout.
✅ Bias:
Medium-term bullish while price stays above $8.00, with a clear path toward $12.23 as the next major target.
Disclaimer: This analysis is for educational purposes only and not financial advice. Always manage your risk before trading.


TRUMP - Tight Squeeze - 1000% upside & minimal downside R/R 30. 10x from current levels a bit less if entering at entry point of 11.86.
A bit of a wild card pattern, as it has developed a flat bottom. I entered this last time I posted, stopped out but have re-entered.
Entry - 11.86
Stop - 8.686
Interval 1 - 14.39
Interval 2 - 20.186
Target - 111.969

TRUMPUSDt long turmA.o.A all,
Accroding to VSFA+ Trump is dump toO😯🤗, so becarefull & wait when price tuch 5.50$ then buy some Trump coins and ready for 1st pump near 10$ in sha Allah, after that i update whatscoming up next accroding to VSFA+ Golden stratgy 🇵🇰
. . . . . . . . . . . . . . . . . . . . .

TRUMP/USDT - SHORT/LONGImplementation will take about a month and a half.
(This is not an investment recommendation).

TrumpUsdt accroding to VSFA+ Stratgy A.o.A All,
Accroding to VSFA+ Stratgy trumpusdt last retest before big drop, maybe moreee buyser traping i'm still waiting for 3$ to 5$ price velue, when Tmp testing this price velue then i buy some Drump coins & hold for long time in sha Allah....

Trump Wave Analysis – 29 July 2025- Trump falling inside the sideways price range
- Likely fall to support level 8.4380
Trump cryptocurrency continues to fall inside the sideways price range, which has contained price action from the start of June.
The earlier downward reversal from the upper boundary of this price range 11.00 formed the daily Japanese candlesticks reversal pattern Shooting Star, which started the active impulse wave 3.
Given the clear daily downtrend, Trump cryptocurrency can be expected to fall to the next round support level 8.4380 (lower border of the active price range).

TRUMPUSDT Forming Falling WedgeTRUMPUSDT is currently forming a well-defined falling wedge pattern—a bullish reversal structure that often leads to significant upside breakouts. The price has been consolidating within narrowing trendlines and now appears to be approaching a breakout point. Historically, falling wedge patterns in the crypto market have led to aggressive rallies, especially when combined with rising volume and strong community sentiment. With good volume backing this setup, a breakout could trigger a sharp move to the upside, projecting an expected gain of 90% to 100%+ in the coming sessions.
Investor interest in the TRUMPUSDT project has been steadily increasing, likely fueled by the coin’s strong branding and community-driven momentum. Meme-based and politically themed tokens have seen explosive growth in recent bull cycles, and TRUMPUSDT may be positioning itself to capitalize on similar attention. With sentiment aligning positively and technicals flashing bullish signals, the coin is attracting both short-term swing traders and long-term speculative holders.
If TRUMPUSDT confirms a breakout above the upper wedge resistance with volume confirmation, we could see rapid price expansion. Traders should monitor key levels and consider re-entry on retests or strong bullish candles. The momentum shift is already becoming apparent, and this coin could turn into a trending asset in the meme-token segment very soon.
Keep this setup on your radar as it may provide high-reward opportunities. Monitor community updates, upcoming events, and broader meme coin momentum across the market for additional confirmation.
✅ Show your support by hitting the like button and
✅ Leaving a comment below! (What is You opinion about this Coin)
Your feedback and engagement keep me inspired to share more insightful market analysis with you!
TRUMPUSDT: Massive Reversal Incoming? Reaccumulation Zone!
📉 Current Market Outlook:
TRUMPUSDT is currently positioned at a highly strategic technical level. After an extended downtrend since February—dropping from the 60 USDT region to a low of around 7.13 USDT—price has now stabilized and entered a strong reaccumulation zone between 8.50 and 10.20 USDT.
This zone has acted as a reliable support range and shows signs of smart money accumulation, as evidenced by volume spikes and strong price reactions off this base.
---
🧠 Technical Pattern & Structure:
🔸 Base Accumulation / Reaccumulation Rectangle
Price has been consolidating in a tight horizontal range, forming a classic reaccumulation pattern, often seen before major breakouts.
🔸 False Breakdown – Bull Trap Reversal Setup
The brief dip below 8.50 USDT (to 7.13) followed by a strong recovery suggests a potential “shakeout” phase to remove weak hands before a rally.
🔸 First Higher Low Formation
Recent price action has formed a higher low, a key structural signal of a potential trend reversal from bearish to bullish.
---
🟢 Bullish Scenario (Primary):
If price continues to hold above the reaccumulation zone and breaks above 12.48 USDT with strong volume:
Short-Term Targets:
🔹 15.11 USDT
🔹 17.11 USDT
Mid-to-Long Term Targets (if bullish momentum sustains):
🔸 21.59 – 27.96 USDT
🔸 Ultimate target: 46.65 USDT (retest of previous major supply zone)
📈 Potential upside: Over 200% from current levels
---
🔴 Bearish Scenario (Alternative):
If the price fails to hold above the demand zone (drops below 10.00 USDT):
Possible retest of key supports:
🔹 8.50 USDT
🔹 7.13 USDT (major swing low)
⚠️ A confirmed breakdown could signal a continuation of the macro downtrend.
---
🔍 Key Levels to Watch:
Price Level Type Notes
7.13 USDT Major Support Previous swing low
8.50–10.20 USDT Demand Zone Reaccumulation / strong buyer interest
11.25 – 12.48 USDT Key Resistance Breakout trigger zone
15.11 – 17.11 USDT Minor Resistance First bullish targets
21.59 – 27.96 USDT Extension Targets Bullish breakout continuation
46.65 USDT Major Supply Historical resistance zone
---
🧠 Conclusion:
TRUMPUSDT is showing early signs of a macro reversal, with clear accumulation structure and breakout potential forming above a well-defined base. If confirmed by volume and price structure, the upside could be significant.
However, traders should remain cautious and watch for volume confirmation and failure points around key support.
#TRUMPUSDT #CryptoBreakout #AltcoinSetup #BullishReversal #TechnicalAnalysis #ReaccumulationZone #SmartMoneyMoves #PriceActionCrypto #AltcoinAnalysis#CryptoSignals #AltseasonReady

TRUMPUSDT – Explosion Loading...TRUMPUSDT is showing strong confluence between Elliott Wave and Gann techniques, suggesting a potential breakout phase is underway. The WXY corrective structure has matured, and price is unfolding impulsively with textbook internal wave symmetry.
This setup is not just technical—it's mathematical precision in motion.

TRUMP Looks Bullish (1D)It seems that the bullish phase of the Trump coin has started from the point where we placed the green arrow on the chart.
We appear to be at the end of wave B of the bullish phase. As long as the price holds above the green zone, it can potentially move toward the targets marked on the chart.
A daily candle closing below the invalidation level would invalidate this analysis.
For risk management, please don't forget stop loss and capital management
Comment if you have any questions
Thank You

OFFICIAL TRUMP Last Barrier · $30 or $100 Next · MixedThe last barrier is on now. The last barrier as in the last and final resistance level TRUMPUSDT (OFFICIAL TRUMP) needs to conquer before a major rise. Will this rise reach $30 or $100 or higher? Continue reading below.
Make sure to boost this publication and follow to show your support.
Hah! Resistance is confirmed as EMA89, what a drag. This is the blue dotted line on the chart but notice something else. Look at the magenta line, EMA55. TRUMPUSDT is trading above EMA55 but below EMA89. Bullish and bearish. Bearish and bullish. Mixed?
There is nothing mixed.
The main low happened 7-April. A higher low in 22-June. Can you see?
This is not mixed, this is bullish confirmed.
If the market were to move lower, then in 22-June we would have either a test of the 7-April low or a lower low. The fact that the drop stopped higher means that buyers were present. People were actually expecting for prices to drop and once they dropped they bought everything that was being sold. Prices couldn't move any lower because people were buying up. These are smart trader, smart money; experience for sure.
They managed to buy some tokens at a lower price within the "opportunity buy zone." This zone is available no more and now we have the mix of resistance and support; EMA89 and EMA55. What happens next?
Based on the previous signal I just showed you and marketwide action, Bitcoin super strong, we know that TRUMPUSDT will follow and break-up. Yes! Massive growth.
Both targets are good and will hit. Short-term, we will see a challenge of $30 and long-term we will see $100 and beyond.
Thanks a lot for your continued support.
Namaste.

TRUMP IS PUMPING!!!Hello friends🙌
📈Given that the price has reached its bottom and buyers support it, you can buy at 3 specified points with capital and risk management and move with it to the specified targets.
🔥Follow us for more signals🔥
*Trade safely with us*

TRUMP UPDATEHello friends🙌
👀You can see that the price formed a reversal pattern after falling at the specified support and the buyers supported it.
⚠Considering the entry of buyers, the price is expected to move to the specified targets, of course, don't forget about capital and risk management.
🔥Follow us for more signals🔥
*Trade safely with us*
