TRUMPUSD Daily CRTDisclaimer: The charts and analysis presented here are based on my personal research and insights. I am not a financial advisor, and this content is not intended as financial advice or a recommendation to buy or sell any financial instruments. Please conduct your own research and consult with a professional advisor before making any investment decisions.
Credit: Special thanks to Romeo and ICT for their invaluable contributions to the forex industry.
TRUMPUSDT trade ideas

TRUMP COIN NEXT POSSIBLE MOVES AND TRADE IDEAS !!$TRUMP Coin Update & Possible Moves!!
• Two Support areas are marked on chart 12.80$-12.30$ where you are able to build trade on it🫡
Warning : That's just my idea if i take trade i will Update.. DYOR Before Taking any action🚨
D


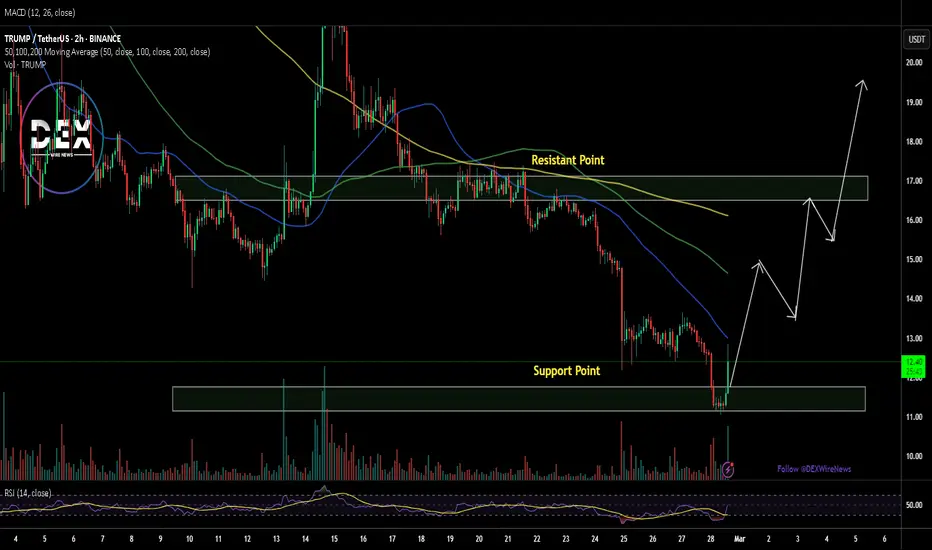
TRUMP: Support and resistanceBINANCE:TRUMPUSDT
Not much of chart history to say anything, considering it as an meme coin, it might do well in the second half of the year as per BTC cycle and alt cycle.
Do not gamble, understand what exactly you are doing and how much you are ok loosing.
Happy trading

TRUMPTRUMP is heading for more discount and i see it in the zone of 6.9-7.38$ ,crypto is diabolical sometimes and many of the project have no ecosystem application.
trade with caution at all times and learn to take profit or partials or break even...liquidity is everything in trading

Trumpty Dumpty back on the WallTrumpty dumpty we had a great fall.
Trumpty pumpty. It’s time to get tall.
Humoty dumpty get in on my call-
Come to MMiQ and perfect your trading of all assets and conditions.

Green days ahead for $TrumpGreen days ahead for $Trump, heading to $23 if it brakes this crucial area.

$TRUMP Coin on the Verge of a Major Breakout: Can It Reach $30?The cryptocurrency market is buzzing with excitement as $TRUMP coin approaches a critical resistance level. Currently trading near $17, the token has already broken a significant Break of Structure (BOS), hinting at a potential bullish surge. If $TRUMP successfully breaches this resistance point, technical indicators suggest a remarkable 200% rally, pushing the price toward $30.
Technical Analysis
A closer look at $TRUMP’s daily chart reveals key bullish signals:
The $17 mark has proven to be a significant resistance level. A confirmed breakout could trigger a strong uptrend, with $30 as the next major target. The Relative Strength Index (RSI) is currently at 48, indicating neutral momentum. However, with buying pressure increasing, RSI could soon move into the bullish zone, reinforcing the uptrend.
The token's recent candlestick formations suggest a bullish engulfing pattern, which often precedes a strong rally. The $11 price point has emerged as a crucial support level. If this level holds, bulls could maintain momentum. However, a break below $11 may lead to a strong sell-off.
Trump Organization’s Metaverse & NFT Plans
The Trump Organization has officially filed a trademark application for 'TRUMP' to launch a metaverse and NFT trading platform. This development aligns with the growing trend of Web3 adoption by prominent figures and institutions.
A metaverse and NFT ecosystem tied to the Trump brand could significantly increase interest in $TRUMP coin, driving speculative demand and institutional involvement. If the project gains traction, it could serve as a major long-term growth factor for the token’s valuation.
What’s Next for $TRUMP Coin?
With both technical and fundamental indicators aligning, $TRUMP coin is at a pivotal moment. The key level to watch remains the $17 resistance. A decisive breakout could ignite a major rally toward $30, while failure to hold above support at $11 might trigger a correction.
#TRUMPUSDT – Bearish Scenario, Breakout Down📉 SHORT BYBIT:TRUMPUSDT.P from $12.278
🛡 Stop Loss: $12.599
⏱ 1H Timeframe
⚡ Trade Plan:
✅ The BYBIT:TRUMPUSDT.P price has formed a Bearish Flag and broke its lower boundary, confirming a bearish scenario.
✅ The asset is trading below POC (Point of Control) at $12.978, indicating strong seller dominance.
✅ Increasing volume on the breakdown further confirms the strength of the downward move.
🎯 TP Targets:
💎 TP 1: $12.100
🔥 TP 2: $11.900
⚡ TP 3: $11.785
📢 A close below $12.278 would confirm further downside movement.
📢 POC at $12.978 is a strong resistance level that the price failed to break.
📢 Increasing volume on the drop supports the bearish outlook.
📢 Securing partial profits at TP1 ($12.100) is a smart risk-management strategy.
🚨 BYBIT:TRUMPUSDT.P remains in a downtrend – monitoring for continuation and securing profits at TP levels!

TRUMP MEME BACK TO ATLs (buying the dip)Trump as we can see (and more Melania) tend to go back to the All time lows made back around 18 January this year. The bottom may last during this weekend and we can see a reversal on Monday -hopefully all the altcoins market will enter a new recovery cycle.
At this price levels its fair to consider DCA-ing into the 'lower dips' as wicks
Some targets on-chart 💎❄️🍀👀🎯

OFFICIAL TRUMP : Urgent Update (Complete Meltdown —Now 700% Pot)Good evening my friends, I have a much needed update for you for the TRUMPUSDT pair and chart.
First, you can buy and continue buying and buy more, because, regardless of the short-term action what follows this situation we are witnessing now is growth. You can be certain about it.
The previous chart setup we looked at had a complete breakdown. This breakdown is a "weak" lower low. This is weak because the previous low happened at $14 and the current one at $12. Which means that this is a market induced shakeout.
Now that support has been broken and TRUMPUSDT is trading lower we need to consider a new entry.
The spot trading strategy is to buy each time prices drop. Each time TRUMPUSDT moves lower we buy and reload. If we are left without ammunition (capital), we simply wait/hold. Nothing changes for waiting a few days.
If you trade with leverage then you need a new entry as the previous position more likely than not has been liquidated, depending on the amount of leverage you use.
The next strong support is $11.83 based on Fib. retracement. This level hasn't been hit. Any trading above this level can be considered a good entry (above support).
Volume is low on the drop. We have a lower low but volume is lower. This means that the bearish move is losing force. Soon, we are going up.
The market gives. The market takes.
Patience is key.
We will soon enter a marketwide bullish phase. (March 2025)
Thank you for reading.
Feel free to message if you have any questions.
Namaste.

#TRUMPUSDT – Bearish Scenario, Expecting a Downward Breakout📉 SHORT BYBIT:TRUMPUSDT.P from $12.492
🛡 Stop Loss: $12.785
⏱️ 1H Timeframe
⚡️ Trade Plan:
✅ The BYBIT:TRUMPUSDT.P price continues to decline after a recent sharp drop.
✅ The chart shows that the asset is consolidating below POC (Point of Control) at $13.105, indicating seller dominance.
✅ The price is testing a support level, and a breakdown could trigger a stronger bearish move.
🎯 TP Targets:
💎 TP 1: $12.305
🔥 TP 2: $12.110
⚡️ TP 3: $11.966
📢 A close below $12.492 would confirm the downward move.
📢 POC at $13.105 is a key volume area that now acts as resistance.
📢 Increasing volume on the decline supports the bearish trend.
📢 Securing partial profits at TP1 ($12.305) is a risk-management strategy.
🚨 BYBIT:TRUMPUSDT.P remains under pressure – monitoring for a confirmed breakdown and securing profits at TP levels!

Trump 15M 1HTFThe price is consolidating near 13.00, a key support level. Historical rejection at this zone suggests buyers are stepping in, indicating a potential reversal.
A sustained move above 13.00 (previous resistance-turned-support) signals bullish momentum. Traders may anticipate a rally toward higher timeframe resistance levels.
Entry Stop Loss And Target Profit are mentioned

Enormous Bull Flag Rocket Setup $35How huge this is may even hit all time highs.. Trump is in the news

Can bulls reclaim $20, or is a 30% drop coming?Hello and greetings to all the crypto enthusiasts, ✌
In several of my previous analyses, I have accurately identified and hit all of the gain targets. In this analysis, I aim to provide you with a comprehensive overview of the future price potential for OFFICIAL TRUMP , 📚💡
The price has lost several critical support levels, making a period of consolidation the most probable outcome at this stage. However, if it fails to break above the $30 daily resistance level, a significant downward move could follow. In that case, I anticipate a minimum decline of 30%, with the primary target set at $10. This scenario would indicate further weakness and a continuation of the bearish trend.📚🎇
🧨 Our team's main opinion is: 🧨
If the price can't break above the $30 resistance, it’s likely to stay range-bound, but a drop of at least 30% to $10 could follow. 📚🎇
Give me some energy !!
✨We invest countless hours researching opportunities and crafting valuable ideas. Your support means the world to us! If you have any questions, feel free to drop them in the comment box.
Cheers, Mad Whale. 🐋

TRUMPUSDT! - $20 it is!Look, I think I was the one who was so bearish on trump and I am happy my bearish stances happened! For new buyers its something they wont Miss, My prev chart, Ive drawn a big candle which shows local OB's acting on presence of Strong DOM. What Can we do here? I would say I am heavy longs here and would wait for a small retrace back and sell my bags at $20, This is something one cannot miss. Lots on nPoC and vPoC with FVG's made, stances are marked for future as DOM is thin now.
Make your path clear and understand and see my previous charts for you to understand what to do!!

Long idea on $TRUMPI understand the nature of this instrument; it is volatile enough to wipe out anyone. Considering all factors—there's FUD, there's trash, and prices are low. Time to test the theory of probability

TRUMPUSDT - THE FINAL CHAPTER (EXTENDED)And this comes the extended version of the TRUMP, BLACKLINE is where you can do something i wont say, Lets follow the lines!!

TRUMP - LONGRisky trade on TRUMP, it should bounce in these areas. I don't recommend using too much capital. Protect the trade soon.

TRUMPUSDT - THE FINAL CHAPTER!Come here the final chapter and the major analysis (thorough on trumpusdt)
Here i drew this, the above image. where you can see two red boxes followed by a black line with a big arrow towards the top, what it means? and this chart what youre seeing is quite new where no one does it quite the way i do,
The TRUMPUSDT 1-hour chart shows a clear bearish trend, with price steadily declining from the $26-$25 range to its current level around $15-$16. Volume profile analysis indicates that the Point of Control (POC) has shifted lower, suggesting that sellers remain dominant, with significant distribution occurring at higher levels. The major sell-off around February 15 led to a consolidation phase before another breakdown, with high-volume nodes (HVN) around $23-$22 acting as resistance, preventing any sustainable rebound. A noticeable low-volume node (LVN) gap exists between $18-$17, which means price could move quickly between these levels. Currently, price is sitting near a low-volume area, indicating a potential expansion move soon. If sellers continue to dominate, further downside toward $14.50 or even $13.50 is likely, as there is no strong support below. However, if buyers step in at the $15 support zone, a relief bounce to $16.50-$17 could occur, with a breakout above $18 leading to a retest of $19-$20. The market remains bearish unless price reclaims $18+ with strong volume, making $14.50 a critical breakdown zone and $18 a key resistance for any reversal. Overall, sellers are in control, but watch for signs of demand at key support levels for major reversals, NOW, will i get a big candle? Ah Yees! you will get that!
Follow the extended chart posted next!

TRUMPUSDT LONG 4HRThe market is currently respecting a daily and 4hr demand zone. structural liquidity have been taken out by the downside movement (SELL) i expect the market to react to that demand zone and go for a BUY RUn (LONG). the chart above is my entry and targeted TP levels

TRUMPUSDT Buy LimitTrump Coin has a signal at the 13.2 level. A buy limit order can be placed at this level for a long-term position. The current consolidation range is between the 16 and 20.5 levels, and it is likely that the price will return inside this consolidation range after a retest of the 13.2 level.

Trump's Golden RatioTrump has launched his own personal token that he will use solely for his own benefit for bribes and money laundering. He's not a politician, he's a businessman who knows how to make money. Creating his own cryptocurrencies is direct proof of that. The $TRUMP token plays a role as the president's personal token for the Republicans to donate to him and a legal way to get money from other politicians. The whole saga with his token is just beginning, it is one of the few steps in building the Trump family the greatest business ever.
As far as the chart is concerned, we should wait for a bounce into the golden section area. Now there was a FUD regarding the ByBit hack, it's like a fake attempt to panic the crowd, but it didn't work with smart people. Only the strongest are left here, who have survived everything they can.
Horban Brothers.
