#TRUMP/USDT#TRUMP
The price is moving within a descending channel on the 1-hour frame and is expected to break and continue upward.
We have a trend to stabilize above the 100 moving average once again.
We have a downtrend on the RSI indicator that supports the upward move with a breakout.
We have a support area at the lower boundary of the channel at 9.53, acting as strong support from which the price can rebound.
Entry price: 9.70
First target: 10.07
Second target: 10.40
Third target: 10.70
TRUMPUSDT trade ideas


TRUMPUSDT – Daily Technical AnalysisTRUMPUSDT – Daily Technical Analysis
The price has reached a key daily support level at $10, showing potential signs of a bullish reversal.
If the support holds, we may see a move toward the resistance area around $14, offering a decent upside opportunity.
In a more bearish scenario, the price could extend its correction to the $9 support zone, which may serve as a stronger foundation for the next upward impulse.
🟢 Key Support Levels: $10 (daily), $9 (secondary support)
🔴 Resistance Zone: $14
Stay tuned for more technical insights and updates.

$TRUMP Bounces from Golden Pocket – Rally Incoming?$TRUMP has bounced from a strong support zone around $10.30–$10.50, which lines up with the 0.618 Fib level.
As long as this support holds, price could push toward $11.78 and possibly higher to $13.00+ if momentum builds.
The structure looks healthy, and buyers are stepping in again.
Keep watching, a move toward the upper levels may be starting! 👀
#Trump #ALTSEASON

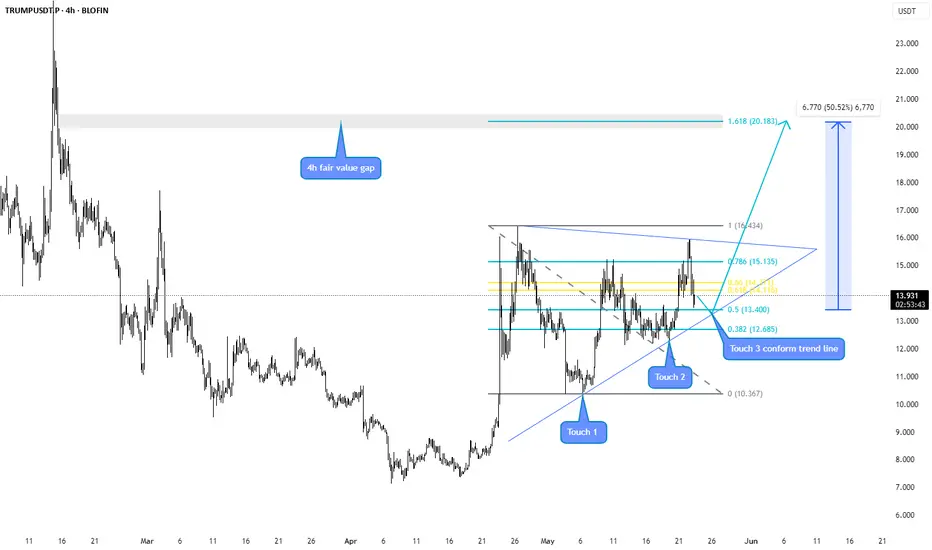
Trump Crypto Setting the Stage for a Massive Move?The Trump-themed crypto ($TRUMP or related memecoins) might be preparing for a 100% gain based on recent momentum, political buzz, and chart patterns.
With rising volume, bullish structure, and a wave of retail interest this could be the perfect storm.
📈 Key zones to watch:
Support: 10.421
Resistance: 13.288
Bullish target: 23.640
Stay alert. Always manage risk. This could get wild.
💬 What’s your take? Moon or mirage?

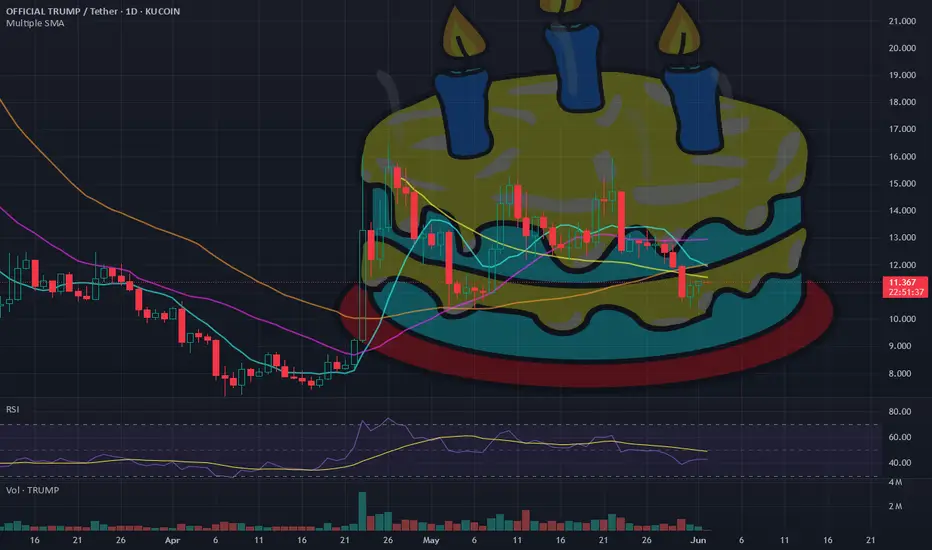
cake patternTrump coin is forming rare cake pattern with completion on June 14, Trump's birthday. Price target can be somewhere at $16.
TRUMP - UPDATESo now we are facing the second option worked. Fine, I`ll be looking for LONG now from this level. NFA - DYOR

Trump Coin Wave Analysis – 30 May 2025
- Trump Coin broke the support zone
- Likely to fall to support level 10.00
Trump Coin recently broke the support zone between the support level 11.95 (which has been reversing the price from the start of May) and the 50% Fibonacci correction of the upward correction (2) from the start of April.
The breakout of this support zone continues the active impulse wave 3 of the intermediate impulse wave (3) from April.
Trump Coin can be expected to fall to the next round support level 10.00 (which stopped the previous wave 1 at the start of May).


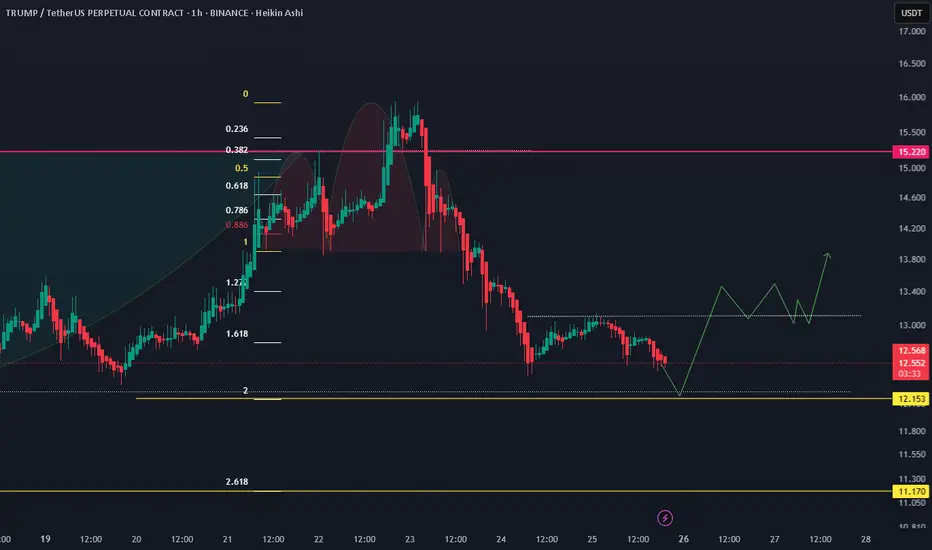
TRUMP to 15$ then 17.5$Three signals are in one hour Timeframe
1- ThreeMoving Averages cross
2- MACD divergence
3 - Stochastic buy signal
Target is 15$ then 17.5$

Trumpusdt possible bounce point/supportA possible bounce point could be around the 12.2 area, which also aligns with the final take-profit (TP) level for short sellers. If a strong bullish pattern forms there, it would be a good entry opportunity.
Trump/USDT MEME leader 500%Among all meme coins, TRUMP is now showing the strongest relative strength. It’s outperforming peers like DOGE, SHIB, and PEPE, suggesting it's becoming the frontrunner of the current speculative cycle .
Entry Zone: $10–$13
Target 1: $24
Target 2: $47
Target 3: $80 –
Potential target : $250 If meme cycle euphoria peaks
🛑 Stop Loss: $8.7

TRUMP / UPDATEIMHO, there are two options:
Either we bounce now back to the resistance, retest it, and keep moving up — which is preferable, TBH.
Or we drop to the lower support, retest, and then go all the way back up — possibly even higher.
NFA – DYOR

Official TRUMP Dinner PUMP?Many Altcoins, specially memecoins, in the past few weeks were growing strongly, is OFFICIAL TRUMP being suppressed?
Let's speculate a little bit.
If you were Trump. No, if I were Trump, Master Trump or Alan Trump, and I have this upcoming event on 22-May. Would I want declining prices or a super-pump right at the same time the event is happening?
If I am a very powerful man and know the power of the media, would I want the memecoin that goes by my name to be super-pumping the same night, at the exact same time as the event goes on? Wouldn't this bring that much more attention if prices were to blow up?
What's your take? What do you think will happen?
The chart looks good for TRUMPUSDT, there is no reason why prices shouldn't be going up. Other pairs are similar, many very similar, but many others continued to grow.
Last week and the week before, it was all memecoins in the top performers. This week, somehow, this market behavior was shutdown and we now only have real projects at the top of the list, which is pretty good actually and refreshing.
Overall, these memecoins can cause real harm to the market. The exchanges can fix this by not listing and delisting but that's not the topic today.
TRUMPUSDT looks good, chart-wise, based on TA. It can grow easily and the action is happening within the "bullish zone."
Another one, the biggest candle since March is a bullish candle. And this is also the biggest candle after the All-Time Low. So the bulls have the upper-hand period. So TRUMPUSDT can grow.
But what about the dinner pump?
You think they are waiting and will buy heavily on the day of the event? Maybe a 100% jump?
I am curious as to what your opinion is, and I'll tell you mine... IT IS GOING UP!
Dinner or no dinner...
Thanks a lot for your continued support.
Namaste.

Trump USDT looks short Trumpusdt was in a range for few weeks in the HTF so the bulls are getting ready for a manipulation before the big move. Let's anticipate a short-term bearish movement this week to OB in the 4HR discount zone.

Trump dawn still in D timeAnalysis Neo wave method
Patern terminal model
Nice chart and fractals patterns

TRUMPUSDT 12H AnalysisTRUMP ~ 12H Analysis
#TRUMP Buy on retest of this support block with short term target of at least 15%++ from here.

Dinner with TRUMP is done, Whats next?So looks like a dinner with Mr Trump made people book profits lOLOLOL, anyways, this is the point of precedence one shall look for.

Trump 4hr tf bullish iH&S patternTrumpusdt 4hr time frame forming a bullish iH&S pattern, a close above 15.22 may activate the pattern.
Targets are 17.5 and 19
Invalidation a close below 13.833 in 4hr time frame. Measure your RRR.

I am bullisch for TrumpWill the Trump coin surprise us. I think so because the price action looks good 50% profit minimum for the coming weeks whether you like it or not. www.tradingview.com