$ 2.2 Long Term TargetAfter a good price increase, it is now stuck in a daily time frame pattern and is controlled in a resistance and support area.
But when we look at the weekly time frame, the flag pattern is quite obvious and the expectation of the corner pattern failure goes up.
In my opinion, the best buying area is the price in three steps, 0.52, 0.618 and $ 0.4, and I set the loss limit at $ 0.35.
In case of failure from above, in the first stage, the price is expected to increase to $ 1.18 as much as the base of the corner and then $ 2.2 as much as the flag bar. Of course, you should keep in mind that depending on the position of Bitcoin, it may be a slightly erosive trend.
TRUUSDT trade ideas

Due to the formation of the flag pattern and its successful failDue to the formation of the flag pattern and its successful failure, I expect the price to increase to the range of $ 0.72, which is also facing a significant resistance of 1.618 Fibos at this price. And if the resistance of this resistance is fixed, the next resistance is predicted to be $ 0.9.

TrueFi breakout (15m)See me previous publication for more details >
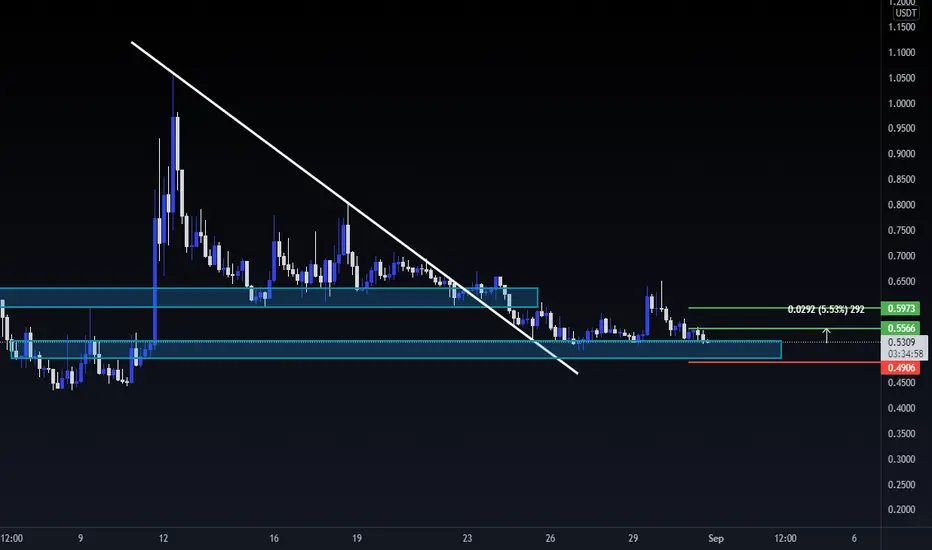
!!BTC IS AT RESISTANCE RIGHT NOW DON'T GO ALL IN ON THIS!!
(if btc dumps this will dump too)
Buy 0.58 - 0.55 (give it some time)
Long-term targets only:
TP1: 0.639
TP2: 0.762
TP3: 0.89
TP4: 0.99
TP5: OPEN++
(short-term traders will figure this out themselves)
SL1: 0.5372 (5%) -- safer
SL2: 0.5013 (11%) -- more risk
Remember about risk management, especially that BTC has been quite volatile lately.

TrueFi continuation (watchlist)After huge pump in August due to coinbase listing, the price has gone into corrective phase right now and formed a bull flag on higher timeframes. It failed to hold crucial level of previous highs (0.54) which along with btc correction resulted in a dump right to the nearest zone of support (0.39)
No entry for now. First, re-claim of 0.54 level is essential , then I'll be looking for an entry once the price breaks out of the formation. However in case the price drops even lower from here I may want to get some entries somewhere around the bottom trendline for short-term trades. (very risky due to low volume node)

TRUUSDT Technical Analysis
⏳ Spot
💎 TRUUSDT on H4 has formed a descending channel and has broken above the resistance. We see several rejections from the Support line. We expect that the price goes down for a pullback before it continues to go higher.
🏁 Short & Medium Term
💵 Invest Only 5% of your Portfolio
🎳 Entry at market or 0.4150
☕️ TP1 0.5000
🍺 TP2 0.5400
🍻 TP3 0.6000
🍾 TP4 0.6500
🍷 TP5 0.7165
🍸 TP6 ______
🍹 TP7 ______
🎁 TP8 ______
🚫 SL 0.3820
Good Luck 🎲
Check the Links in Description and If you LIKE this analysis, Please support our page and Ideas by hitting the LIKE 👍 button. ❤️ Your Support is really appreciated! ❤️
Traders, if you have your own opinion about it, please write your own in the comment box. We will be glad for this.
Feel free to request any pair/instrument analysis or ask any questions in the comment section below.
We will have more FREE forecasts in TradingView soon
Have a Profitable Day

TRUEfi: $0.50 to $4.0 & $20 playoutbankers and dead money love to park their money in Financial services such as this project which is backed up by veterans in turning water in to wine...
Lending 2.0

SWING TRADE - TRUUSDT - SHARK PATTERN UNDER FORMATION"Potential Shark Pattren Under Formation"
Price is reaching towards 0.5421 which is a strong support level for TRU, however inorder to complete the pattern price has to go upto 0.51 level, where there is another strong support which has been tested recently if it happens and shark pattern gets completed, we can say that bull run will start and if it breaks 0.66 (strong Resistance level) then it will easily go upto 0.75 level very soon.

TRUUSDST🌟this coin has shows a lot of fluctuations recently which can be both good and bad at the same time BUT we are going for its bullish potential which is obvious for us at a glance to the chart and just needs some investors to shine and gives profit which is going to happen in the upcoming alt season
👉This idea has the confirmation of "advanced price action" 👍
👉Follow us and invite your friends too, this way we can share ideas and signal to anyone we care 👍
👉Hit share and spread the information in public chats or your twitter for everybody to get profit 👍
👉Tell us what's important for you in the market or what asset makes a difference in your investment basket 👍

5 to 10 percent move for TRU?Tru moving sideways for a while now now is on a support level the 5 to 10 percent move is expected now.
SWING TRADE - LONG POSITION - TRUUSDTDETAILS ON THE CHART!!!
ENTRY : 0.5445
STOP : 0.5242
TP1: 0.6084
Bullish trade starts
As it is cutting 0.318 level of fib.
Pattren Gartley, showing bullish indication
Targets 1.2 Fib level minimum.

TrueFi/USDT PredectionIt has unexpected Behavior, My suggest that wait for this to down to Protection line and then buy it, in this strategy you can get 3 present profit

🆓TrueFi (TRU) Aug-25 #TRU $TRUTRU has just approached the $0.55 zone and buying power has appeared and if it doesn't lose this zone, in the next few days it will surge to the $0.7, $0.85 and $1.1 zone. But if it loses the $0.55 zone it will fall to the $0.4 zone or even deeper
📈BUY
🔴Buy : 0.535-0.565$. SL if B
🔴Buy : 0.68-0.72$ if A. SL if B
📉SELL
🔴Sell : 0.68-0.72$. SL if A
🔴Sell : 0.83-0.87$. SL if A
🔴Sell : 1.07-1.13$. SL if A
♻️BACK-UP
🔵Sell : 0.535-0.565$ if B. SL if A
🔵Buy : 0.39-0.41$ if A. SL if B
❓Details
🕯Timeframe : 1 Day
📈Red Arrow : Main Direction as BUY and SELL section
📉Blue Arrow : Back-Up Direction as BACK-UP section
🟩Green zone : Support zone as BUY section
🟥Red zone : Resistance zone as SELL section
🅰️A : The Close price of candlestick is Above the zone
🅱️B : The Close price of candlestick is Below the zone

Long for TRU?Tru on a support level , moving sideways from quite a long now , i am risking one percent only here, let's see how it goes.


TRUUSDT RISING CHANNEL PATTERNTruusdt has been following an uptrend since the bounce from its strongest support level ($0.1). We saw price correction after the bull run to a new ATH($1) and truefi still showing bull signs following the rising channel pattern. Chart shows the minor and major rising channels which implies a possible uptrend to the higher high of the channel or prolly to a new ATH. $0.66 - $0.664 is a good entry with a stop loss at $0.621(6% risk). Price targets are shown at the red rectangles.
Your likes and opinions would be much appreciated, you can follow up for more helpful contents and do follow my comment sections too for quick updates.

TRU USDT H1 CHARTMust cross the resistance line then it should try 2 times and pass the resistance area it failed to pass.

TRU USDT H1 CYPHER PATTERNThere is a cypher pattern on the h1 chart.
Candles should be followed in the region

TRU rounded bottomTRU already had one rounded bottom with parabolic run up. Could do again... Watch it

Cup and Handle pattern detection $TRU TrueFiCup and Handle pattern detection $TRU TrueFi
Next Target will be at minimum +130%

TrueFi (TRU) formed bullish Cypher for upto 64.5%Hi dear friends, hope you are well, and welcome to the new update on TrueFi ( TRU ).
On the 4-hourly time frame chart, the price action of TRU has formed a bullish Cypher.

TRUUSDT - IS IT SET FOR A NEW 77% RIDE?Truusdt is trading in a descending channel and its currently at the edge of the descending trendline. Is it set for a new rally or breakdown to previous lows then boom again. Before taking a position either long or short, wait for breakout with a retest at the indicated spot on chart before taking a long position.
Your likes and opinions would be much appreciated, you can follow up for more helpful contents and do follow my comment sections too for quick updates.

Cup and handle formingTru fits all of my criteria.
1. Low market cap (lots of room for growth)
2. Good project (team, investor backing, scope, goal).
3. Getting listed on Coinbase today.
We see a cup and handle forming. As long as BTC does not die in the middle, we can expect upside as it breaks into the top 100-200 market cap range.

