TrueFi (TRU)Comprehensive Analysis of TRU/USDT
Overview
TrueFi (TRU) is an innovative project in the decentralized lending space (DeFi Lending) that enables collateral-free lending. The TRU coin is among the low-market-cap cryptocurrencies, and due to its low liquidity and high volatility 🚨, it falls into the category of high-risk trades. For investing or trading this coin, risk management and attention to trading volume are essential.
Current Market Situation
Downtrend Channel: 📉
TRU’s price is currently in a downtrend channel and is heading towards the bottom of the channel.
Weekly Support Zone:
The range (0.0605 - 0.0662) acts as a key support level. Although there is a possibility of a drop below this range, a quick rebound (Fake Breakout) from this zone could signal a safe entry. 💡
Trading Volume: 📊
If the volume increases when the price bounces from the channel’s bottom, the likelihood of price rising to the top of the channel strengthens. Traders should pay close attention to volume near the support range.
RSI: 📈
RSI Support Zone:
The range (41.24 - 44.19) could prevent further decline. A breakdown of this zone could lead to a deeper drop.
Breaking the 50 RSI Zone:
A move above this level could indicate a strong upward move, providing a good entry opportunity. 🚀
Upcoming Scenarios
Bullish Scenario: 🌟
Bounce from the Bottom of the Downtrend Channel:
If the price stabilizes in the support range (0.0605 - 0.0662) and trading volume increases, an upward move to the top of the channel becomes likely.
Breakout of the Downtrend Channel’s Top:
If the top of the downtrend channel is broken, the price could reach the target range (0.2258 - 0.2702). Given TRU's low market cap, heavy liquidity inflow could push the price beyond this target. 📌
Bearish Scenario: ⚠️
Loss of Weekly Support:
If the range (0.0605 - 0.0662) is lost, the next support is at 0.0400.
Traders should set appropriate stop-loss orders to mitigate risk. 🛑
Weakness in RSI:
A breakdown of the support zone (41.24 - 44.19) in the RSI could signal a continuation of the downtrend. 🔻
Range-Bound Scenario: ⏸️
If the price remains within the weekly support zone and trading volume decreases, a short-term range-bound movement may develop. 🔄
Stop-Loss:
For long trades, set the stop-loss below the 0.0600 range. ❌
Trade Volume:
Given the high risk, it is recommended to allocate only a small percentage of capital to this trade. 💰
Summary
TRU, considering its technical setup and position in the downtrend channel, can present promising trading opportunities. However, due to its low market cap and high volatility, risk management is crucial. ⚡
Recommendation: Always review fundamental factors and project-related news before making any decisions. 📰
⚖️ Warning: This analysis is purely technical and should not be considered financial or investment advice. Always do your own research and practice risk management. Good luck! 🚀
TRUUSDT trade ideas

TRU Ending Diagonal
In the 4H Chart, we have an ending diagonal in the form of a descending wedge, with 3 swings to the downside (green I, III and IV).
A break of the top trendline should take us to major resistance at 1.00.

TRUUSDT 1WTRU ~ 1W Analysis
#TRU If you still have Conviction on this coin,. buy gradually on this support block with a minimum target of 20%+

TRU/USDTKey Level Zone: 0.06830 - 0.06880
HMT v5 detected. The setup looks promising, supported by a previous upward/downward trend with increasing volume and momentum, presenting an excellent reward-to-risk opportunity.
HMT (High Momentum Trending):
HMT is based on trend, momentum, volume, and market structure across multiple timeframes. It highlights setups with strong potential for upward movement and higher rewards.
Whenever I spot a signal for my own trading, I’ll share it. Please note that conducting a comprehensive analysis on a single timeframe chart can be quite challenging and sometimes confusing. I appreciate your understanding of the effort involved.
Important Note :
Role of Key Levels:
- These zones are critical for analyzing price trends. If the key level zone holds, the price may continue trending in the expected direction. However, momentum may increase or decrease based on subsequent patterns.
- Breakouts: If the key level zone breaks, it signals a stop-out. For reversal traders, this presents an opportunity to consider switching direction, as the price often retests these zones, which may act as strong support-turned-resistance (or vice versa).
My Trading Rules
Risk Management
- Maximum risk per trade: 2.5%.
- Leverage: 5x.
Exit Strategy
Profit-Taking:
- Sell at least 70% on the 3rd wave up (LTF Wave 5).
- Typically, sell 50% during a high-volume spike.
- Adjust stop-loss to breakeven once the trade achieves a 1.5:1 reward-to-risk ratio.
- If the market shows signs of losing momentum or divergence, ill will exit at breakeven.
The market is highly dynamic and constantly changing. HMT signals and target profit (TP) levels are based on the current price and movement, but market conditions can shift instantly, so it is crucial to remain adaptable and follow the market's movement.
If you find this signal/analysis meaningful, kindly like and share it.
Thank you for your support~
Sharing this with love!
HMT v2.0:
- Major update to the Momentum indicator
- Reduced false signals from inaccurate momentum detection
- New screener with improved accuracy and fewer signals
HMT v3.0:
- Added liquidity factor to enhance trend continuation
- Improved potential for momentum-based plays
- Increased winning probability by reducing entries during peaks
HMT v3.1:
- Enhanced entry confirmation for improved reward-to-risk ratios
HMT v4.0:
- Incorporated buying and selling pressure in lower timeframes to enhance the probability of trending moves while optimizing entry timing and scaling
HMT v4.1:
- Enhanced take-profit (TP) target by incorporating market structure analysis
HMT v5 :
Date: 23/01/2025
- Refined wave analysis for trending conditions
- Incorporated lower timeframe (LTF) momentum to strengthen trend reliability
- Re-aligned and re-balanced entry conditions for improved accuracy

The ultimate TRUEFI comeback?The USP = one of the first uncollateralized lending protocols in DeFi.
It looks like this coin got introduced at astronomical prices and went through a massive bear market correction. Looks like its ready to go on a parabolic comeback in time for alt season.
This could make a massive wave 3 move

TreFi - is this the ultimate comeback?The USP = one of the first uncollateralized lending protocols in DeFi.
It looks like this coin got introduced at astronomical prices and went through a massive bear market correction. Looks like its ready to go on a parabolic comeback in time for alt season.
This could make a massive wave 3 move

#TRU/USDT Ready to go higher#TRU
The price is moving in a descending channel on the 30-minute frame and sticking to it well
We have a bounce from the lower limit of the descending channel, this support is at 0.0780
We have a downtrend on the RSI indicator that is about to be broken, which supports the rise
We have a trend to stabilize above the moving average 100
Entry price 0.0795
First target 0.0810
Second target 0.0836
Third target 0.0863

TRU planThis is my TRU plan. I expect the price to bounce in orange box. Lets see if the market gives us orange box.

#TRU/USDT#TRU
The price is moving in a descending channel on a 30-minute frame and is expected to continue upwards
We have a trend to stabilize above the moving average 100 again
We have a descending trend on the RSI indicator that supports the rise by breaking it upwards
We have a support area at the lower limit of the channel at a price of 0.1200
Entry price 0.1200
First target 0.1250
Second target 0.1300
Third target 0.1370


Tru/UsdtBINANCE:TRUUSDT
### **Current Price: 0.1484 📊**
- The **current price** of Tru is **0.1484**. This is where the market is right now. From here, the price could either go up, break through resistance levels, or drop to support levels depending on market movements.
---
### **Resistance Levels 🚧:**
Resistance levels are points where the price may face difficulty rising above. If the price breaks through these levels, it might surge higher.
- **0.1700** 🚀: The first level of resistance. If the price breaks above this point, there could be a continuation of the upward trend 📈.
- **0.2000** ⚡: A stronger resistance level. Breaking this level could indicate a more significant bullish move. It could bring more attention to the asset as it climbs higher.
- **0.2434** 🌟: An even higher resistance level. If the price manages to break this point, it could signal a strong momentum shift and lead to a larger rally.
Breaking these resistance levels means the price could push higher, but if it fails to maintain above these points, we could see a pullback.
---
### **Support Levels ⬇️:**
Support levels are price points where the market tends to find buying interest. If the price falls to these points, buyers might step in, and the price could reverse.
- **0.1233** 🛑: The first support level. If the price drops here, it could find some support and might reverse back up 📈. However, if it fails to hold, we may see a further decline.
- **0.1000** 💡: A critical support level. If the price reaches this level, it might indicate that the market is struggling to go lower. Buyers might step in, pushing the price back up 🏠.
- **0.0800** 🏚️: The lowest support level you mentioned. If the price drops here, it could signify a deeper correction or a strong area where the price might stabilize. However, if this level is broken, further declines are possible ⏬.
---
### **Not Financial Advice 🚫💸**
Remember, this analysis is just an observation based on the levels you provided, and the market can be unpredictable. Always do your own research and be cautious when making trading decisions!

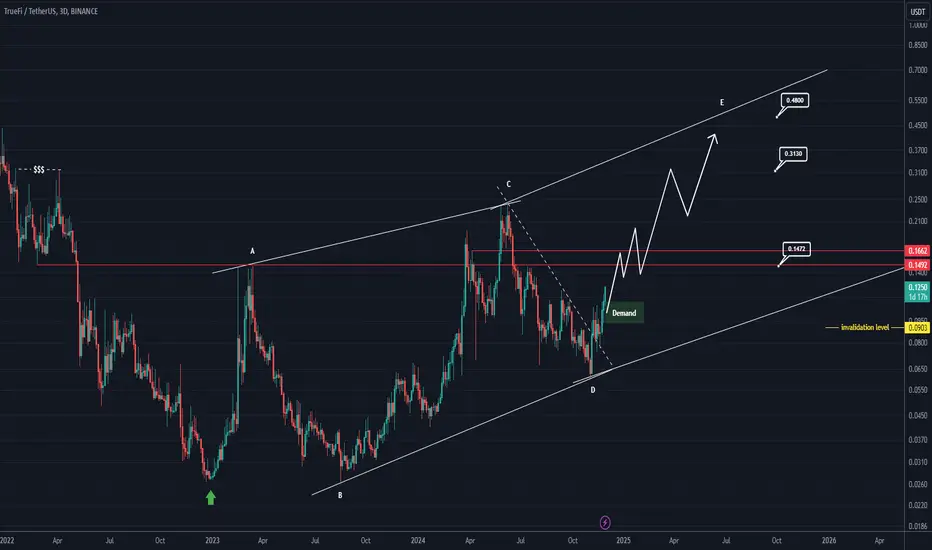
TRU ROADMAP (3D)This analysis provides an overall view for TRU. Entering a position requires determining entry points, stop-loss levels, and proper capital management. Those who hold this coin in their portfolio can use this analysis to stay informed about its potential future fluctuations.
TRU appears to be in a diametric structure, and it seems to be aiming to complete wave E.
The time frame is 3 days, and this analysis will take time to materialize.
We have marked the main targets of this move on the chart.
On the top left, we have a liquidity pool. Once this pool is emptied, we need to be cautious (after reaching the second target).
A daily candle closing below the invalidation level will invalidate this analysis.
For risk management, please don't forget stop loss and capital management
When we reach the first target, save some profit and then change the stop to entry
Comment if you have any questions
Thank You
TRU CHART REVIEWAccording to the chart and project review, tru can have good targets according to market conditions and the first target is marked on the chart, it will be updated.

Tru/UsdtBINANCE:TRUUSDT
### ** NYSE:TRU Update 🚨**
** NYSE:TRU ** has **broken out** of its **main falling wedge pattern** after consolidating for the past few months! 📉➡️📈 This is a major technical signal indicating potential for significant upward movement in the near future. 🔥
---
### **What's Happening?**
- **Falling Wedge**: The falling wedge pattern is typically a **bullish continuation pattern**, where the price gradually narrows between two converging trendlines. A breakout from this pattern often signals the start of an uptrend.
- **Consolidation**: Over the past few months, NYSE:TRU has been in a period of consolidation, meaning it was trading in a relatively tight range with no strong direction. Now that it has **broken** out of this pattern, the potential for **strong price movement** is on the table.
---
### **Potential Gains 💰**
- After breaking the wedge, there’s potential for **100%+ gains** if the bullish momentum continues. 🚀
- **First Target**: The immediate goal is to watch for the price to maintain its breakout level and potentially target **previous highs** or resistance areas from before the consolidation.
- **Long-Term Potential**: A sustained breakout could push NYSE:TRU even higher, depending on the market's response and broader trends.
---
### **Why This Matters:**
- **Bullish Breakout**: Breaking a falling wedge is often a sign that the asset is gearing up for strong upside movement. Investors who catch the breakout early could benefit from substantial returns.
- **Volume Confirmation**: Watch for **increased volume** accompanying the breakout. A strong breakout with high volume is usually more reliable than one with low volume, which might indicate a false breakout.
---
### **Next Steps 🔍:**
- Keep an eye on ** NYSE:TRU ’s price action** over the next few days. If the breakout holds, we could see rapid price increases as more buyers come in.
- Be mindful of possible **retests** of the breakout level (a pullback to the breakout zone), as this can provide a better entry for traders.
---
**Reminder**: Always do your own research (DYOR) and keep track of broader market conditions. 📚📊
(Not financial advice, just sharing the technical analysis! 😉)

TRUUSDT 1WTRU ~ 1W
#TRU This is a coin from the RWA sector. If you have Conviction on this coin,. Wait until the resistance line of this pattern is successfully broken. after that buy in stages. with a minimum target of 20%+

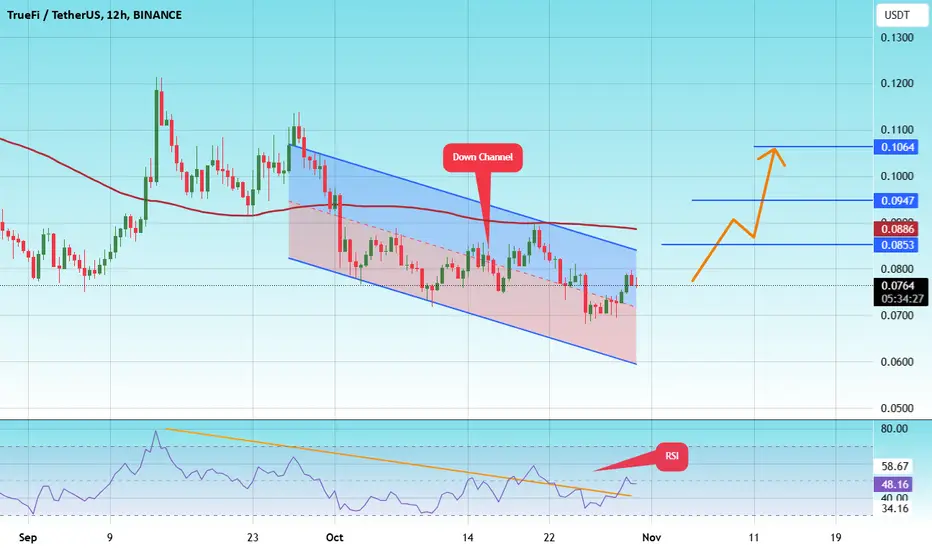
#TRU/USDT#TRU
The price is moving in a downward channel on the 12-hour frame upwards and is expected to continue
We have a trend to stabilize above the moving average 100 again
We have a downward trend on the RSI indicator that supports the rise by breaking it upwards
We have a support area at the lower limit of the channel at a price of 0.0763
Entry price 0.0764
First target 0.0853
Second target 0.0946
Third target 0.1064
TRUUSDTHMT v1.0 spotted. Looking good with previous wave up with increasing volume and momentum.
- BOS (Breaks of Structure) at @ 0.09654-0.09752 level
- Trending slow and steady if able to hold above the BOS level
It is at extremely good reward to risk level.

A Paradigm Shift in Onchain Credit Systems TrueFiTrueFi represents a pioneering leap in the realm of decentralized finance (DeFi), specifically tailored to enhance the ecosystem of onchain credit. Launched in November 2020, TrueFi has established itself not merely as a platform but as a modular infrastructure designed to facilitate and innovate the mechanics of credit in the blockchain environment.
At its core, TrueFi serves as a nexus, intricately weaving together various stakeholders in the credit market through the use of sophisticated smart contract technology. This system is governed by the TRU token, which plays a pivotal role in the governance and operational mechanics of the platform. Here’s how it functions:
Lenders: Individuals or entities looking to earn interest on their capital by lending it out in a secure, transparent blockchain environment.
Borrowers: A diverse group, including but not limited to crypto-focused institutions, traditional fintech companies, trading entities, and credit funds seeking capital. These borrowers benefit from the flexibility and accessibility of funds without the conventional barriers presented by traditional banking systems.
Portfolio Managers: These are key players who manage loan portfolios, optimizing for risk and return, thereby ensuring the health and profitability of the lending pools.
Loan Origination: Since its inception, TrueFi has successfully originated loans amounting to over $1.7 billion, spread across more than 30 borrowers. This figure not only highlights the platform's capacity to handle substantial financial throughput but also underscores its growing acceptance and trust within the DeFi community. TrueFi’s design as a modular infrastructure allows for scalability and adaptability, crucial in the fast-evolving blockchain landscape. This modularity ensures that TrueFi can integrate with various other DeFi protocols, enhancing its utility and extending its reach across different aspects of onchain financial services.
Team
Raphael Kosman is a co-founder who plays a significant role in TrueFi's strategic direction and technical development, given the typical responsibilities of co-founders in tech startups
Tory Reiss - also a co-founder and has been involved in shaping the company's vision, business model and partnerships, given the collaborative nature of founding teams.
Jai An - Jai An's role as another co-founder covers various aspects of the business, from technology to business development, contributing to TrueFi's core functionality and expansion.
Stephen Cade - as a co-founder, Stephen will play an important role in TrueFi's start-up and current growth phases, focusing on product and technology.
Alex de Lorraine - as CEO, Alex leads the company, driving its strategic vision, operational efficiency and market positioning in the DeFi space.
Bill Wolf - as CIO (Chief Investment Officer), Bill oversees investment strategies and manages the lending and borrowing arrangements that are central to TrueFi's operations.
Diana Bouchard - serves as General Counsel and handles legal matters to ensure TrueFi's compliance with relevant regulations and laws, which is critical for the financial and blockchain sectors.
Esben Svane Stockmarr - Advisor, he can advise on strategic decisions, bringing in experience from other sectors or specific market knowledge.
Ichiro Minamikawa is also listed as an advisor. Ichiro may contribute to TrueFi's strategy in terms of market expansion, technology partnerships or other specialized advice.
Dovey Wan - As an advisor, who is active in the blockchain and cryptocurrency community (as noted in X's posts about her involvement in various discussions and personal anecdotes in the crypto space), is likely to bring insight into market trends, community engagement, or even technological innovation in the blockchain ecosystem.
The composition of the team demonstrates a combination of technology, finance, legal and strategic advisory experience, which is critical for a platform like TrueFi that operates at the intersection of finance and blockchain technology. This team structure is designed to navigate the complexities of decentralized finance, driving growth, compliance, and innovation in collateral-free lending.
Fundraising
Total Raised $ 32.50M
Andreessen Horowitz (a16z) - Known for its significant investments in tech and crypto sectors, a16z has participated in TrueFi's funding, indicating strong venture capital confidence in TrueFi's model.
Jump Trading and Jump Capital - Both entities are involved, showcasing interest from trading firms that might benefit from or contribute to the DeFi lending ecosystem.
BlockTower Capital - A cryptocurrency investment firm that has backed multiple rounds for TrueFi, suggesting a strong belief in the project's potential within the DeFi space.
Distributed Global - Another venture capital firm focusing on blockchain technologies, indicating TrueFi's appeal to specialized crypto venture funds.
Slow Ventures - This firm has also invested, known for backing tech startups at various stages.
Foundation Capital and DHVC (Danhua Capital) - These investments reflect a broader interest from venture capitalists in extending TrueFi's capabilities or integrating its technology into broader financial services.
Alameda Research - Before its known issues, Alameda was involved in private sales, illustrating early interest from major crypto trading entities.
GGV Capital - A firm with a global perspective, investing in local and global tech companies, which might be looking at TrueFi's expansion or integration capabilities.
Private and Strategic Rounds: TrueFi has gone through various rounds of funding, including private sales and strategic rounds. These rounds are not just about raising capital but also about aligning with strategic partners who can contribute to the ecosystem's growth, technology, or market access.
Token Sales: While not traditional ICOs, the sale of TRU tokens serves as a form of fundraising where tokens are used for governance and to incentivize participation in the TrueFi lending protocol. This method leverages the community's direct involvement in the protocol's success.
Focus on Real-World Assets (RWA): The introduction of Trinity, as mentioned in recent developments, focuses on lending against tokenized real-world assets. This initiative could potentially open up new avenues for fundraising by attracting investors interested in combining traditional finance (TradFi) with DeFi.
Tokenomics
Incentive Distribution: 39.00%
Tokens: 565.50 M TRU
Dedicated to rewarding community engagement and ecosystem growth, this slice of the pie incentivizes participation and long-term commitment.
Private Sale: 28.50%
Purpose: Early investment rounds that fuel initial development and market entry strategies, ensuring the project has the necessary resources to thrive.
Team & Management: 18.50%
Investment in Talent: Allocated to the visionaries, developers, and managers who turn concepts into reality, this ensures the team's interests are aligned with the project's success.
Grants / Company: 9.50%
Innovation & Expansion: These funds are set aside for grants aimed at fostering innovation, research, community projects, and the overall expansion of the company's reach.
Future Team: 4.50%
Future-proofing Talent: Reserved for future hires, this allocation allows for the continuous attraction of top-tier talent as the project evolves.
This allocation strategy not only supports the immediate operational needs but also invests in the future growth and community engagement, ensuring a balanced approach to token distribution.
Blockchain
Ironically, the largest holders of TRU are two of the most famous crypto exchanges - Binance and Coinbase.
Two whales have recently emerged that have accumulated 1.9% of the entire issue each. This indicates insider information within the project and quite large purchases at market price!
A number of well-known companies (Circle, Worldcoin and others) also have a large amount of TRU on their wallets. This indicates its continued widespread use in the community and among the cryptocommunity. GSR have already listed their tokens on the exchange to pump up the price, this explains the above mentioned about the large number of tokens on the exchange.
Conclusion
The project is very promising from the point of view of community use, as well as from the point of view of asset price growth. GSR market maker knows how to pump up such projects, moreover, the issue of tokens on exchanges is almost equal to the issue in the hands of GSR. The percentage of tokens in the same hands is off the charts! The team continues to actively develop the project, as well as working on integrations into all possible areas of economics and crypto. The whales have finished accumulating, the breakthrough is very soon. Buckle up!
Best wishes, Horban Brothers!

TRUUSDT Breakout - Strong Momentum Ahead!!BINANCE:TRUUSDT has successfully broken out of resistance after multiple retests of support, signaling a strong bullish trend. Currently trading above the EMA 100, this breakout is backed by impressive volume, indicating solid buying interest. With the technical indicators aligned, we anticipate significant upward movement in the near future.
As always, remember to manage your risk effectively by placing stop-loss orders to protect your position.
BINANCE:TRUUSDT Currently trading at $0.086
Buy level: Above $0.086
Stop loss: Below $0.079
TP1: $0.92
TP2: $0.097
TP3: $0.1
TP4: $0.12
Max Leverage 3x
Follow Our Tradingview Account for More Technical Analysis Updates, | Like, Share and Comment Your thoughts

TRU looks strongHello, we have some new FUD so there are so many nice swing or long term trades. One of them is TRU. PA is bullish, tagets on the chart. If you have any questions, let me know.
MANAGE YOUR RISK AND USE STOPLOSS
NOT A FINANCIAL ADVICE

TrueFi | No Accumulation Before Bullish Wave? Bitcoin Dynamics We saw projects such as Solana and Bitcoin, Tron as well, that moved to hit new All-Time Highs, or very close to their November 2021 peak price. These projects and their trading pairs would need to undergo a correction followed by consolidation before producing a new, big, major bullish wave; that's the reasoning we've been following lately.
Here we have TrueFi in its Tether pairing, TRUUSDT, and we expect no such consolidation, why?
The bullish wave in late 2023, ending in early 2024, was much smaller compared to Bitcoin, Solana and Tron. While these move to hit new ATH, TRUUSDT and others Altcoins that are good now, only produce the "initial breakout." This wave hit as high as the price at which the pair traded back in April 2022. So it is a small wave in comparison. Since it is a small wave, it requires a small correction. Since it is a small wave, it requires a small consolidation phase before the next move. All the action happening now can be considered part of a long-term accumulation.
On the other hard, a super strong wave would require a super strong correction.
A super strong wave would require a strong consolidation phase before another super strong b-wave can develop.
Think back to mid-, late 2023. Bitcoin had to consolidate (accumulation phase) for 7 months (220+ days) before it was able to move from ~26,000 to 74,000. In order for Bitcoin to move to new highs, it would need to produce a strong and long consolidation phase.
Right now it is going through a distribution phase. It is like accumulation but in reverse, it is loading and gaining force in order to break-down a strong support.
That's why TrueFi looks good now for accumulation in expectation of long-term growth. It is not that it will move within days or weeks, but rather we can buy and wait for months to later enjoy massive growth with a great entry.
If it drops, buy more.
If it drops more, buy some more.
Then wait... Wait, patience; hold.
Then it starts to move up again...
Still, nothing great.
Then it speeds up, you are now full in the green; months pass by this time.
Then things start to look great.
The market undergo fluctuations, panics, corrections, swings; but you are fine because you bought the year prior at low prices and thus everything looks great.
When euphoria hits the market and people start talking about Bitcoin 500K, prepare because that is likely the end.
I will be here though pointing it all out, and you can use this information in the best way you can.
Thank you for reading.
Namaste.

#TRU/USDT breaking the Diagonal Trendline in 1-Hour TF!#TRU/USDT breaking the Diagonal Trendline in 1-Hour TF!
Wait for a successful retest to long it. NSE:TRU local resistance level is $0.11225 and the support level is PML $0.08511.

#TRU/USDT#TRU
The price is moving in an ascending channel on the 4-hour frame and is sticking to it very well
We have a bounce from a major support area in green at 0.0830
We have an uptrend RSI that has been broken upwards which supports the upside
We have a trend to stabilize above the 100 moving average which supports the upside
Entry price 0.0840
First target 0.0953
Second target 0.1022
Third target 0.1103
