TRU - Break Time for TRU and SHORT time for us#TRU/USDT #Analysis
Description
---------------------------------------------------------------
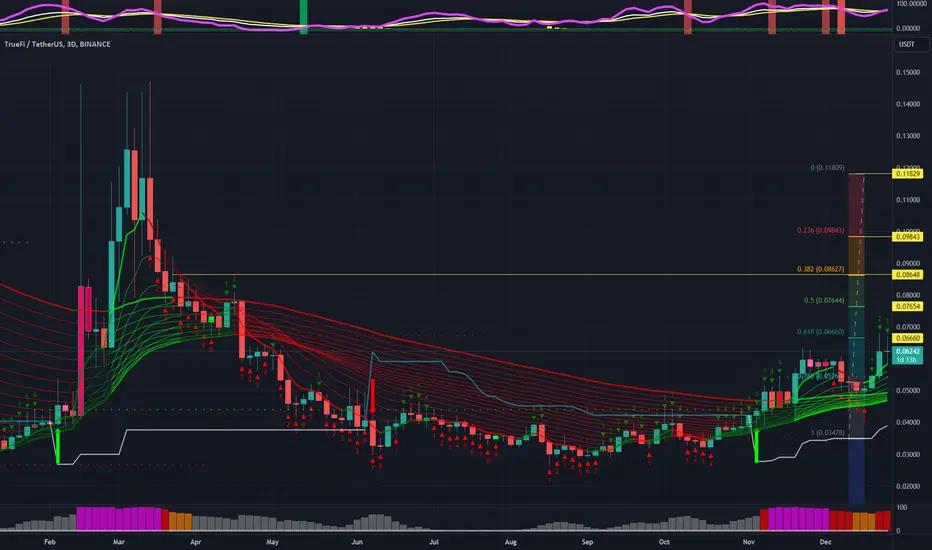
+ TRU appears poised to break its long-standing trend and move towards its next support level.
+ I'm identifying a favorable opportunity to enter a short trade.
+ It's important to note that executing a short trade in a bullish market carries inherent risks, necessitating the implementation of a stop-loss strategy.
---------------------------------------------------------------
VectorAlgo Trade Details
------------------------------
Entry Price:0.06792 (after breakout)
Stop Loss: 0.07 428
------------------------------
Target 1: 0.06589
Target 2: 0.06325
Target 3: 0.05958
Target 4: 0.05636
------------------------------
Timeframe: 4H
Capital: 1-2% of trading capital
Leverage: 5-10x
---------------------------------------------------------------
Enhance, Trade, Grow
---------------------------------------------------------------
Feel free to share your thoughts and insights.
Don't forget to like and follow us for more trading ideas and discussions.
Best Regards,
VectorAlgo
TRUUSDT trade ideas

Finally Tru Breakout Confirmed As Expected seems like has already bottomed out and finally ready for some solid gains
multi year down trend recently reversed with descending channel breakout so consolidation is over and now preparing for massive recovery in coming weeks
expecting 3 to 4x bullish wave in coming weeks

#TRU/USDT - Long - Potential 18.04%Strategy: Long
Exchange: BINANCE
Account: Spot
Entry mode: Market order in range
Invest: Risk 1%
Exit:
• ⎿ Target 2 : 0.0812 18.09%
• ⎿ Target 1 : 0.07214 4.92%
Entry: 0.06876 ⌁ 0.06876
• ⎿ Current market price: 0.06874
Stop: 0.06212 (-9.66%)
Technical indicators:
Big cup and handle pattern (thats repeating accross a lot of alts), solid bullish RSI and little overhead resistance.
• ⎿ 24h Volume: 8112389.17747
• ⎿ Satoshis: 0.06876
• ⎿ Analysis: TradingView

Promising This is a late stage defi launch with terrible timing for the initial investors. Their loss is now our gain as the token is primed to 3X quickly and do much more after the halving.

TRUUSDT.PTRUUSDT.P is just entring the bearish trend.
bearish divergence also shown in RSI.
We wait and watch for the breaout of last LL>

TRUUSDT(TrueFi) Bullish Bias UpdateSo based on the chart, the wave count show us that we are still in a wave 1 cycle, currently just completed wave 4 correction cycle, now expecting wave 5 cycle from the current price up to complete wave 5 of wave 1 then a correction from those Highs to create new lows wave 2 will be expected.
this might be a 10X gem..

TRU ANALYSIS🔮 #TRU Analysis - Breakout 🚀🚀
💲💲 As we can see that there is a formation of Descending Triangle Pattern in #TRU and trying to breakout the descending trendline.If #TRU breakout and sustains the higher price then we will see a bullish trend. 📈📈
💸Current Price -- $0.05822
📈Target Price -- $0.08617
⁉️ What to do?
- We have marked crucial levels in the chart . We can trade according to the chart and make some profits. 🚀💸
🏷Remember, the crypto market is dynamic in nature and changes rapidly, so always use stop loss and take proper knowledge before investments.
#TRU #Cryptocurrency #DYOR

TRUUSDT 3D#TRU is broken out the descending trend line on 3-days timeframe. Price can easily get doubled in mid-term. You can see the targets on chart.

TRU/USDT Ready for an Explosive Journey? 👀🚀TRU Analysis💎Paradisers, let's take a closer look at #TRUUSDT, where the current trends indicate a viable opportunity for a bullish resurgence from its essential support zone.
💎A review of #TrueFi's latest market trajectory reveals a profound 79% reduction from its recent high. Yet, the determination at the support level of $0.04675 suggests a doorway to an upward movement.
💎Despite the hurdles in achieving new highs or surpassing previous records, which has led to a temporary bearish sentiment, the $0.04675 level is pivotal for #TRU. This juncture is on the cusp of initiating a notable bullish wave with a fresh evaluation.
💎As forward-thinking traders, we're perpetually prepared with an alternative plan. If #TRU dips further from this support, we're poised for a bullish comeback starting from the secondary support at $0.034. It's imperative to acknowledge, however, that crossing below this point could indicate a deeper bearish trend.
💎Maintain adaptability in your strategies and keen observation of market trends, Paradisers. Your ParadiseTeam is vigilantly watching, ready to guide you through these evolving market scenarios.

Is TrueFi about to moon(10X)Is this Gem about to moon,
Correction complete, unless we see an extension of it but otherwise from the current price im bullish, been bullish on most alts, tokens.

TRU trade setup looks absolutely incredible!The current cup & handle setup that has been forming is absolutely incredible looking! The recent down-thrust looks to have formed the bottom foundation of the formation's handle. I'm waiting patiently for the price to retest the breakout level from the "Bitcoin Approval Rally.'
I will be putting a long position on in that area when my charts give me the signal. This trade setup would work better on a higher dollar/lower leverage entry vs. in my opinion as it will take some time for this pattern to play out to its finality. If you use leverage, make sure that you keep it reasonable (10 - 20x), and keep extra funds in your account to give you a larger spread from your Liquidation Price to assist you in avoiding that dreaded 4 o'clock liquidation candle the Market Maker's love to throw at us in the middle of the night while we're tucked into bed sawing logs.
Good luck!

TRU/USDT bullish horizons from demand? 👀🚀TRU Today Analysis💎 Paradisers, take note of the current dynamics in #TRUUSDT, indicating a setup for a bullish journey from its emerging demand zone.
💎 #TRU has recently undergone a notable pattern, where it swept liquidity above a resistance level before taking a downturn. Currently, having breached the support at $0.04937, we're eyeing a bullish momentum initiating from the lower demand zone at $0.04622. Should the price respect this zone and maintain a strong upward momentum, we anticipate a vigorous bullish move targeting higher resistance levels.
💎 In the constantly evolving landscape of cryptocurrency trading, flexibility and readiness for diverse market scenarios are crucial for #TRU traders. If the asset faces difficulty in sustaining its position at the current demand level, adapting our strategy to anticipate a bullish surge from a deeper support level at $0.04138 might be wise.
💎 Importantly, a descent below this support could signal a need for a strategic pivot, suggesting potential challenges in maintaining a bullish trajectory in the #TRU market.

TruFi just flashed a buy signal!TRU/TruFi has formed a clear cup & handle on the daily chart, and just flashed a clear buy signal on the hourly according to my personal trading perimeters. Although I'm not completely sold on this particular chart I would rate this trade a 7/10.

TRU moving down?As we see the buyers exhausted and no volume. I think we can reach upto that white line and till the target as reflected in the charts. DYOR

TRU USDTTRUUSDT Making a trend of crypto ... buy at support ( 1 Trand Line Support and send Price Suport ) buy at Support.... and Hold long ..

TRU Getting StrongerTruFi is another project i think is good to hold in this cycle.
As we can see it went up again in the last 12h
Even when BTC dropped earlier this day TRU was growing!
More signals bellow..
My targets on chart. 🎄
$TRu-DeFi timenot taking this but looks good to reverse and pop
invalidation below white line
refer to earlier HTF chart fro insane targets

TRUUSDT 1WA weekly cup and handle in formation.
4 hour time frame handle breakout done, retest pending. Buy now or on retest. Mega Pumpa Coming
Mangae your Risk

BINANCE:TRU/USDT - Did you miss this triangle breakout ?------------------------------------------------------------------------------------------
Description
------------------------------------------------------------------------------------------
+ A perfect triangle pattern formed for TRU/USDT
+ Upward breakout of the price confirmed after multiple rejection around the resistance line
+ Overall price is trending bullish and this is a good opportunity to enter a LONG trade.
+ This is a trade with tight stoploss, so be careful.
------------------------------------------------------------------------------------------
Signal
------------------------------
VectorAlgo Trade Details
------------------------------
Entry Price: 0.05847
Stop Loss: 0.05615
------------------------------
Targets 1: 0.05950
Targets 2: 0.06350
Targets 3: 0.06555
Targets 4: 0.06758
------------------------------
Timeframe:
Capital: 1-2% of trading capital
Leverage: 5-10x
------------------------------------------------------------------------------------------
Note: Don't forget to keep the stop-loss.
------------------------------------------------------------------------------------------
Agree or Disagree with the ideas ? lets discuss in the comments.
Like and follow us for more ideas.
Regards


Truefi $TRU Fundamental and Technical play1. Overall Trend: The chart shows that NYSE:TRU has been in a general downtrend, as indicated by the descending trendline connecting the series of lower highs. However, more recently, there seems to be an upward movement suggesting a potential trend reversal.
2. Support and Resistance: The horizontal lines represent potential support and resistance levels. These are price points where the price has historically found a floor (support) or ceiling (resistance) and reversed direction.
3. Recent Price Action: The price has recently broken above the descending trendline, which is typically considered a bullish signal. If the price can maintain above this line, it might suggest a change in the underlying market sentiment.
4. Volume: The volume seems to be stable or slightly increasing with the recent price rise. Increasing volume during a price rise is often interpreted as a confirmation of the upward trend.
5. Potential Reversal Indicators: The break above the descending trendline and the formation of what appears to be higher lows and higher highs on the most recent price movements could indicate a reversal from the prior downtrend.
6. Future Price Trajectories: The diagonal lines that extend into the future suggest potential trend lines or targets. If these represent anticipated support or resistance levels, the price may experience significant interaction at these points.

TrueFi 400% gains?TrueFi 400% gains?
TrueFi all-time-high at $0.70.
Currently trading at $0.056.
When the bulls buy the breakout could fomo quickly
Stoch Rsi Bullish
Rsi Neutral
Macd Neutral

TrueFi 400% gainsTrueFi 400% gains?
TrueFi all-time-high at $0.70.
Currently trading at $0.056.
When the bulls buy the breakout could fomo quickly
Stoch Rsi Bullish
Rsi Neutral
Macd Neutral
