TRUUSDT trade ideas

TrueFi TRU long medium-term trade #20Today our attention was drawn to TrueFi TRU. We think we understand the logic of the behavior of buyers and sellers in this asset.
So, let's try to take a position for a medium-term trade on the following conditions:
Entry: in the range of $0.034-0.0358 (the desired average price is $0.0349)
Stop: $0.0318 (-8.88%)
Take profit: $0.0628 (+80%)
P/L ratio - 9/1
We allocate $5,000 for TRUUSDT trade, because the coin is highly volatile
In the event of a mistake, we will lose $450
If the trade will be a success, we will receive a profit of $4000

TRUU READY FOR THE HISTORY WHALE INCREASE TRUU seems on a very interesting level for the next high break.
Showing high incoming volume.
Soon more.
For the day trading manage always risk.
Trading with not SL means not trading.

📊#TRU 's potential smiley put structure, worth keeping an eye🔥🧠With the end of the rally, we have formed a potential smiley bearish structure in the consolidation process, and if this bearish structure holds, there is a high probability that we will reach the buying area. A healthy pullback makes the next rally more explosive.
Let's see👀
🤜If you like my analysis, please like 💖and share it💬
💕 Follow me so you don't miss out on any signals and analyze 💯


Trade signal | TrueFi (TRU) is ready for the next pumpHi dear friends, hope you are well and welcome to the new trade signal of TrueFi (TRU) with US Dollar pair.
Recently we caught almost 71% pump of TRU as below:
Now on a 4-hr time frame, TRU has formed a bullish Cypher for the next pump.
Note: Above idea is for educational purpose only. It is advised to diversify and strictly follow the stop loss, and don't get stuck with trade.

$TRU formed a great cup and handle.Breakout of the cup and handle pattern is completed. Following of a retest is possible. After the retest is completed the upward movement will continue if everything goes along.

TRU/USDT bullish ride? 👀 🚀 TRU Today analysis💎 Paradisers, gear up to delve into TRUUSDT as it showcases a captivating trajectory within the demand zone, hinting at a heightened likelihood of an upward trend.
💎 Following its recent breakout from the descending channel trendline, TRU is poised with the potential to approach the supply level at .03760.
💎 The VRVP's diminished volume at this juncture suggests a probable continuation of the bullish trend from the demand zone at .03460, where a surge in volume indicates a potential pivot in momentum.
💎 On the flip side, should the price descend below the demand zone, the scales tip towards increased chances of a bearish shift. Stay attuned to these evolving dynamics!

RR=3 buy ideaprice bounced on support level and ended up breaking above the top of the falling wedge pattern and the inverted head and shoulders's neckline + price formed a bullish bat pattern + strong RSI divergence
PS never risk more than 2% of your capital per trade
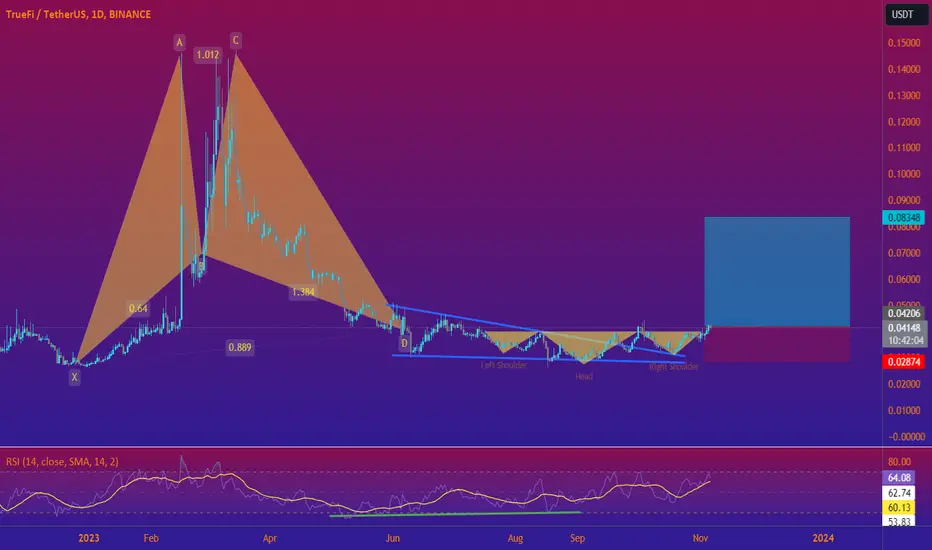
TRU/USDT 1D. Secondary trend. Local accumulation range.TrueFi/USDT 1D. Local and secondary trends.
In the main trend - downtrend channel was formed. You can check this if move chart to the left in the main idea.
This channel was broken up in winter 2023, when there was local pump on all crypto market.
At that time, price pumped 360% to 0.13$ zone and from the the pullback has started. It formed quite an aggressive downtrend, which has been broken Jun 2023.
After that falling wedge started to form. The support lvl was formed at 0.0323$, while the decline lasts for 232 days as for now, just an interesting point.
Price formed the range with, as already mentioned, support at 0,0323$ and resistance at 0,0392$(14 - which is "balance").
Price has deviated this ranged locally - reaching the minimums of winter 2022-2023 - then turning back to the range. Now, the price is near the resistance zone locally.
During all that secondary downtrend we've seen 2 volume spikes - 1 on Jun 1 2023, other on Aug 21. As for now the price is consolidating in quite a small range of 25%. It has also broken the resistance of the falling wedge locally.
All the details are on chart. If market allows - locally we can reach the middleterm resistance zone, shown on chart. It's 0.0609$ to 0.0777$ zone. Very logical resistance in terms of numbers.
It may happen only if we break and hold above 0.0392$ lvl zone(current range resistance). Everything is with accordance to the market tendency.
Linear chart is for the clarity(no shadows of candles). Percent to the resistance zones are shown.
There has been also the retest of the broken local falling wedge(on chart).

TRUUSDTTRUUSDT is in strong bullish trend.
As the market is consistently printing new HHs and HLs.
currently the market is retracing a bit after last HH, which is also the 50% fib retracement level and local support as well. if the market successfully sustain this bullish confluence the next leg high could be 0.0440.

TRUUSDT Breakout Confirmed!TRUUSDT Technical Analysis Update
Buy zone: Below $0.0405
Stop loss: $0.0384
Take Profit 1 : $0.0435
Take Profit 2 : $0.0465
Take Profit 3 : $0.0520
Thanks
Hexa

truusdt-mentoringtruusdt-no more fundamental thoughts - only speculating
weekly - RR possibale 3.5x formating W pattern
look for small long scalps until 374
look for small short scalps until 287
look for short if rejects and close under 374
look for long if close above 394
look for long if retrace from 287
look for short if close under 264
***
Tolerance will reach such a level that intelligent people will be banned from thinking so as not to offend the imbeciles- F.M.dostoyevsky

TRU new bull run has startedHello Traders,
As you can see on the chart, We have two bullish patterns: Double bottom and falling wedge.
Let's revisit this idea a few months later ;)
Please hit the boost button and follow me for more ideas.
Thanks

Preparing for a high movePreparing for a high move.
It looks like the coin has finished falling.
Let's hope he flies up!

#TRUUSDT's Potential Uptrend with Fibonacci Play💎Today's spotlight is on #TRUUSDT. The token has recently anchored its support at the $0.030 mark, aligning nearly perfectly with the 78.6% Fibonacci retracement level. Before this stabilization, #TRU sketched out a double bottom pattern. This pattern, followed by a surge past the local resistance, hints at a possible trend reversal.
💎 What does this mean for traders? The scales now seem to tip towards an upward correction. As long as the price stays comfortably above the double bottom region, specifically above the $0.026 trough, we can anticipate a robust upward pullback.
💎 On the resistance front, our eyes are set on another 78.6% Fibonacci retracement level at $0.037. This level intriguingly mirrors the downtrend trendline, making it a key point of interest.
💎 However, a word of caution: The MCP team remains vigilant about today's low, marked by the Fibonacci bounce. A descent below this point might cast shadows on the prospective upward correction.


TrueFi (TRU) - Bullish divergence On the above daily chart price action has corrected 95% since last August. A number of reasons now exist to be long, including:
1) The ‘incredible buy’ signal prints.
2) Regular bullish divergence. 10 oscillators are currently printing bullish divergence over a 30 day period.
3) Price action and RSI resistance breakout. Look left!
4) Everything that was said above holds true for the daily BTC pair (below).
5) On 'what if' list. Don't know what I mean? Shame.
Is it possible price action falls further? For sure,
Is it probable? no.
WW
Ps, not trading this. If I have time, ask below for updates.
Type: trade
Risk: <=6% of portfolio
Timeframe: 1 to 3 months, seriously.
Return: 10
1-day BTC chart
What if chart

$Tru is still Looks beautiful All the Low cap Coin bounce NYSE:TRU is still Looks beautiful All the Low cap Coin bounce TRU has not pumped strongly.
NYSE:TRU gains good following from this region with a lot of potential than I gave 0.0280 0.0307 contradicts support. It will be like that until we break the resistance .0.0363 with high volatility.


Tru Getting Ready For Massive Bullish Rally Seems Like getting Ready for Massive Recovery Formed Falling Wedge In Daily Tf And Trying To Break It Incase Of Breakout Expecting Massive Bullish Rally Incase Of Successful Breakout Expecting 100 to 110% Bullish Wave

TRUUSDT Short ideaLooking for a deviation out of this channel to take some liquidity then head back down. Got a nice high volume area with the point of control of the impulse lining up with this deviation Fibonacci level.

TRU LOOKS VERY BULLISH (1D)It has a good chance to pump. I specified the place of buy/long
Note: This symbol is small in volume, you must not forget capital management and stop setting
