TRXBTC trade ideas

TrxbtcHi. I think we are at the end of the path and soon the trx will come out from under the shadow of the bit and we will see a strong pump in it.

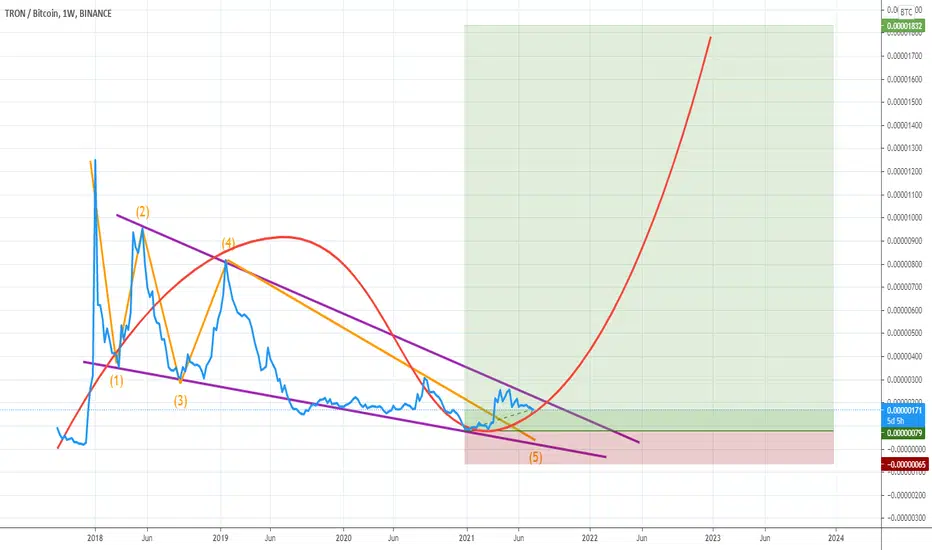
TRON - 3.5 Year Bullish Wedge Near Completion, Get Ready!TRX isn't on many radars as it has been pretty dormant the past couple years, but long periods of low volatility often lead to powerful spikes. You can see the falling wedge in pink that TRX has been bounded by the past couple years. But Bitcoin's latest surge has brought some life to alts and has TRX knocking on overhead resistance. You can see that the weekly MACD is very bullish as it finds support above the zeroline. Once resistance is broken, I think TRX will go crazy. Barring a BTC collapse, I think Tron is poised for a massive breakout. I know the volatility TRX brings (see Dec 2017), so I'm making sure I'm on this rocket ship before it takes off!

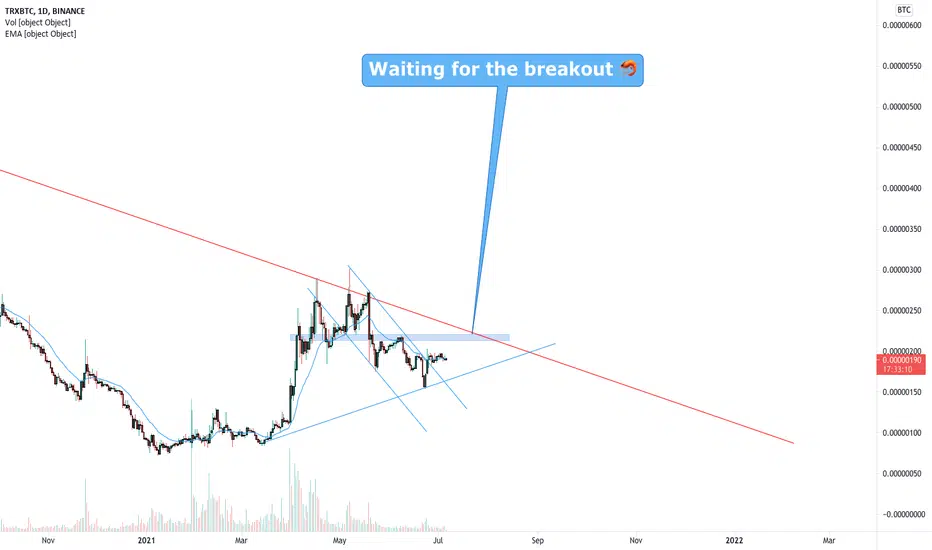
Justin Sun's TRON vs Bit's Coinwaiting for one more leg, something like this
pretty much neutral, it can go sideways for days still, I'M LONG and praying lmao.
let's go Justin!!


👀🔥Lets see what happen 🤠 i think it can touch the target in long term if u dont have patience dont buy it 😜if u want to buy in low risk wait until break the resistance and after poolbAck on it u can buy


TRX/BTC chartTRX/BTC chart is breaking the descending trend and next resistances are 0.00000279 and 0.00000404


Cup and Handle breakout .. Target 450+TRON Cup and Handle breakout .. Target 450+
Time frame two months...

TRX/BTC SHORT SETUPWe should see BTC make a decisive move one way or the other by the end of the week. If the epic rally continues and BTC Dominance climbs higher, Alts will bleed.
Conversely, if BTC consolidates and BTC dominance falls, this setup will be invalidated or take much longer to play out.
TRX is in a downtrend. Chart is pretty self explanatory. TRX has lost the major MA's and is approaching a zone of historically low volume, in which it shouldn't encounter much support on the way down.
I want to see more volume come in to support this downtrend idea.... Any whales reading this, you know what to do ;)
Time to leverage up bois!!
happy trades,
- CD

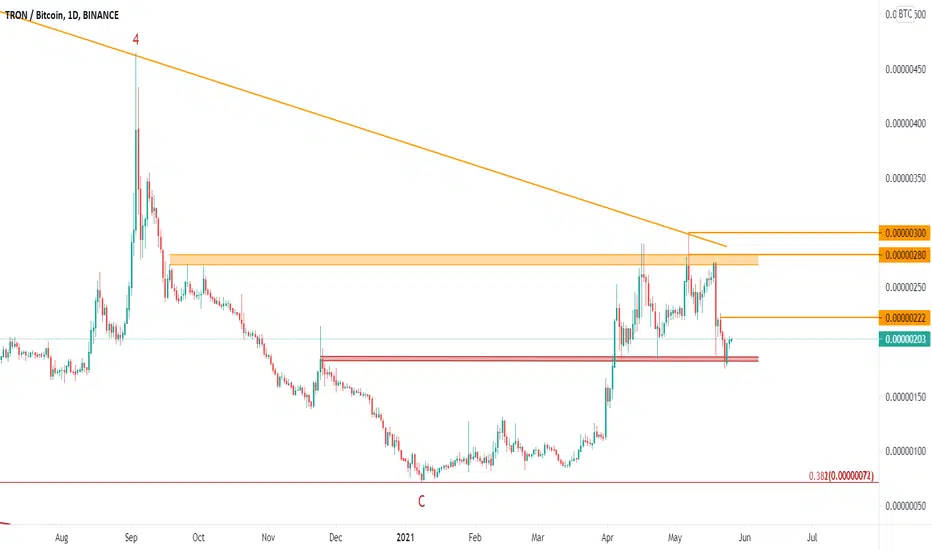
TRXBTC Sell SignalThe price is trading within the 1D MA50 (blue trend-line) and 1D MA200 (orange trend-line) since May 19. A Death Cross is emerging and the patterns looks similar to that of May 2019. If that continues to play out, a test of the 2021 low is expected.
** Please support this idea with your likes and comments, it is the best way to keep it relevant and support me. **
--------------------------------------------------------------------------------------------------------
!! Donations via TradingView coins also help me a great deal at posting more free trading content and signals here !!
🎉 👍 Shout-out to TradingShot's 💰 top TradingView Coin donor 💰 this week ==> CryptoCreatin
--------------------------------------------------------------------------------------------------------

TRXBTC had a breakout from descending channel 🦐TRXBTC had a breakout from descending daily channel, and now the price is below the daily structure.
IF the price will have a breakout from the daily resistance and weekly trendline, According to Plancton's strategy (check our Academy), we can set a nice order
–––––
Follow the Shrimp 🦐
Keep in mind.
🟣 Purple structure -> Monthly structure.
🔴 Red structure -> Weekly structure.
🔵 Blue structure -> Daily structure.
🟡 Yellow structure -> 4h structure.
⚫️ Black structure -> <4h structure.
Here is the Plancton0618 technical analysis, please comment below if you have any question.
The ENTRY in the market will be taken only if the condition of the Plancton0618 strategy will trigger.
TRXBTC - Daily ChartWe have a possible inverse head and shoulders pattern on the daily chart!
If you would like to get updates and see more idea's, please push the follow button :)
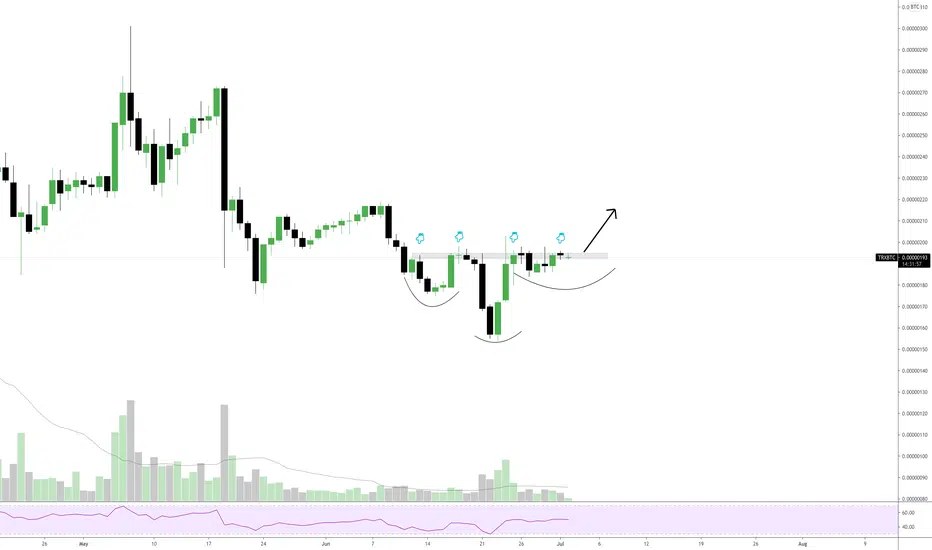
#TRX, Similar to many other alts, showing accumulation over supp#TRX
Similar to many other alts, showing accumulation over support..
Willing to see if it has enough traction (volume) to print a green bar toward ~215 sats (10%)
UCTS turning bullish on 12H & lower timeframes...
$TRX

TRX/BTCBull flag formed on 4h time frame , looks ready to rip .
Target on chart , SL 4h close below 185.

$TRX/BTC 4h (Binance Spot) Descending broadening wedge breakoutTron has broken out bullish locally and looks ready to continue upwards after that 100EMA retest!
Current Price= 0.00000191
Buy Entry= 0.00000190 - 0.00000184
Take Profit= 0.00000205 | 0.00000219 | 0.00000237
Stop Loss= 0.00000172
Risk/Reward= 1:1.2 | 1:2.13 | 1:3.33
Expected Profit= +9.63% | +17.11% | +26.74%
Possible Loss= -8.02%
Fib. Retracement= 0.786 | 1 | 1.272
Margin Leverage= 1x
Estimated Gain-time= 2 weeks

Tron (TRX) formed bullish Shark| for upto 22% moveHi dear friends, hope you are well and welcome to the new update on Tron ( TRX ).
Previously we have seen that the price action of TRX is moving in the buying zone of a bullish Gartley in the daily time frame chart.
Now at the same time on the daily chart , with BTC pair the price action of Tron has also formed a bullish Shark pattern. After visiting the buying zone it is moved up. But it is possible that it may give us another chance to catch it from the buying zone.


TRX/BTCIf Zoom At The Chart Clearly We Can See a Horizontal Channel (180 As a Support, 280 As a Resistance) ,We Expect The Price Will Breakout From This Channel Soon ,Here Is a Good Buy Opportunity.
If you liked my idea, follow me for more 🚀

Here Is a Good Buy Opportunity📍 By The Overall View The Main Pattern Is Descending Channel Which Started Since Jan 2018 ,Now The Price Is Ready To Breakout From The Trend Line ,If This Breakout Happen We Could Say New Impulsive Trend Is Started
🔍 Let’s Analyze TRX By Closer View : If Zoom At The Chart Clearly We Can See a Horizontal Channel (180 As a Support, 280 As a Resistance) ,We Expect The Price Will Breakout From This Channel Soon ,Here Is a Good Buy Opportunity