TRXBULLUSD trade ideas

TRXUSD OpportunitiesTRXUSD remains bullish as structure keeps creating higher highs and higher lows. Look around the marked areas for 4 hour candles rejections. As long as price respects marked area, buy opportunities could be taken.

TRX/USD alt party !!!!!!!!!!!!!!!!!!!"This is just a personal opinion."
But if we are optimistic and the situation goes according to analysts' forecasts, we will see an increase in market volume and the volume of TRX transactions.
Our goal for the next season is last ATH ( 0.30$)

TRXUSD Great opportunity to go longTRX opportunity is possibly about to finish the current expansion that is doing and most likely would start retracing between today and tomorrow. Look for the marked areas. If price manages to reject multiple times marked area on the 4 hour chart, then it would be a great opportunity to go long and target the 1.27 or 1.618 fib area.

Tron at Resistance Hello Traders
On the H4 chart for Tron we are Rising to Resistance area.
It is likely for us to have some Price consolidation in the area before we can have another Bullish Candle up. Im still looking Bullish for Tron.
Stay with the markets, Lets go

TRX - Potential Bullish Reversal!Hello everyone, if you like the idea, do not forget to support with a like and follow.
TRX is sitting around a strong demand zone in green so we will be looking for buy setups.
Before we buy, we want the buyers to prove that they are taking over again.
You don't want to buy a bearish market right?
on H4: TRX is forming an inverse head and shoulders pattern but it is still an idea. so we are waiting for the right shoulder to form to consider it valid. (projection in purple)
Trigger => Waiting for the right shoulder to form and then buy after a momentum candle close above the gray neckline. (from Daily Timeframe)
Meanwhile, until the buy is activated, TRX would be overall bearish can still trade lower.
Good luck!
All Strategies Are Good; If Managed Properly!
~Rich

Tron (TRX) - August 4Hello?
Welcome, traders.
By "following", you can always get new information quickly.
Please also click "Like".
Have a nice day.
-------------------------------------
(TRXUSD 1W Chart)
If the price holds above the 0.03074453-0.04413840 range, it is expected that the uptrend will continue.
(1D chart)
If the price is maintained in the 0.05118284-0.07253780 range, it is expected to turn into an uptrend.
If the price holds above the 0.07253780 point, I would expect it to reorient itself in the range 0.09389276-0.10457024.
If the price falls in the range of 0.04050536-0.05118284, there is a possibility of entering the mid- to long-term investment area, so careful trading is required.
-------------------------------------
(TRXBTC 1W Chart)
If the price is maintained above the 259 Satoshi point, it is expected to create a new wave.
(1D chart)
If the price is maintained in the range of 168 Satoshi-199 Satoshi, it is expected to turn into an uptrend.
If it falls in the 121 Satoshi-137 Satoshi range, it is possible to enter the mid- to long-term investment area, so careful trading is required.
------------------------------------------
We recommend that you trade with your average unit price.
This is because, if the price is below your average unit price, whether it is in an uptrend or in a downtrend, there is a high possibility that you will not be able to get a big profit due to the psychological burden.
The center of all trading starts with the average unit price at which you start trading.
If you ignore this, you may be trading in the wrong direction.
Therefore, it is important to find a way to lower the average unit price and adjust the proportion of the investment, ultimately allowing the funds corresponding to the profits to regenerate themselves.
------------------------------------------------------------ -----------------------------------------------------
** All indicators are lagging indicators.
Therefore, it is important to be aware that the indicator moves accordingly with the movement of price and volume.
However, for the sake of convenience, we are talking in reverse for the interpretation of the indicator.
** The wRSI_SR indicator is an indicator created by adding settings and options to the existing Stochastic RSI indicator.
Therefore, the interpretation is the same as the traditional Stochastic RSI indicator. (K, D line -> R, S line)
** The OBV indicator was re-created by applying a formula to the DepthHouse Trading indicator, an indicator disclosed by oh92. (Thanks for this.)
** See support, resistance, and abbreviation points.
** Support or resistance is based on the closing price of the 1D chart.
** All descriptions are for reference only and do not guarantee a profit or loss in investment.
Explanation of abbreviations displayed in the chart
R: A point or section of resistance that requires a response to preserve profits.
S-L : Stop Loss point or section
S: A point or section where you can buy to make a profit as a support point or section.
(Short-term Stop Loss can be said to be a point where profit and loss can be preserved or additional entry can be made through split trading. It is a short-term investment perspective.)
GAP refers to the difference in prices that occurred when the stock market, CME, and BAKKT exchanges were closed because they are not traded 24 hours a day.
G1 : Closing price when closed
G2: Opening price
(Example) Gap (G1-G2)

TRON (TRX) between theory and practiceTRON (TRX) is in a DOWNTREND BEAR FLAG and from which he seems to want to get out of this flag through an ascending channel.
The theory is that the bear flag should still come down.
We will see. Anyway, TRX will move between $ 0.50 and $ 0.67 for now.

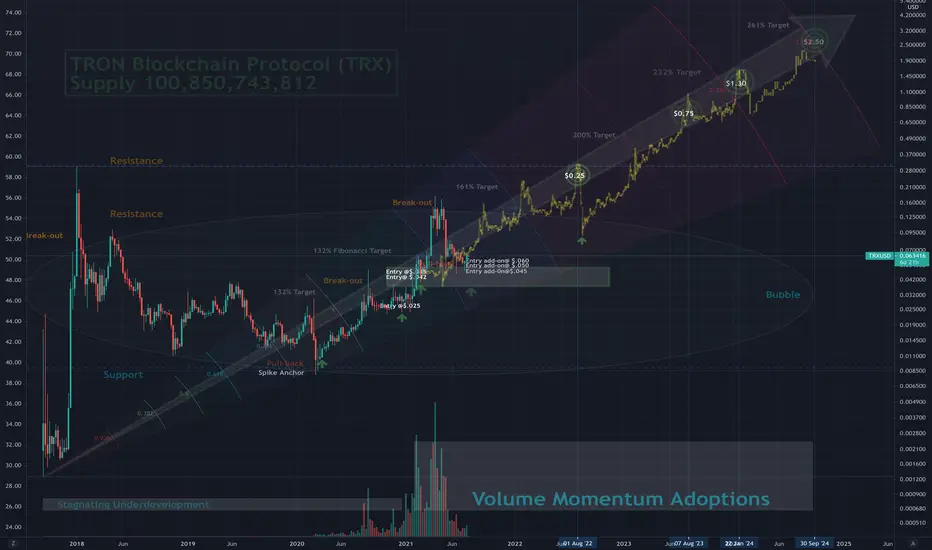
Entry TRX@ $0.060 Target@ $2.50 Sept 30, 2024 UpdateTron Token (BlockChain)
Entry TRX@ $0.060 Target $2.50 Sept 30, 2024 Long Term
Entry TRX@ $0.050 Target $1.30 Jan 22, 2024 Long Term
Entry TRX@ $0.045 Target $1.30 Jan 22, 2024 Long Term
Entry @$0.042 Target $0.60 July 2, 2022 Short Term
Entry @$0.036 Target $1.30 Jan 22, 2024 Long Term
Technical Chart Analysis Conditions:
1. Break-out of Channel $0.20
2. Pull-back towards $0.04
3. Ideal Entry @ $0.45 to $0.70
4. Target@ $0.25 to $2.50 Range
Fundamental Asset Descriptions:
High throughput is achieved by improving the TPS in TRON,
which has surpassed Bitcoin and Ethereum , to a daily-use practical degree. High-scalability.
Supply 100,850,743,812
Project Website: tron.network
Kraken Exchange: trade.kraken.com
Trx Long Idea-Potential 100-200% gainI am not a fan of the Tron Foundation or Justin Sun by any means, but when I see a good trade I take it.
This trade is highly dependent on Bitcoin maintaining a steady price action and not crapping the bed.
As you can see by the chart $TRX is currently attempting to break out of a multiweek declining channel, I highlighted the $.065 level in green at a breakout confirmation level that I am watching very carefully. I would recommend setting alerts at that level if you arent comfortable shorting just yet and would like to see a guaranteed break out.
Other key levels are highlighted and labeled, feel free to take profit at any level you please, and don't get greedy.
If you have any questions feel free to ask away in the comments and ill get back to you when I have time :)
Have a blessed day everyone!
-


TRON Long Term View Possible 1-3-5 with growth cycles mapped in grey horizontal lines with prices on the line.
Rounding bottom pattern forming the swing low, confirmation based on whether the bullish volume is correct and price moves higher, confirming the rounding bottom as the actual bottom.
Risk is that TRON just stops acting sending the perceived value to zero.

TRON Price Range Targets for Early 2022An idea for TRON
Top channel band suggests $16 which is a massive increase from the current 0.05
Middle channel band suggests $2 which is also a huge increase
Both of these scenarios make sense, the top band was where price hit in 2017
Time will tell if it repeats
I have used a sort of 'quasi' channel to identify these ranges
Also some funky trend lines included to support this channel idea !


Bullish Bat with Bullish Divergence on DailyWe have bullish divergence on both the RSI and MACD at an 0.886 retracement.
I will buy between the 0.786 and 0.886 and put my stoploss below 28 cents.
I will be aiming for 15-18 cents for profit taking.

Tron (TRX) - July 16Hello?
Welcome, traders.
By "following", you can always get new information quickly.
Please also click "Like".
Have a good day.
-------------------------------------
(TRXUSD 1W Chart)
If the price holds above the 0.04413840 point, it is expected that the uptrend will continue.
(1D chart)
If the price is maintained in the 0.05118284-0.07253780 range, it is expected to turn into an uptrend.
If it falls in the range of 0.04050536-0.05118284, there is a possibility of entering the mid- to long-term investment area, so careful trading is required.
-------------------------------------
(TRXBTC 1W Chart)
If the price is maintained above the 194 Satoshi-259 Satoshi section, it is expected to create a new wave.
(1D chart)
If the price is maintained in the range of 168 Satoshi-199 Satoshi, it is expected to turn into an uptrend.
To continue the uptrend, it needs to rise above the 215 Satoshi point.
If it falls from the 168 Satoshi point, it can touch the 121 Satoshi-137 Satoshi section, so careful trading is required.
------------------------------------------
We recommend that you trade with your average unit price.
This is because, if the price is below your average unit price, whether it is in an uptrend or in a downtrend, there is a high possibility that you will not be able to get a big profit due to the psychological burden.
The center of all trading starts with the average unit price at which you start trading.
If you ignore this, you may be trading in the wrong direction.
Therefore, it is important to find a way to lower the average unit price and adjust the proportion of the investment, ultimately allowing the funds corresponding to the profits to regenerate themselves.
------------------------------------------------------------ -----------------------------------------------------
** All indicators are lagging indicators.
Therefore, it is important to be aware that the indicator moves accordingly with the movement of price and volume.
However, for the sake of convenience, we are talking in reverse for the interpretation of the indicator.
** The wRSI_SR indicator is an indicator created by adding settings and options to the existing Stochastic RSI indicator.
Therefore, the interpretation is the same as the traditional Stochastic RSI indicator. (K, D line -> R, S line)
** The OBV indicator was re-created by applying a formula to the DepthHouse Trading indicator, an indicator disclosed by oh92. (Thanks for this.)
** See support, resistance, and abbreviation points.
** Support or resistance is based on the closing price of the 1D chart.
** All descriptions are for reference only and do not guarantee a profit or loss in investment.
Explanation of abbreviations displayed in the chart
R: A point or section of resistance that requires a response to preserve profits.
S-L: Stop Loss point or section
S: A point or section where you can buy to make a profit as a support point or section
(Short-term Stop Loss can be said to be a point where profit and loss can be preserved or additional entry can be made through split trading. It is a short-term investment perspective.)
GAP refers to the difference in prices that occurred when the stock market, CME, and BAKKT exchanges were closed because they are not traded 24 hours a day.
G1 : Closing price when closed
G2: Opening price
(Example) Gap (G1-G2)


Will Tron revisit 0.047?Like all the crypto market, Tron is also in a clear downtrend. Yesterday the coin has broken under support and the road is clear for a 0.047 drop
Sell rallies is my strategy

How to predict the market moves easily by Forecast indexHello traders!
everyone wants to know where market will go at future, by Forecast index you can easily realize if the price can maintain its trend or not
Forecast index consisted of trend momentum, trend volume and trend strength which identify future trend reverses
Forecast index show you future trend revers by its direction before of every trend reverses , Forecast index change its direction faster than price.. which we call it miracle!
its work properly on every chart and time-frame, it becomes a bless at long term trends...
to purchase this indicator leave a comment below of this post... Thank you!
1-month= 99$
3-months= 249$
lifetime access=440$
***also you have 3-days free trail***


Tron (TRX) - June 29Hello?
Welcome, traders.
By "following", you can always get new information quickly.
Please also click "Like".
Have a good day.
-------------------------------------
(TRXUSD 1W Chart)
It remains to be seen if it can move above the 0.07500028 point to continue the uptrend.
(1D chart)
We will have to hold the price in the 0.05118284-0.07253780 range to see if it can turn into an uptrend.
If it goes down, you should see support at the 0.04050536-0.05118284 zone.
-------------------------------------
(TRXBTC 1W Chart)
If the price holds above the 259 Satoshi point, it is expected to create a new wave.
(1D chart)
We'll have to see if we can get support by going up to the 199 Satoshi-215 Satoshi section.
If it goes down, it should find support at the 168 Satoshi point and see if it can move up along the uptrend line.
In order to turn into an uptrend, it needs to rise above the 194 Satoshi point to find support.
------------------------------------------
We recommend that you trade with your average unit price.
This is because, if the price is below your average unit price, whether it is in an uptrend or in a downtrend, there is a high possibility that you will not be able to get a big profit due to psychological burden.
The center of all trading starts with the average unit price at which you start trading.
If you ignore this, you may be trading in the wrong direction.
Therefore, it is important to find a way to lower the average unit price and adjust the proportion of the investment, ultimately allowing the funds corresponding to the profits to regenerate themselves.
------------------------------------------------------------ -----------------------------------------------------
** All indicators are lagging indicators.
Therefore, it is important to be aware that the indicator moves accordingly with the movement of price and volume.
However, for the sake of convenience, we are talking in reverse for the interpretation of the indicator.
** The wRSI_SR indicator is an indicator created by adding settings and options to the existing Stochastic RSI indicator.
Therefore, the interpretation is the same as the traditional Stochastic RSI indicator. (K, D line -> R, S line)
** The OBV indicator was re-created by applying a formula to the DepthHouse Trading indicator, an indicator disclosed by oh92. (Thanks for this.)
** See support, resistance, and abbreviation points.
** Support or resistance is based on the closing price of the 1D chart.
** All descriptions are for reference only and do not guarantee a profit or loss in investment.
Explanation of abbreviations displayed in the chart
R: A point or section of resistance that requires a response to preserve profits.
S-L: Stop Loss point or section
S: A point or section where you can buy to make a profit as a support point or section.
(Short-term Stop Loss can be said to be a point where profit and loss can be preserved or additional entry can be made through split trading. It is a short-term investment perspective.)
GAP refers to the difference in prices that occurred when the stock market, CME, and BAKKT exchanges were closed because they are not traded 24 hours a day.
G1 : Closing price when closed
G2: Opening price
(Example) Gap (G1-G2)

TRON Blockchain Protocol Entry Zone Trending SignalTRON Blockchain Protocol Entry Zone Trending Signal
Do your own due diligences
This Chart Navigation Analysis is for my tracking Position Purpose only....
Entry Area@ $0.036 to $0.060 Cost Averaging
Target Area@ $0.75 to $1.30 Long Term
Stop-loss@ Diamond Hand To the Moon
Project Descriptions
TRON is an ambitious project dedicated to building the infrastructure for a truly decentralized Internet.
The TRON Protocol, one of the largest blockchain-based operating systems in the world.
Project Circulating Supply 71,660,220,128 / 100,850,743,812
