$TRX ANALYSIS$TRX USDT.
We’re still trading under this riding wedge and nothing has changed since our last update.
TRXBULLUSD trade ideas

TRX likely to push up a little We are likely to go long on TRX once the current resistance is broken, watch and DYOR

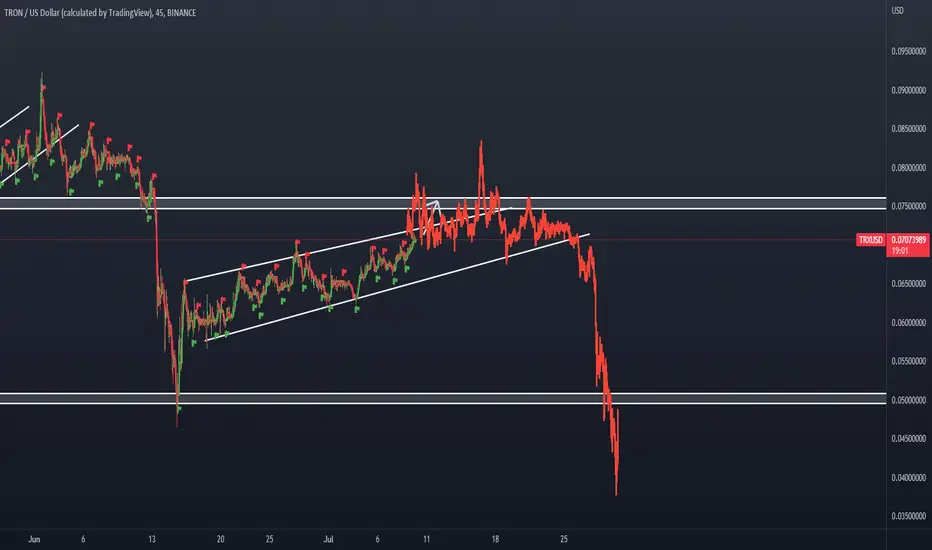
trx shortintuition suggests accumulating position at this mid upper part of range
weakness in recent uptrend suggest liquidity at a lower price likely, tight stop and profit at .04450

TRX SELL VIA FIBTRX
SELL. Testing the harmonic strategy with fib retracement
sell according to fib 0.618 tp 0.5 as tp
Hope this will work. also the bias is sell.
Goodluck.

TRXUSD to new ATH before 2023.As you can see Tron has triple bullish Div as well as triple bottoming. Look out! ATH for TRx before 2023.

TRXUSD ❕ 6 unsuccessful breakout attemptsAfter unsuccessful attempts to break the downtrend line TRX tests 50EMA as resistance (1H TF)
Trading volumes have declined and the price has approached the lower boundary of the uptrend channel.
I expect a fall after the price fixes under the lower boundary of the channel.

TRX looks really bad if neckline breaksWe've got a descending triangle pattern printed waiting breakout for confirmation.
TRX looks really bad if neckline breaks.
It can go down as much as 75% from the point of the potential breakout, this could imply that USDD could also go bust as Justin Sun fails in saving FTX and end up being the last man boarding titanic.
###NOT FINANCIAL ADVICE###

TRONUSD: Logscale AB=CD Potential Breakout ProjectionIf Tron Breaks out of this Consolidation Pattern on the Weekly/Monthly we could see it begin an ABCD BAMM to Finish off an AB=CD Projection on the Logscale Chart that would take it up to the 2.618 Fibonacci Extension Above.

Tron converging perfectly to this point! What's going to happen?There's not much room left for Tron (Trx) before we see a breakout. Let's get ready to rumble!!
12th December deadline! Expect breakout to occur before then!

US Rate Rise - How It Translates On The Top-10THE US had a rate hike which was as expected and yet we still see the charts go crazy, not just bitcoin but most of the top-10.
The one surprise was that inflation did not drop at the rate it was forecast to do. The drop was 0.1% and not 0.3% as expected.
So where to from here?
Well that depends on how we close this 24-hour range and if we can take the high of that candle out. We are not out of the pain zone just yet and I am waiting for a push to $22,000 for bitcoin to get that daily trend with some proper momentum. We haven't seen a daily trend on bitcoin that was more than a bear bounce since March 2021 so to see one now will give us cryptotraders plenty of options to work with so long as it's not in a single candle.

The upside potentiality of Trx is mind blowing 🤯 If there were any time to buy Trx, then it would be the most opportunistic moment right now. The risk to reward ratio is somewhere in the range of 20,000% from where we currently are in the price.
I really don't see Trx going any lower. Buy and hold all, we're in for an interesting roller-coaster ascent 🎢

Trx still trading in the Zone!It's amazing how accurate these signals are pushing upwards along the trend line based on previous signals. Still a danger Trx can fall downward, but it would be a temporary setback that I believe would recover in quick time if we see that scenario.
So therefore I'm still bullish for Tron! We have so much upside potentiality that it's long overdue.
I'm surprised not many people talking about Tron when it has such a large Asian and worldwide market! This is already Eth 2.0.

Tron on the verge of breakout now!We're at a pinnacle point right now and whether Tron will explode upwards, keep going sideways or fall to the downside. Something's about to give! Getting exciting!!!

TrxUsdthe price will test the support level $0.045 and then it will start to rise, the resistance levels it will reach are first $0.18 and then on breaking the level of $0.195 the next resistance is $0.31


TRXUSD Bull BiasThe chart pattern formed before the bars pattern is acting both as a symmetrical triangle and a bullflag
This can lead to a massive jump in price very quickly
The bear market hasn't even made a dent in the prices formation of this structure
I expect this from TRON aswell, being a large and relatively popular blockchain
Things like this can happen
Weekly chart


TRX Year-Long Triangle Concluding (Elliott Wave/Neowave)TRX has been trading in a relatively tight range since last year, that range is coming to a point now and it seems like, based on EW structure, that this triangle should break up within the next few weeks. If it doesn't break up in the next few weeks then we'll probably see it continue to consolidate into the tip of the triangle until the end of the year, before breaking up.
If this is the end of a pattern which began in 2018, as shown on my chart, we should see a explosive and near vertical move out of this range. Typically, when volatility reaches a very low point, it is often followed by a massive increase in volatility. This combined with USDD potentially burning a huge amount of the supply of TRX in the future could lead to prices in the double or even triple digits over the next year.

Trx has to choose...Trx is either going to break up or down. More so likely to break higher since it's a large falling wedge and should bring in a lot of the bulls! Fingers crossed!!
Wait for the break either down or up!


TRX (TRON)hello guys
i think TRX will make a reversed cup and handle pattern and go a lil bit more down...if btc pumps it will not happend and if btc dump then trx will dump even further
attention : do not trade based on my TA

TRX & Cryptos TrendConsolidation phase of the minimums.
TRX, like many other cryptocurrencies (including BTC), will initiate a phase of consolidation of the lows that will last throughout the month of August. It could go further until mid-October.
After the double bottom, the upward retracement will begin following the declines that began last October (the beginning of the war) which will give great but vain hopes.
The new BullRun will start from the end of 2023 so until then it will be an ups and downs of retracements and accumulations.
We can call it stationarity.

TRX/USDT Analysis for next movePrice is expected to fall to buy zone which is around 0.05$ which is a good buy zone.
Please Like, share and comment.