Is a #TRON Breakdown coming this week? #TRON is expected to announce a new publicly listing partner this week. Will a partnership with #BABA, #AMZN, #TSLA #Other side this coin to $1?
TRXETH trade ideas

Just an IdeaElliott wave 1-5 in red roughly following all the rules, followed by ABC correction ending at previous 4, with a hopeful 1-5 meeting previous trend lines?
My first post, so you probably shouldn't use this as advice.
Happy to hear where I am wrong (other than not being able to see into the future)


[TRXETH]It is almost the time!Hi!,
So same rule, if PA closes bellow yellow line close trade and wait for update later on. We are talking about 400 to 600% profit in a manner of 2 or 3 days. Some give it some time. But TODAY is a critical day as it touches a support lvl. (redline).

Tron Bullish AFThis chart inside the 1-3 minute timeframe is a Beautiful Fractal of the TRX/ETH BInance All-time chart. Looking like a Break out of 0.11 USD coming (at lease for a bit short term), Bulls will need to show up if we want to push upwards and develop an equilibrium @ 0.15 USD. These are just short term price action predictions, play your positions wisely.


(TRX/ETH) The Start Of An Uptrend?Tron has been in a down trend since January 5th, after creating all time highs. We seem to have found solid support levels and more buyers are entering the market. Just recently we have broken a down-trend trend line. There is an up-trend channel forming. I'm currently bullish anywhere from 0.000095 to 0.000075. I personally feel there are 2 entry points for anyone looking to enter the market.
Entry 1:
- Retest of the Trend Line
Entry 2: (If Support and Channel Fail)
- If the support and channel fail, I will look to enter again at the 0.000075 level.
Targets:
- I believe targets for this trade depend on what your plans are.For instance, do you want to hold, or buy and sell the channel?
What Do You Think?
- What do you think? Are you bullish/bearish on TRON? Why?
Please remember this is simply an idea, so treat it as such. I'm not saying anyone should invest their money based upon my ideas, do your own research first. This is simply to see what others opinions are and provide food for thought.
Happy Trading!

TRX in the way to target it is time to buy my gentleman
take a look in this harmonic pattern
good luck to all

Mini 88.6% FIB bounce inside main structure 15 M TF - price just bounced off the 88.6% fib on 15 m TF. possibly forming Inverse H&S from the price action and RSI divergence forming. Lets see what she does

88.6% Bounce ( XYZ ) Watch it close here at the 88.6% If it bounces here hang on tight we're going to the moon


TRON (TRX/ETH) potential bullish breakoutTRX hit a strong line of support today at 0.000075 ETH and seems to have bounced off, possibly presenting a change in the market sentiment. As TRX nears the convergent point of the triangular pattern shown in pink it looks poised to break out; the MACD indicator is showing bullish divergence, a fairly clear bullish head and shoulders pattern has formed on the 30 minute chart and ADX lines just crossed upwards. I would be very surprised if TRX breaks downwards and I think a mass sell-off would ensue as people would start to abandon ship - a stop loss at around 0.00007 ETH is vital for anyone initiating a long position. I think a trailing stop loss instead of any upward target points would be the best strategy here.
Also worth noting that TRX's partnership with Baofeng (NASDAQ listed) was recently announced and this is likely to add to buying pressure. However, proceed with caution.

Move to the ascentIf we can withstand the first resistance in the coming days, we can expect a good price growth. The second scenario is that it can not afford to drop the price, which may cost $ 6070, and then begin to rise in price. On the whole, there will definitely be a rise in prices in the coming days and you can get good profit.


TRX the Money Multiplier explained using MACD and ADXI bought in when released on Binance, and sold at 9 cents. Here I analyzed the trends to see potential indicators that could have increased my profits. Personally, I recommend buying now as we are at a new entry point and the wallet for this polished Company has yet to be released. The TRX wallet is still a beta java project that has to be built from source. However, it functions as promised.

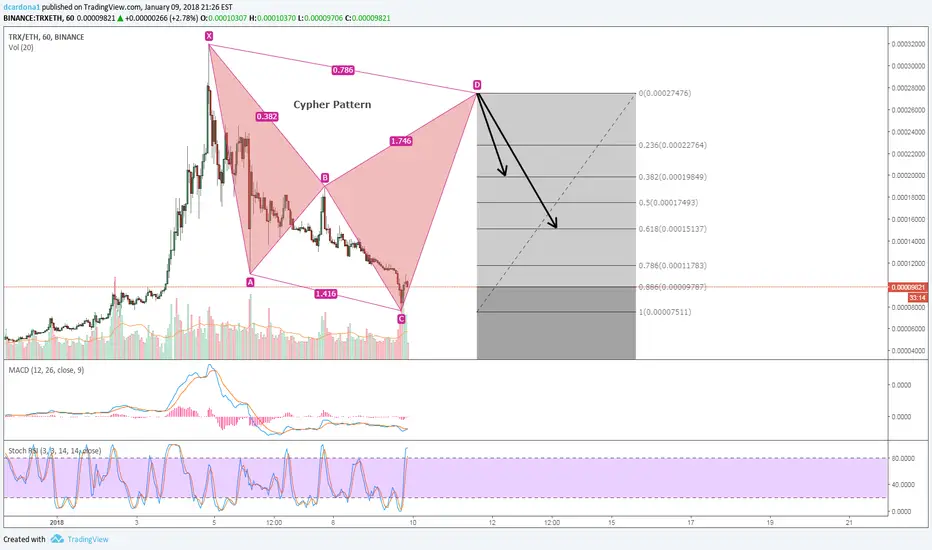
New Idea - Cypher Pattern on 1HR Chart TRXETHMy previous idea using the elliott wave didn't work out right. After reviewing other people's ideas on TRX/ETH and TRX/BTC, it appears that the wave that I called #1 was actually #5. Based on other's ideas, it looks like we just finished correction wave ABC. Lots of negative comments throughout along with widespread rumors.
Most of these altcoins are speculative and we are all still early investors. We may not be BTC early but we are definitely still in the early stages. If you're investing, you're either in it for the quick profits or you're investing in the idea/team.
If the coin goes up which I expect it to, we have a bearish cypher pattern forming on the 1HR chart. Expect lots of resistance at the 0.00027 with wicks at the 0.00032 mark followed by a .382-.618 retracement.
Let me know your thoughts.

Interpretation of the TRX correction wave - ABC patternThis is how I see the wave between the lower and high timeframes. the ABC taking on individual alternating structures on the smaller level to create the downtrend correction. If this is the case, the price just has to fall below 0.00011043 before the corrective wave can be completed and the uptrend motive impulses can begin.
Please let me know if you see anything wrong with this.
