bullish on trxI know ev4ryone is and this coin is pumping hard right now. There is some big news coming this week which is really pushing it along. Right now were testing resistance, former support, from the decline of ath. Also were in an ascending triangle so if the bulls can push through the resistance and out of the triangle there is really no upside resistance until around 17k satoshi range. If the bulls are unable to break through then next support range will be around 8400~8600 satoshi.
TRXETH trade ideas

Good time to sell TRX?In this chart, I did a FIB based trend extension and outlined our support areas. I do think TRX will go down temporarily (probably to near the center of this channel), but we do have new support levels and the only definitive resistence at this point is .000116. With the release of this testnet in 2 days however, I am not sure we can rely solely on TA. Do I think selling a portion, say, 25%-50% now would be a good option, well yes, depending on where you bought in. However, we might just see some new support levels before and even shortly after this release that could define our new bottoms in the short term future. I think we will still see a lot of FOMO before this weekend. Buying in at any lower support level would also not be a bad idea in my humble opinion. If I had to pick an entry point, if it were to get there before this weekend, I would have to say .0001-.00015 would be pretty solid. That would be our first low point on our elliot wave.
What May Happen With Tron, Safe Long, Fundamentals There's something about TRXETH that makes me very excited about the near future but also skeptical. I'm just going to post various scenarios for the next couple days to weeks before the MainNet Launch. Many people have been looking for a meteoric rise for the weekend but in reality, many traders are looking for a quick flip this coming Saturday. I think that many people are blindly hoping that the price will rise 50-100% this weekend but at the same time are looking to sell their own share. A problem I find with this idea is that if you are thinking that, then many others are probably thinking the same as you and are looking to sell. Another thing that people might not understand is that THIS IS A TEST-NET . It can't be stressed enough that INSTITUTIONAL INVESTORS and the MARKET as a whole has not yet forgotten about December and the fall we all sustained because people called TRXETH Vaporware. Even though I don't believe this, I think it could take until we see May 31 for there to be a MASSIVE rise in price. It would also be in May that I assume the entire market will hopefully start picking up which would be very good for TRXETH as well. Because there may not be a meteoric rise, there could cause a short-term sell-off in TRXETH if market expectations are not reached. Other than that, however, if the market does go up 50% and then subsequently drops 25-30% I would consider that a very good outcome for our long-term view, namely May 31.
Secondly, during the month of April and the beginning of May we may run sideways with no clear path, given that the hype will have subsided until people coming really looking at TRXETH for the May 31st SEPARATION (thank god) from ETH and a REAL launch of the crypto-currencies USE . Personally, I can't wait for May 31 because it will be the day I could look at the FUDsters and just give them a big FUCK YOU . But anyways, I think that non-substantial news of failures or bugs but also of successes and practicality issues will be expressed on TRX's BETA code which could lead to some wild ups and downs. Another Worst case scenario would be experts coming out and straight up saying the code is garbage. Another bad thing would be if there is obvious plagiarism in the code with NO CLEAR CITATION . I know how coding works and I know that hackers usually take code from the internet because it's useful to not re-write whats already been written. However, I'm sure that the TRXETH team is very aware of this and their previous mistakes and will do well to cite their work.
Side note, I'm not great with charts but for a long time I feel like I'm seeing a big cup and handle forming but I think we may need to see more volume on the upside for that.
Anyways, this has been your humble review of a great coin.
Comment for a constructive conversation.


TRX/ETH - Long againafter short correction, I expect a continuation of uptrend
Only for Education, not an advice to buy

TRX's testnet release in 5 days, 2 hours, and 30 minsTRON is releasing it's testnet in 5 days, 2 hours, and 30 mins. This release should propel TRX to a new high. On this chart I had trouble finding any real resistence levels so I am basing my prediction on the time frame of this release date. The blue line is the last real support level at this high in the trend and I think it will hold as the 4 FIB confluence retracement level is just above this line (4 FIB retracements from the last four bottoms all lined up here). In other words, we should find support between those two lines (.00008-85). A correction of 30% on the FIB retracement also seems appropriate at this level. In addition, our Stochastic Momentum Index tells us we are oversold and we should see a reversal soon. This is a tough prediction so take this with a grain of salt as again, my prediction is heavily influenced by the testnet release date. I do think that an entry at .00008 regardless if it goes up immediately or temporarily moves sideways would be a good spot.

TRX/ETH Middle Finger Pattern CompleteHi everyone...
I wanted to share this TRX/ETH chart with everyone. I know Tron has fallen out of favor but there is a long term opportunity brewing that you should be aware of.
As you know, when something has fallen out of favor and is down >70%, it might be time to take a look at it ESPECIALLY if there is a compelling chart pattern... and the middle finger chart pattern is about as compelling as they come.
Here is a plan for trading the middle finger (MF) pattern... modify it for your own level of risk tolerance:
1. Buy a small amount of Tron now.
2. Wait for a DAILY close above the ring finger: When this happens, buy a little more.
3.Wait for weekly close above ring finger: when this happens, buy more.
Do not exceed 5% of your holdings... markets are fractal and if you get a weekly close below the ring finger after closing above it, TRX will be at risk of a double middle finger pattern where the ring finger of the previous pattern becomes the index finger of the new middle finger pattern.
If this occurs, it will take about 3-5x the amount of time of the original middle finger pattern before the market can recover. So, this is only meant to be traded in small quantities. But if it pays off, your 5% will go 10-100x... though that might take some time... maybe a year or more. The MF pattern does require some patience.
For future reference, if you see this pattern after a strong up move, sell the breakdown of the knuckles the way you would the neckline of H&S. You probably already noticed that the MF is basically a H&S with a VERY tall and narrow head... so much so that it deserves its own name.

1st Analysis : New trend incoming for TRX Comments incoming 27/03
resume : 3 successive resistance breakouts. Last breakout is starting a new trend, and doesn't seems affected by BTC / ETH dips. MAcroeconomics events are pushing possibilities.
I'll aim for a 200/400% gain, stop loss @0.00068Eth

TRXETH .. sky is the limit?Looks like this have done 3x the original big target.
Very impressive.
Unitl March 31 we could expect a new rise.
Seems that patterns fits in their place.
-SG-

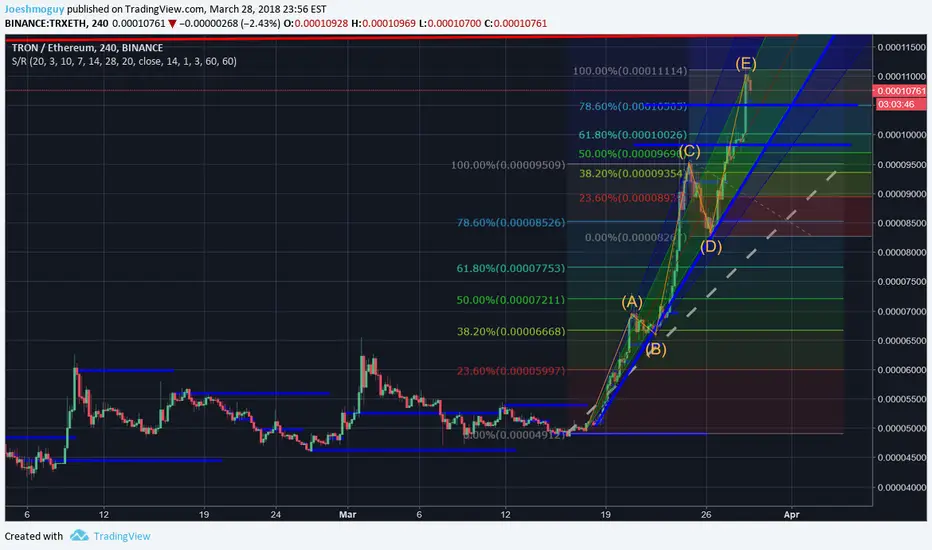
Another Idea on TRX using elliot wave patterns.In this chart I am using the Elliot Wave Oscillator combined with Elliot Wave Theory to determine what wave cycle we are on. I went back as far as I could and marked the turning points in the oscillator in a literal sense. This chart seems to back my prediction on my previous chart on TRX which is that it still has to go up to a sell point. The current downtrend is line D and we still need to complete trend line E. My prediction on where line E ends is not specific as this is more of a determination, again, of where we are at in the wave cycle. If we take the oscillator literally as I have done, then there could easily be a couple more actual trend lines in between before the oscillator goes from white to yellow and then back again to white thus completing point E. This is more of an experiment for me than a prediction of actual price points.


TRX bull run still has momentum decreasing bearish volume, I believe trx will keep trying to break 0.00010000. More bull momentum on the way, lots of FOMO in the market.

TRXETH repeating patterns???TRXETH is repeating patterns?
Predictions:
Red line: Shape of before-last peak.
Orange line: Shape of last peak.
Green boxes: Support - Resistances.
Red Dot Line: The biggest Target possible before down.
In: 0.00005030
Target: 0.000065
SL: 0.00004883
Im just an ignorant newbie not-trader student
All your comments that could help to understand better this things will be apreciated.
Thanks


TRX/ETH Long Term Moon Shoot IncomingThese past couple of days have showed the path on what is more than likely going to happen. just follow the price action.. It tells quite a story!

Is it the moment for TRX to break out from its corrections ?Yesterday wasn't the day for the break out. Now, with corrections on my chart, I hope we can now see a new growth trend for TRX. Targets are settled, stop loss alos.
Good Luck everybody.
Omar

TRON: lateral phase, waiting for main net.BITFINEX:TRXUSD is still in his horizontal canal between 0.000039/0.000065 ETH. We see (blu horizontal lines) a smaller structure (0.000046/0.000057 ETH) that could give a signal for a short term trade.
We fundamentally are waiting for the launch of MAIN NET expected for 31 of March starting a strong bullish trend .


TRXETH broke downtrend?Is this a valid trend?
Was it broked?
Im just learning... all your comments will be apreciated (in educational terms of course :D )
-CJ-


TRX /ETH in upwards channelIt appears TRX/ETH is in an upwards channel when charted on the ETH chart. Given that ETH/USD currently seems undervalued, this is interesting. The channels could possibly be played for entry and exit points.
