TRX 1D – SR Flips and Trendline Support Hold StrongTRX continues to respect trend structure — clean support retests, ascending trendline intact, and back-to-back SR flips fueling continuation.
With another higher low forming off the recent flip zone, bulls may be eyeing a move into the $0.35+ range. But watch closely — if price breaks below $0.30,

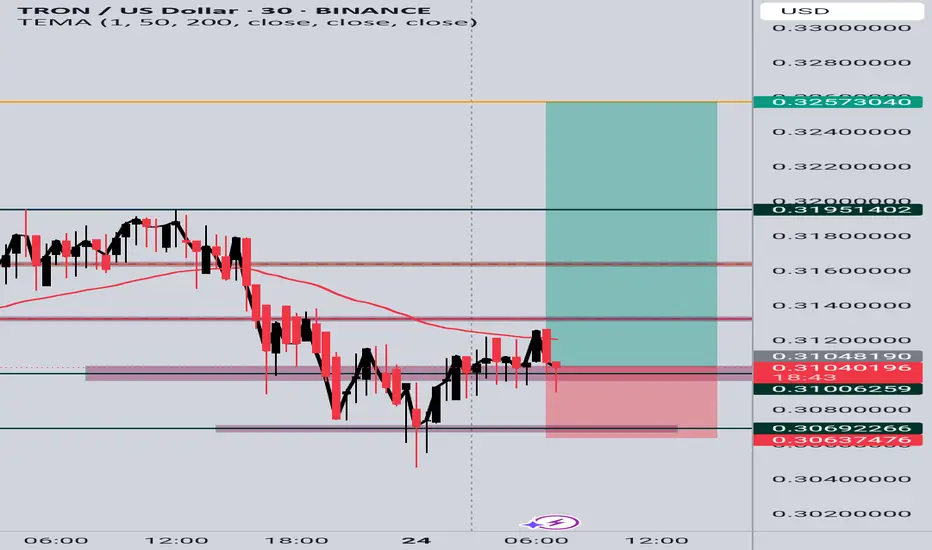
TRX/USD Long Setup (30m Chart)TRX/USD Long Setup (30m Chart)
Price formed a consolidation base around 0.3100 after a strong drop. I entered long on a potential bullish breakout above the short-term structure, targeting partial profits at key resistance levels:
TP1: 0.3195
TP2: 0.3257
Stop loss is set below recent support near
Classic Liquidity Trap on TRX -TRXUSDT-4HPrice hunted buy-side liquidity with a sharp fakeout move, trapping breakout traders.
After breaking structure (BOS) and forming internal liquidity, the short setup was confirmed.
Entry placed on the mitigation of the order block with clear risk defined above the fakeout.
Targeting sell-side liquidi

TRX Grinding Higher – Are These the Next Targets?📈🔥 TRX Grinding Higher – Are These the Next Targets? 🧱🚀
Continuing the Altcoin Series, let’s take a look at TRX (Tron) — quietly grinding higher while the crowd stays distracted elsewhere.
As I’ve said before: I’m preparing to divorce altcoins at the top of this cycle. But until then, I’m a trader

TRON TRX Eying New ATH📈 After 6 months of sideways accumulation, CRYPTOCAP:TRX is finally picking up momentum. A weekly close above $0.317 could trigger acceleration toward the next targets at $0.50–$0.60 🚀

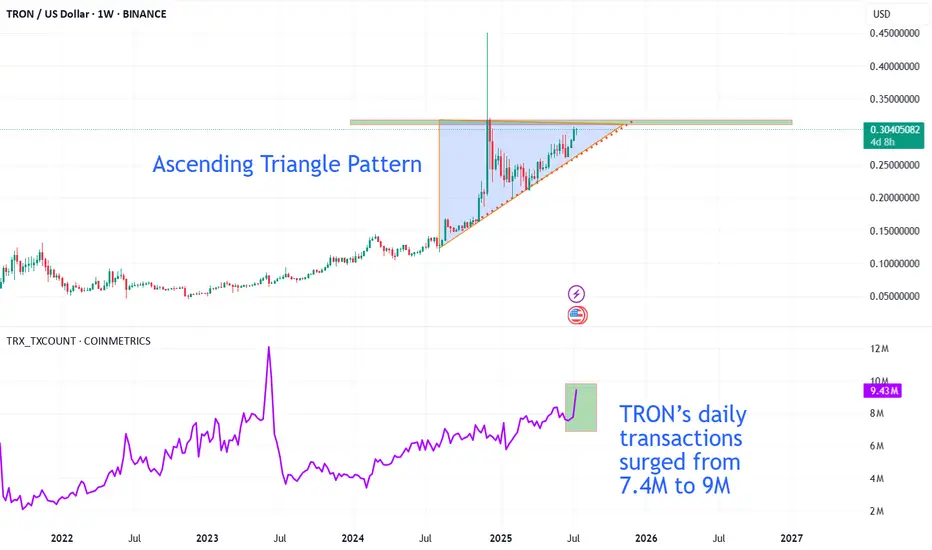
TRON Technical & On-chain Analysis: Is a Breakout Imminent?The TRX/USDT weekly chart is showing TRON testing a major resistance zone near $0.32, while forming a classic ascending triangle pattern just below this level. This bullish structure typically signals increasing momentum from buyers and raises the potential for a breakout above resistance.
What mak
TRON the next rally for an AltcoinTRON seems to be the next ALt Coin Crypto that is ready to rally with the Crypto Summer kicking in with Bitcoin and Ethereum.
So this one looks exciting for upside.
Here are SOME fundamentals for upside first.
🏛 1. Institutional Money Flows
Big players are backing TRON with institutional-scale

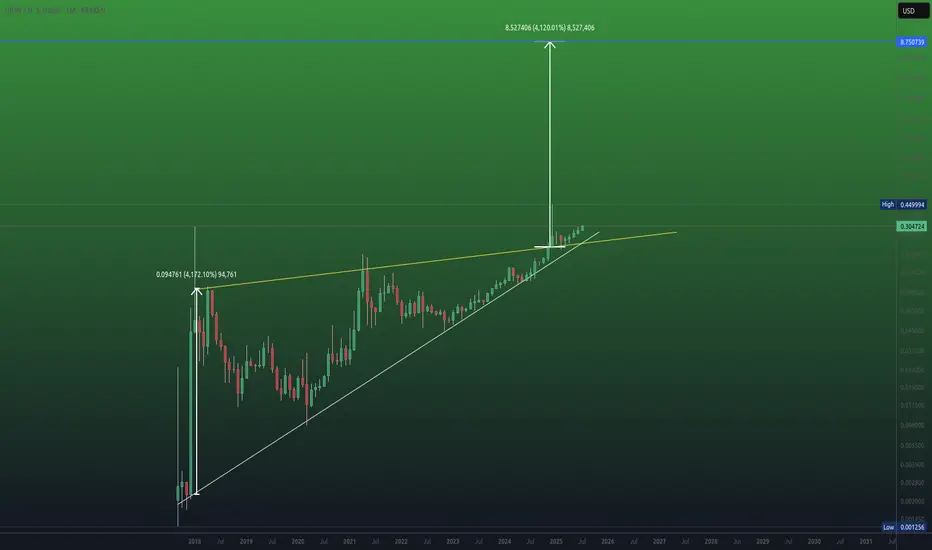
TRON/TRX: The Hottest Chart in All of CryptoThe ascending triangle pattern is obvious as day. Price action has broken out and the triangle's already been tested from the top. Soon TRON will go on price discovery. The target of such ascending triangle is the height of the base of the triangle. I'm a bit conservative so my TP is $8 bucks.
Don'
TRXUSD – Climbing, Testing the LidTRX rallied strongly off the $0.287 base and is forming higher highs and higher lows. Current price is just under $0.306 resistance. A breakout could send it to $0.312–$0.315 fast. Support to watch is $0.302 — lose that and the setup weakens.

TRXUSD – Still Holding the ClimbTRX climbed steadily into $0.289 before rolling into a correction phase. It has now printed a clean bounce off $0.285 and is testing the $0.2875 area. A reclaim of $0.2885 could reestablish bullish momentum. Structure still favors higher lows as long as $0.2845 holds.

See all ideas
Summarizing what the indicators are suggesting.
Oscillators
Neutral
SellBuy
Strong sellStrong buy
Strong sellSellNeutralBuyStrong buy
Oscillators
Neutral
SellBuy
Strong sellStrong buy
Strong sellSellNeutralBuyStrong buy
Summary
Neutral
SellBuy
Strong sellStrong buy
Strong sellSellNeutralBuyStrong buy
Summary
Neutral
SellBuy
Strong sellStrong buy
Strong sellSellNeutralBuyStrong buy
Summary
Neutral
SellBuy
Strong sellStrong buy
Strong sellSellNeutralBuyStrong buy
Moving Averages
Neutral
SellBuy
Strong sellStrong buy
Strong sellSellNeutralBuyStrong buy
Moving Averages
Neutral
SellBuy
Strong sellStrong buy
Strong sellSellNeutralBuyStrong buy
Displays a symbol's price movements over previous years to identify recurring trends.
Curated watchlists where TRXUSD.P is featured.

Gen 3 crypto: A new day dawns…
25 No. of Symbols

Smart contracts: Make the smart decision
36 No. of Symbols

Staking Coins: Pick up a stake
18 No. of Symbols

Top altcoins: Choose your alternatives carefully
28 No. of Symbols
See all sparks