TRON Analysis + 2023 CrashWe can see how it is close to the "ground" of Tron. Due to the great crisis that is coming for 2023, I cannot deduce if the crypto market is going to benefit from this, but what I am sure is that all the markets are going to fall.
It is impossible to predict a crash correctly and whether it will affect the "crypto market".
For Tron I see a bullish and neutral trend (staying on the ground correcting for a while)
TRXUSD.P trade ideas

TRON Grand Hackathon 2022 WINNERSTRON Grand Hackathon 2022 announced the winners of its Season 1 event. The panel of judges, which consists of eminent industry leaders, said they were pleased with the projects they received this season. They already await Season 2, where registration will begin on May 16, 2022.
Running from March 8 to March 11, Season 1 amassed over 120 submissions, all vying for the aggregate prize money of $500M spread between four tracks, Web 3.0, NFT, GameFi, and DeFi.
Season 1 Winners
In the GameFi Track, the winner is TronNinja Arcade by the TronNinja Team. TronNinja is an NFT GameFi project on the TRON blockchain where users will be able to use their NFTs as characters in-game while earning in-game tokens. Their goal is to bring back the social aspect that arcades had.
In the Web3 track, the winner is dCloud by Cctechmx. Their mission is to create an Open Source Web3 Cloud storage mobile app enabling its own ecosystem to enjoy a self-sustainable and shared economy.

TRXUSDTRXUSD is still in a short term downtrend. A sell setup has been formed and a sell position is taken.

TronWe can see a rising wedge in the chart,it has been broken and now it's busy with repricing which soon will end and chart might continue down.

Future direction logscale Trx!I believe we are bottom of the channel.. and the potential for Trx is exceptional for the next few years in reaching $12+ usd.
Perfect time to buy and hodl if you haven't done so already, otherwise set yourself up for future success now. Peace!

TRX pump TRX looking like it’s gonna pump. Can easily change and reject here tho. Stop set. If triggered sub 5 cents coming. Prepared for the worst but praying for the best

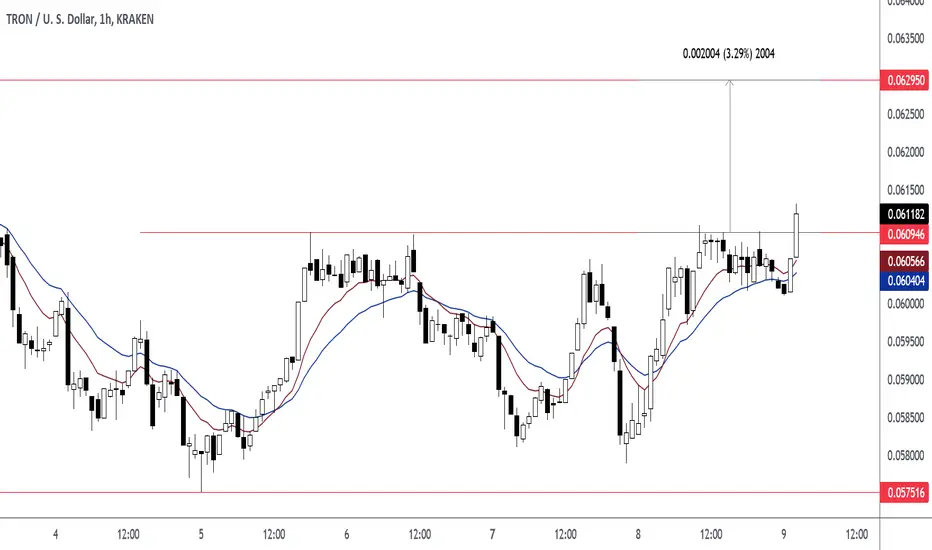
Take Profit: 0.062950 (TRXUSD)Price closed above 0.060946. A close above 0.060946 exposed 0.062950 resistance level as the take profit target level. Entry at 0.061182. Take Profit at 0.062950.
TRON Could Test 5.5 cents before going to $10+ next yearWave-B has formed into a double combination which are normally retraced 80%. Wave-E from beginning to end should also be related to wave-C by 61.8% in price, and C+D in time. This leaves us with a target of 5.5 cents for TRX, which could happen around February or March.
Following this correction we should see an explosive rally which will take TRX well above all time highs because this will be the actual end of the 4 year bear market pattern. It could go higher than $10 next year and then even higher in the following year.
Positive regulations from the US will be a major driver of crypto prices next year as new institutional money starts entering because of regulatory clarity. High inflation will also be a major driver of higher prices in later 2022.

TRON UPDATEUkraine has a sizable pool of software developers ready to break into the blockchain technology space.
Last year, Dutch IT company Daxx ranked Ukraine as the most desirable country for information technology outsourcing and the No. 1 in the world for hiring programmers.
Ukraine processes more cryptocurrency transactions per day than it does in its domestic currency, the hryvnia, a 2021 report by The New York Times shows.
$8 Billion In Crypto Enters Ukraine Annually
According to The Times’ report, more than $150 million worth of cryptocurrency is traded in Ukraine everyday, and approximately $8 billion worth of cryptocurrency enters and departs the country each year.
Ukraine’s parliament enacted laws legalizing cryptocurrencies last week, laying the groundwork for a regulatory framework to effectively oversee the flow of digital assets such as Bitcoin.
Ukraine’s policymakers are optimistic that the new law and its crypto adoption would draw additional international investment into the country’s developing crypto economy, however frictions — and now a full-scale war – with Russia looks to dampen financial inflows.

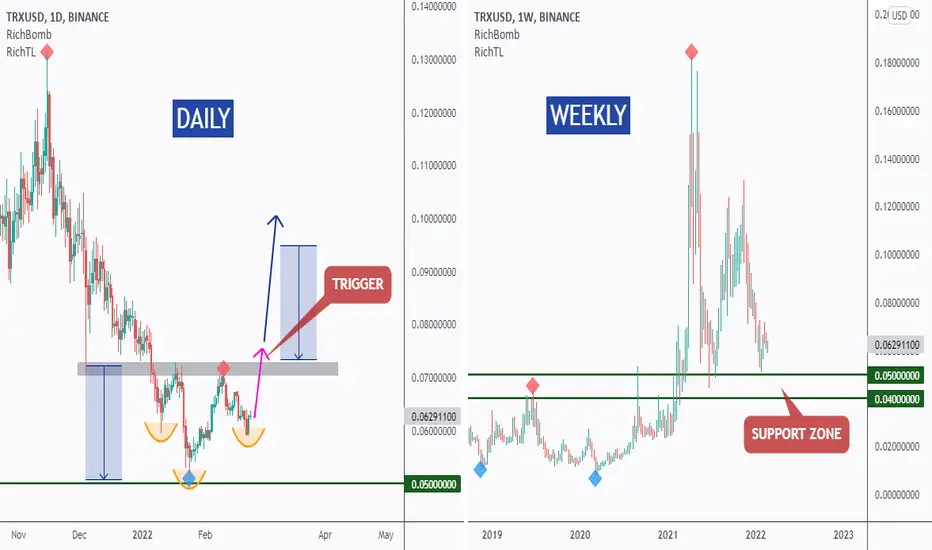
TRX - Top-Down Analysis!Hello everyone, if you like the idea, do not forget to support with a like and follow.
WEEKLY: Right Chart
TRX is sitting around strong support in green so we will be looking for buy setups on lower timeframes.
DAILY: Left Chart
TRX is forming an inverse head and shoulders pattern but it is not ready to go yet.
Trigger => Waiting for a momentum candle close above the gray neckline to buy.
Meanwhile, until the buy is activated, TRX would be overall bearish can still trade lower inside the green support.
Good luck!
All Strategies Are Good; If Managed Properly!
~Rich
TRX waiting for break-outThe market is under heavy pressure, but smart money is moving in opposite directions.
Macro:
- S&P500 testing bottom support
- IWO / IPO tech indices making higher lows
- BTC making higher low
- FED can't be too hawkish with a military and financial conflict
- GOLD developing bearish harmonics
TRX already tried to make an inverse head&shoulders on the daily, after breaking out of a falling wedge. See details on the chart.

Right Now!!!!I feel like right now is the best time to get back into the market yes prices are low but guess what? The Winter Dip is almost over.

TRX/USDT - Potential 183% SetupHello Traders!
TRX demonstrates the continuation of the correction phase, completing the previous cycle.
It's better to form a medium-term position by buying from support levels of $0.0495, $0.0430, $0.0370.
It will be necessary to close the position in case of price fall under the level of $0.0240.
The profit taking targets within the medium term by the levels of $0.0830 $0.0930 $0.1050
Good luck and watch out for the market
P.S. This is an educational analysis that shall not be considered financial advice

trx - tron trying to reach 0.1 again !as we can see on the chart, the cloud is as a resist area and by trending this coin on social media + good behavior of btc to reach the 50 k again, we can go to long position !
also, the RSI is on the 45-55 range = the price should go up and candle may enter to cloud asap :))

TRON (TRX) - February 15Hello?
Traders, welcome.
If you "follow", you can always get new information quickly.
Please also click "Like".
Have a nice day.
-------------------------------------
(TRXUSD 1W Chart)
(Full: )
Above 0.0441 3840 point: Expected to create a new wave.
It must rise above the 0.0750 0028 point to turn into an uptrend.
However, in order to continue the uptrend, it must break out of the downtrend line.
If it declines from the 0.0441 3840 point, it is likely to enter the mid- to long-term investment zone, so you need to trade cautiously.
As the CCI line failed to rise above the EMA line in the CCI-RC indicator, the TRX entered a sideways section.
On the 1W chart, when the CCI line rises above the EMA line and above the +100 point, it is most likely showing a large uptrend.
(1D chart)
First resistance section: around 0.0864 4692
Second resistance section: 0.1124 3825 - 0.1254 3392
Support period: 0.0474 5992 - 0.0604 5559
-------------------------------------
(TRXBTC 1W Chart)
0.0000 0259 - 0.0000 0318 or higher: Expected to create a new wave.
It must move above the 0.0000 0194 point to turn into an uptrend.
------------------------------------------
We recommend that you trade with your average unit price.
This is because, if the price is below your average unit price, whether the price trend is in an upward trend or a downward trend, there is a high possibility that you will not be able to get a big profit due to the psychological burden.
The center of all trading starts with the average unit price at which you start trading.
If you ignore this, you may be trading in the wrong direction.
Therefore, it is important to find a way to lower the average unit price and adjust the proportion of the investment, ultimately allowing the funds corresponding to the profits to be able to regenerate themselves.
------------------------------------------------------------ -----------------------------------------------------
** All indicators are lagging indicators.
Therefore, it is important to be aware that the indicator moves accordingly with the movement of price and volume.
However, for convenience, we are talking in reverse for the interpretation of the indicator.
** The MRHAB-O and MRHAB-B indicators used in the chart are indicators of our channel that have not been released yet.
(Since it was not disclosed, you can use this chart without any restrictions by sharing this chart and copying and pasting the indicators.)
** The wRSI_SR indicator is an indicator created by adding settings and options to the existing Stochastic RSI indicator.
Therefore, the interpretation is the same as the traditional Stochastic RSI indicator. (K, D line -> R, S line)
** The OBV indicator was re-created by applying a formula to the DepthHouse Trading indicator, an indicator disclosed by oh92. (Thanks for this.)
** Support or resistance is based on the closing price of the 1D chart.
** All descriptions are for reference only and do not guarantee a profit or loss in investment.
(Short-term Stop Loss can be said to be a point where profit and loss can be preserved or additional entry can be made through split trading. It is a short-term investment perspective.)
---------------------------------

the site says hold in [neutral.crypto.crypto] EP]FCOERDPCcrpto tron trx
t [pot [pty [njo [hyoi [grrpj
tr [pgr ocde]comefro [cok

TRX - Price Prediction for mid MarchFib Trend & Fib Arc Both cross at key support/resistance levels. Take your profits and on to the next!
Happy Trading.

TRXUSDT D1 Good opportunity to buy ! Hello traders, as you can see, the TRXUSDT chart has had a good reaction to the bat harmonic pattern in the past, and now, after completing a shark harmonic pattern and returning a price from it, it expects a price rise, as well as in Ichimoku KS And TS have given an ascending cross, while the presence of a large gap in the Ichimoku clouds increases the probability of ascent. I have identified the main resistances and I expect to climb to these targets. There is also the possibility of a price reversal from the current resistance and the formation of a classic double bottom pattern.

TRX 3 scenario#TRX/USDT
$TRX rejected from support zone, and reached a resistance zone.
🐮 if price hold the support zone, and break out from resistance zone around $0.077, so it is going up to touch upper line of triangle around resistance zone of $0.09.
🐮🐮 break out from triangle will help price increase more to complete double bottom pattern at $0.15 and $0.176.
🐻 break down from lower line of triangle and support zone, will drop price to complete AB=CD pattern around $0.03

Tron Price Analysis — February 4After breaking out of the long-sustained bearish channel, TRX has surfaced above the eleven-day ascending trendline as the cryptocurrency inches closer to the $0.0650 resistance. A break above the 4-hour 200 SMA, which coincides with the $0.0650 resistance, should help TRX regain a solid bullish trajectory as we approach “Valentine’s rally.”
The twenty-fifth-largest cryptocurrency briefly slipped back into the ascending channel earlier today following the US NFP reports, although bulls seized control again and pushed the price above $0.0640. It would be interesting to see what the weekend and next week hold for TRX.
Meanwhile, my resistance levels are $0.0650, $0.0680, and $0.0700, and my support levels are $0.0620, $0.0600, and $0.0580.
Total Market Capitalization: $1.66 trillion
Tron Market Capitalization: $6.44 billion
Tron Dominance: 0.35%
Market Rank: #25

$TRXUSD entry PTs .001804-.0068-.051865 Next Target PT 2.40-17TRON Coin Price & Market Data
TRON price today is $0.059529663343 with a 24-hour trading volume of $658,735,152. TRX price is up 3.9% in the last 24 hours. It has a circulating supply of 100 Billion TRX coins and a total supply of 102 Billion. If you are looking to buy or sell TRON, HitBTC is currently the most active exchange.
What is Tron?
Tron is a blockchain-based decentralized operating system much like Ethereum that aims to advance the decentralization of the Internet and its infrastructure. At its core, Tron is a smart contract platform that offers high throughput, high scalability, and high availability for all Decentralized Applications (DApps) in the TRON ecosystem. The Tron blockchain is built around the usability of its native token, Tronix (TRX).
Who created Tron?
The Tron blockchain was created by Tron Foundation, a Singapore based organization that is currently headed by Justin Sun. Prior to creating the Tron Foundation, Sun founded Peiwo, an app that aspires to be the Asian Snapchat. This app got Sun into the 2017 Forbes 30 under 30 list.
Sun was also the former Chief Representative of Ripple in China and a graduate of Hupan University.
Tron came about after a successful ICO which raised over $70 million in September 2017.
What is the Value of Tron?
Using the blockchain and its decentralized smart contract capability, the idea of Tron is that users will experience a decentralized internet where “middlemen” such as Google and Facebook are not needed for users to access content.
To draw an example, currently the most ubiquitous video sharing platform is Youtube, which is a privately owned company with privately owned servers that stores and serves video to its viewers. However, using Youtube’s services means that creators and users have to comply with Youtube's terms of service and may have to pay for its content in one way or another. Creators on the Youtube platform may earn a share of Youtube’s revenue, but the pay structure is entirely up to Youtube’s discretion.
Tron aims to replace services such as Youtube and others by becoming the decentralized infrastructure in which users can connect directly with creators and pay the creators directly for the content they wish to consume.
How does the Tron Blockchain work?
The TRON protocol runs on a Delegated Proof of Stake (DPoS) Governance Model. This allows users to perform transactions with close to zero-fee whilst still being resistant towards transaction spam.
Transactions on the Tron Blockchain are maintained by a consortium of Super Representatives (SR) that are voted in by TRX holders who have locked their stake in the form of Tron Power. There are 27 top-voted Super Representatives and 100 Super Representative Candidates. The hierarchy of SR and SR Candidates are readjusted every 6 hours based on the number of votes they receive from Tron Power holders.
Can I mine Tron?
No, you can’t mine Tron because Tron runs on a Delegated Proof of Stake consensus algorithm. This is different from Bitcoin which uses the Proof of Work algorithm. New Tron tokens are created as block rewards for elected Super Representatives. This serves as an incentive to the Super Representatives in maintaining the integrity of the Tron network. You can participate by staking your TRX and voting for your desired Super Representative.
What can I do on Tron?
At its core, Tron is a smart contract platform. Specifically, it is built to be Ethereum Virtual Machine (EVM) compatible, meaning it has a Turing complete virtual machine capability. Executing smart contracts on Tron is similar to Ethereum.
On the other hand, whilst Ethereum operates on the gas fee transaction model, Tron operates on the Bandwidth model, which is similar to that of EOS. This is how transactions on Tron can be much cheaper and more seamless than Ethereum.
Just as one can issue smart contract tokens such as ERC-20, ERC-1155 and others on Ethereum, it is also possible to issue smart contract tokens on the Tron too. There are currently 2 token standards possible on Tron, namely TRC10 and TRC20.
Various TRC10 and TRC20 tokens have been issued on Tron with various use cases.
Where can I use my TRX?
There are numerous Decentralized Appliactions (Dapps) built on the Tron Blockchain, many of which require the use of the native Tronix (TRX) token. You can easily swap your TRX for TRC10 tokens which are used by many Dapps on the Tron Blockchain such as BitTorrent, 888Tron and others.
How to store my TRX?
The Tron Foundation has made it very easy for users to store and utilize TRX in their day-to-day online activities. The Foundation recommends TronLink and TronWallet as their official community developed wallet. You can also store and use your TRX in most other widely recognized wallet brands such as Trust Wallet, Ledger, Cobo Wallet and others.
Where can I trade TRX?
You can see the full list of exchanges trading TRX right here on this page. CoinGecko continually tracks the latest market movement of TRX and provides this data for you.

Trax predictionLearning never ends Big jackpot ,120% return minimum onfy for risk management trader's 🐉🌡️

TRX support at Elliot Wave lvl, and 36.4 bln USDT running on itTRX just found its support on EW retracement and it is still the second largest carrier of USDT - by far - with 36.4 billion USDT issued on it.
While people are applauding Solana, it only carries 1.5 bln USDT on its network.
USDT on Ethereum is just shy of 39 bln having lost the most at almost 800 million in recent days, while only 320 mln where redeemed on Tron .
