TRXUSD.P trade ideas

TRX is a good choice for alt season?hi guys
I am looking for best altcoins for this alt season .. so tell me your choices
I think TRX can be one of by basket because;
1. it is compressing the power for a long move
2. it's 24h volumes are so exciting, look at them
3. it has a good 60% potential of moving up
so, are you agree or not
tell me you idea
thanks for support

TRX breaking out Tron is Breaking out and confirming the break out . TRX/USDT broke out of long term resistance and confirmed it . Wait for impulse move above $0.11 with volume support and enter the trade

TRX/USDT about to break outHello traders ! TRX is about to break very important resistance ! Enter only after break out $0.11 with volume support ! Targets $0.15 $0.18 $0.22 $0.3


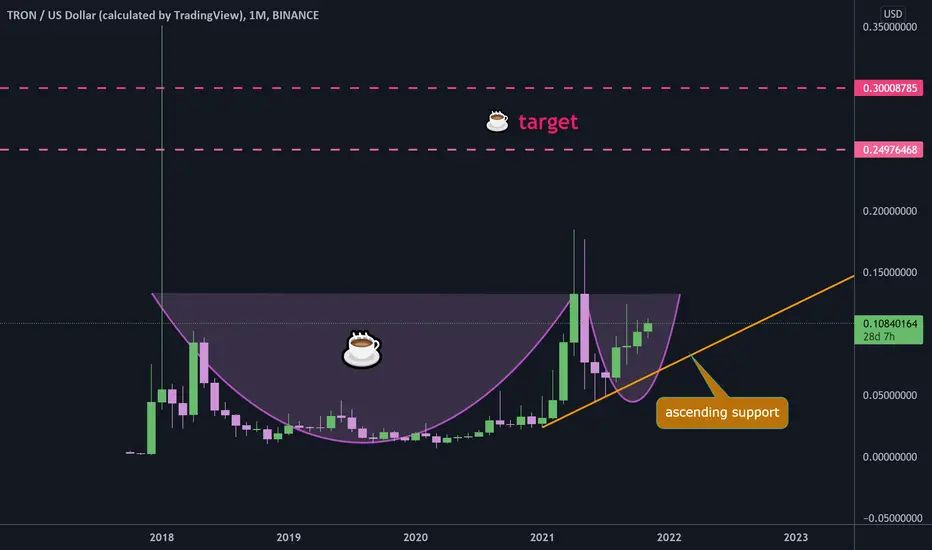
TRX cup and handle to $0.25#TRXUSD
$TRX can shape a cup and handle pattern in monthly time frame, if price success to break out from $0.132 then can easily go up toward $0.25 or even $0.3
if price drop and close below ascending support line this scenario will be invalid.
TRX Going to have a massive movementAccording to weekly chart ,TRX is Forming beautiful cup and handle.
up to end of DEC its so possible reach a new crest.


TRX/USDDo you think TRON can break his historical resistance?
I have identified price targets in the event of a fall or rise in the price of felt. I see less chance of a fall

11c Break Can Be the CatalystCoiling at around 10c for 60 days! This thing going to pop real soon. How soon? Above 11c is going to be the trigger imo. Then just hold it to reach 16c and then to 20c by end of the year is a very likely scenario. Good luck.

TRXUSDT - will there be an upward momentum?(Mini review) BinanceThe work takes place in the descending bullish canal.
Formation of a potential, inverted head and shoulders.
Work in the long from the middle of the accumulation channel.
Leaving the price below the level of 0.93 - cancellation and work from the boundaries of the accumulation channel
All details and target, as well as stop loss are shown on the chart.
Maximum leverage x3
% of the deposit 3-5%


TRON (TRX); Waiting On A DipAlways when I am searching for a setup, the most important to me is that I focus on clear path. But what is actually a clear pattern? For me that's the structure where I recognize the direction and the Elliott wave pattern in the first minute after I open a price chart. And sometimes we will have to scan a lot of markets to find any good path.
Well, today I stopped at TRON (TRX), where I see a nice rally away from June low, in five waves, so the current reversal down is normal and will ideally unfold in three waves. Wave c projection is at 0.06-0.08 area where I will pay a close attention to a potential bounce and opportunity on the long side while 0.046 is in place. Will it come down to that level? Well, I do not care, and I know what to look for if it will. If not, I just ignore and move on. Alerts are on.
Grega

TRON (TRX) - October 25Hello?
Welcome, traders.
By "following", you can always get new information quickly.
Please also click "Like".
Have a nice day.
-------------------------------------
(TRXUSD 1W Chart) - Mid-Long-Term Perspective
Above the 0.03074453-0.04413840 section: expected to continue upward trend
(1D chart)
Resistance section: 0.11243825-0.12543392
First support section: near point 0.08644692
Second support section: 0.04745992-0.06045559
You need to keep the price in the 0.08644692-0.11243825 section to see if you can break out of the downtrend line.
If the price is maintained above the 0.10168507 point, it is expected to move towards resistance.
A move above the resistance zone is expected to accelerate the uptrend.
If a decline occurs in the first support zone, a short-term stop loss is required as it may move down to the second support zone.
However, you can touch near the 0.07500028 point and rise, so you need to think about how to deal with it.
On the CCI-RC indicator, the CCI line is attempting to rise above the +100 point.
If the CCI and EMA lines move higher than the +100 point, the uptrend is expected to accelerate.
------------------------------------------
(TRXBTC 1W Chart) - Mid-Long-Term Perspective
Over the 259 Satoshi-318 Satoshi section: It is expected to create a new wave.
(1D chart)
It is necessary to check whether there is any movement that deviates from the 114 Satoshi-207 Satoshi section.
However, if it falls from the 154 Satoshi point, it can touch the 114 Satoshi point, so careful trading is required.
------------------------------------------
We recommend that you trade with your average unit price.
This is because, if the price is below your average unit price, whether it is in an uptrend or in a downtrend, there is a high possibility that you will not be able to get a big profit due to the psychological burden.
The center of all trading starts with the average unit price at which you start trading.
If you ignore this, you may be trading in the wrong direction.
Therefore, it is important to find a way to lower the average unit price and adjust the proportion of the investment, ultimately allowing the funds corresponding to the profits to regenerate themselves.
------------------------------------------------------------ -----------------------------------------------------
** All indicators are lagging indicators.
Therefore, it is important to be aware that the indicator moves accordingly with the movement of price and volume.
However, for the sake of convenience, we are talking in reverse for the interpretation of the indicator.
** The MRHAB-O and MRHAB-B indicators used in the chart are indicators of our channel that have not yet been released.
(Because it is not public, you can use this chart without any restrictions by sharing this chart and copying and pasting the indicators.)
** The wRSI_SR indicator is an indicator created by adding settings and options to the existing Stochastic RSI indicator.
Therefore, the interpretation is the same as the traditional Stochastic RSI indicator. (K, D line -> R, S line)
** The OBV indicator was re-created by applying a formula to the DepthHouse Trading indicator, an indicator disclosed by oh92. (Thanks for this.)
** Support or resistance is based on the closing price of the 1D chart.
** All descriptions are for reference only and do not guarantee a profit or loss in investment.
(Short-term Stop Loss can be said to be a point where profit and loss can be preserved or additional entry can be made through split trading. It is a short-term investment perspective.)

TRX chart during the last daysLet's see if it can pass the resistant area and break up its down trend....

TRX super bullish - Target 0.14#TRX/USDT Update:-
$TRX currently trading at $0.103
TRX has broken again his resistance
Lot of volume. All the signals are green :-)
Our next target is 0.14 !
What do you think ?
Please click LIKE button and Appreciate my hard work.
P.S If you are interested in real time updates on your cryptos, please let me know.
Thank you.

Tron TRXUSD - Elliott wave + Massive channel!- On the chart we can see an incomplete Impulse Elliott Wawe (5th wave).
- Rounding bottom or cup and handle is also printing on the chart.
- Volume is very bullish and also RSI is prepared for another pump!
- Target is 1:1 fib trend-based extension + top of the ascending channel + 5th elliott wave
- For expected duration of the trade, probability, stop loss, profit target, entry price and risk to reward ratio ( RRR ) - please check my signature below ↓
- Huge bullish volume is also one of the positive signs!
- If you want to see more of these ideas, hit "Like" & "Follow"!


TRX/USDT - Potential 95% setupHello Traders!
TRX has started a new business cycle.
At the moment, the price of the asset is correcting along with the market.
As a reminder, Tron is also an ecosystem, and the project's founder never forgets to tap into the info-trend.
Once liquidity starts flowing from the index to altcoins, the business cycle will continue.
You may look for comfortable entry points to buy at the bottom of the range of $0.079000 - $0.093000.
It's reasonable to place a stop loss under the $0.065000 level.
The targets of purchases will be profit fixation in the range of $0.146000 - $0.164300.
Good luck and watch out for the market
P.S. This is an educational analysis that shall not be considered financial advice

NeutralHi guys, well, according to the analysis, we are in a triangle, we can not expect to climb until we get out of it. If we get out of the pattern safely, we will enter the long position. The intersection of the downtrend is with the support line, but the price may move before this intersection

Price near the resistance will it able to break it ?Price near the resistance will it able to break it ?

TRON (TRX) - BREAKOUT!Signal: Breakout
1st Target: $0.105
2nd Target: $0.120
Comment: Large volume + break above local highs

