Tron Overtakes Cardano: Is This the Beginning of a Bullish Run?The cryptocurrency market has been a rollercoaster in recent times, with various digital assets experiencing significant price fluctuations. In a surprising turn of events, Tron (TRX) has managed to outperform its rival, Cardano (ADA), with a remarkable price surge in the past week. This unexpected development has caught the attention of investors and analysts alike, sparking speculation about TRX's potential for further growth.
One of the most compelling indicators of investor interest is the open interest, which represents the total number of outstanding derivative contracts for a particular asset. In the case of Tron, the open interest has skyrocketed by a staggering 52% in the last 24 hours. This substantial increase suggests a growing appetite for TRX among traders, potentially fueling further price appreciation.
The surge in open interest could be attributed to several factors. Firstly, the recent price rally of TRX has undoubtedly attracted the attention of investors seeking outperforming assets. Secondly, the underlying fundamentals of the Tron network, such as its focus on scalability and decentralized applications (dApps), may be gaining traction among developers and users.
If TRX manages to close a weekly candle above the crucial $0.15 resistance level, it could signal a significant shift in market sentiment and potentially trigger a more extended bullish trend. Breaking through this resistance would indicate strong buying pressure and could pave the way for TRX to challenge higher price levels.
However, it's essential to approach this development with caution. The cryptocurrency market is highly volatile, and past performance is not indicative of future results. While the current trends for TRX appear promising, several factors could impact its price trajectory. These include broader market conditions, regulatory developments, and the overall adoption of blockchain technology.
As with any investment, conducting thorough research and due diligence is crucial before making any decisions. Investors should carefully evaluate the risks and rewards associated with TRX and consider diversifying their portfolios to manage exposure to market volatility.
In conclusion, Tron's recent outperformance of Cardano and the surge in open interest have generated excitement among investors. While the potential for a bullish breakout exists, it's essential to maintain a balanced perspective and consider all factors before making investment decisions. The cryptocurrency market remains unpredictable, and staying informed about market trends and fundamental analysis is vital for navigating its complexities.
TRXUSD trade ideas

TRX Tron Monthly Ascending Triangle BreakoutTRX Tron about to breakout of a giant ascending wedge on the monthly charts. Correlation to bitcoin at the lows, TRXBTC ratio forming massive bottom signals. Volume trend in line with breakout timing.
Some huge stats that are going to catch people off guard, leading to strong price action once this breaks out:
1) Google is now voted in as 1/27 super validators on the network
2) Total volume surpassing visa network with onchain volume nearly the 50% mark
3) Most active users of any chain
4) USDT (stablecoins) as "killer app". US Gov realizing that major countries are no longer buying T-Bills (and actually selling them) while stablecoins continue to drive huge demand from the developing world
5) The only chain with actual FREE transactions if you stake enough TRX
6) The only deflationary chain with a 6 year proven record and 0 downtime or failing transactions

TRX Buying, Good Idea. Buy low now sell High TRX is making Higher High and Higher Low in 1 hour Patter.
TRX broken the resistance level can move upwards.
TRX charts has not bearish divergence and can continue the bullish momentum

TRX Bullish Bias (Monthly)TRX Price $0.133197
TRON ROI 6909.8%
Market Cap $9,544,890,728
Market Cap Dominance 0.38%
Trading Volume $5,067,746,034
Another coin that fell off many people's portfolios after the broken hearts and lack of movement after the 2017 hype. Here are a couple of my proposed scenarios. In order for me to maintain a longer time bias to the upside and to maintain the structure, any retrace would need to maintain the support above the .50 retrace at minimum. Watch for either a sharp rejection after median hit; or if price hovers for weeks, and depending on market sentiment as a whole, bullish bias to increase with targets at upper parallel. More detailed charts will be posted in due time.
Remember : Bullish above median, and typically bearish below. Schiff and Modified are practically identical in structure (owing to passage of time). But Original has maintained structure and is not a problem as of yet. However, Original PF would put price moving much more quickly and a median at ~30-70. Highly improbable. Hence, the favoring of the modified/schiff variations. Watch for signs of weakness. See below

Long-Term Time Target Says Acceleration Phase Begins in JulyWhen taking the time from the high of 2018 to the high of 2021 and adding it to the high in 2021 (see large orange boxes) we get a clear time target for the end of this 6.5 year correction on TRX and many other utility tokens like XRP. This puts the time target for the end of this correction around July of this year. This is also likely to coincide with the end of the SEC v Ripple trial.
After we pass this time target, we should end the volatility compression phase and begin an acceleration phase in utility tokens, with many tokens seeing vertical upward movements similar to 2017. This means some tokens like XRP and TRX could see moves of over 1000% in just one 1 month, and TRX specifically may even see a move of over 10,000-20,000% in a single month as it did in 2017. As in 2017, these huge moves will only be the start of a larger bull market which could last for at least 1 year and see massive breadth throughout the crypto market.
However, before July we could continue to see slightly lower prices. For TRX that could mean we go to around or under 10 cents as we continue to retest the top of the yellow triangle breakout. Either way, July is shaping up to be an extremely significant month for crypto based on the technical time target, breakout pattern, wave count, and the likely conclusion of the SEC v Ripple trial.

TRX - ABOUT TO BREAK OUT OF MULTI YEAR TRIANGLE - Long TRX - about to break out of multi year triangle
limit buys off the BAGL (bottom ascending grindline)
Super relative strength vs BTC atm.
Just keep buying things that keep going up

Cup and Handle Strong Bullish Pattern, Take trade after breakout and always manage your risk and do your own analysis before taking any trade.

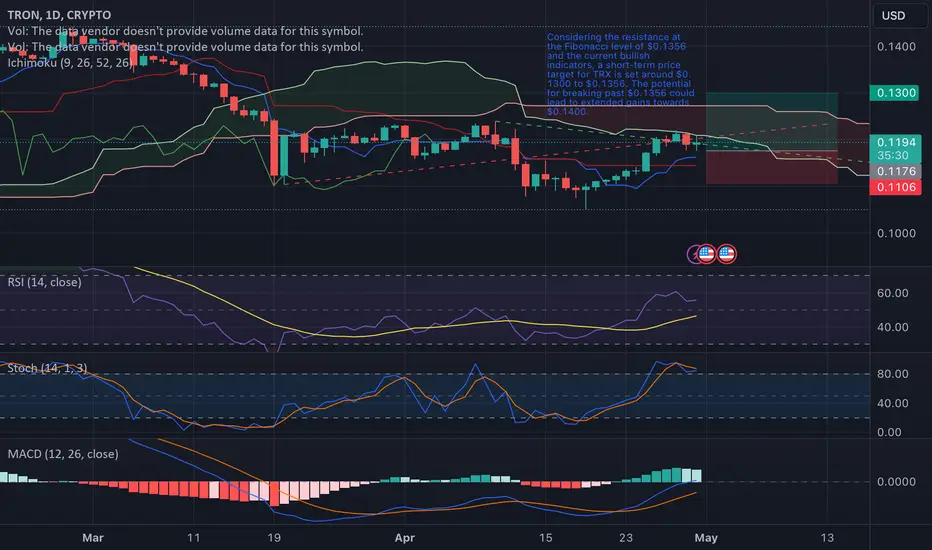
TRON (TRXUSD) Technical AnalysisTRON (TRXUSD) has experienced a varied trend over the past few months, showing signs of both bullish and bearish momentum. As of the last available trading session, TRON trades at $0.1193, showcasing a modest intraday gain. The trading environment is marked by fluctuations, and our analysis will delve into various technical indicators to forecast potential price movements and provide trading insights.
Technical Indicators Breakdown
Moving Averages: The Exponential Moving Averages (EMAs) and Simple Moving Averages (SMAs) across various periods largely signal 'Buy'. This uniformity suggests a strong underlying bullish sentiment. Particularly, the EMA (10) at $0.1174 and SMA (10) at $0.1167 reinforce short-term positive trends.
MACD (Moving Average Convergence Divergence): The MACD level on the daily chart shows a slight bullish signal at 0.0001, implying that the momentum could be shifting in favor of the bulls, albeit modestly.
RSI (Relative Strength Index): The RSI stands at 55.66, which indicates neither overbought nor oversold conditions, aligning with a more neutral, yet slightly bullish market sentiment.
Stochastics: The %K value at 87.25 and the Stochastic RSI both suggest that the asset is nearing overbought territory, potentially indicating an upcoming pullback or consolidation.
Candlestick Analysis and Chart Patterns
The recent candlesticks show a series of green candles indicating a recovery from previous bearish trends. The market appears to have found support at $0.1176, just above the 50-day EMA. The presence of a bullish engulfing pattern last week signals potential continued upward movement.
Fibonacci Retracements and Pivot Points
Fibonacci Retracements: The key resistance level lies at $0.1356 (1.618 Fibonacci extension). Immediate support is at $0.1145 (0.618 retracement level).
Pivot Points: The main pivot point rests at $0.1251. Resistance levels R1 and R2 are found at $0.1398 and $0.1567, respectively, while support levels S1 and S2 are at $0.1082 and $0.0935.
Volume and Market Sentiment
Trading volume has shown variability, yet there is no sharp increase, indicating that the recent price increase isn’t backed by heavy buying, which may question the sustainability of the rally.
Price Prediction and Trading Strategy
Price Target: Considering the resistance at the Fibonacci level of $0.1356 and the current bullish indicators, a short-term price target for TRX is set around $0.1300 to $0.1356. The potential for breaking past $0.1356 could lead to extended gains towards $0.1400.
Entry and Exit Points: Traders might consider entering positions around the $0.1176 to $0.1190 range, leveraging the current support levels. It is advisable to place a stop-loss just below the recent swing low at $0.1082. The exit strategy should aim for the first resistance near $0.1300, with a possibility to hold for $0.1356 if market conditions remain favorable.
Risk Management: Given the current market conditions, maintaining a tight stop-loss and monitoring the reaction near key resistance levels will be crucial to manage risk effectively.
Conclusion
TRON’s market position, according to technical analysis, indicates a cautiously optimistic outlook with room for potential growth in the short term. Traders should stay alert to the volume and price action near critical technical levels for better confirmation of the anticipated movement. As always, consider integrating these insights with broader market analysis and individual risk tolerance before trading.
TRX Sitting on Launch Pad to $10+TRX Has broken out from this 6 year triangle and perfectly retested the trendline. As long as support at 11 cents holds TRON looks ready to finally end 6 years of volatility compression with a massive decompression that could send prices vertical in a similar fashion as what we saw in 2018.
Best case scenario TRX is over $10 next quarter, but at minimum we should go to at least $1 next quarter and then could hit $10 later this year or next year.


TRXLong time no see with TRX :D I still think this looks bullish. Can't see a distribution like action. Most likely, dalai lama to the highs, a little pullback, big green candles.

Potential Bull Market Continuation (Elliott Wave)After reassessing the wave structure on TRX with Glenn Neely, particularly the structure which began at the high in 2021 up until now, it seems to indicate that we are in a complex correction which began with a triangle and is now ending with a diametric.
If this is correct, TRX should be beginning the next phase of the bull market now. This would mean that we see a move up to at a minimum over $1, and on the higher end could go over $10. This should happen over the next year.
To confirm this assessment, we should see a very strong move up this quarter, ideally about as strong as the red box that is drawn on the chart. Regardless of if we get a huge bull market here or not, it does seem like we should see some modest upside at the least. It's always much easier to see a top or bottom forming in real-time than it is to try to accurately predict the exact price any asset will be at some point in the future, and right now it seems like we have formed a bottom.
With inflation beginning to tick up again, this could be the rising sea that lifts all boats. Combine that with a steady and increasing burn rate on TRX and we could see some very high prices for TRX in the future.

TRXUSD Support Channel UpAMEX:TRX perform a good bullish wave, and reach channel up support.
This is a good moment to enter and follow bullish market at TRX.
we can buy now around 0.13620 or wait after bullish confirmation trendline broken up.
I will update this analysis if I found a new key level.
Don't forget to support this analysis to get a quick notification.
Happy trading, Good luck


TRX , heading to 2021 HIGH ?TRX broke above 2021 SEPT-DEC resistance $0.120.
as long as price above $0.12, we are still bullish with TRX.
next resistance 0.160 is MAY2021 high
MACD sloping up , indicate momentum is still favor to the bull.
DYODD

Huge upside for TRXI'm not too happy with the low volume. Look for an influx of volume after the breakout of the top of the triangle. Tron is finishing its 5th wave to push through the upper triangle something it hasn't done since Jan of 2018. Doubling the triangle gives you a target above $20. Not bad with a current price under 0.14

TRX BullNothing special. Just a few bullish patterns breaking at the same time. Don't bully the bears!

#TRON testing the breakout levelThis coin and ecosystem still has life as show in in the charts.
Even if its just a network to move dollars around in SE asia
That's a good enough usecase , considering the size of the population in that part of the world.
Therefore the gas token #TRX would very much be needed.
and positive price actions, sparks speculative juices which feed on the price.

TRON Burns 9.9 Million TRX Tokens TRON ( CRYPTOCAP:TRX ) executed a substantial token-burning event on February 14th. The initiative saw the elimination of 9.9 million CRYPTOCAP:TRX tokens from circulation. This decision aligns with TRON’s commitment to implementing deflationary measures and fostering value growth within its ecosystem.
The token burning event has already shown tremendous impacts on CRYPTOCAP:TRX price and market dynamics. Following the burn, CRYPTOCAP:TRX experienced a noticeable shift in price, reflecting investor sentiments towards the scarcity of $TRX. This move concurs TRON’s proactive approach to managing its token supply and enhancing the overall value proposition for its stakeholders.
TRON’s current market data reveals its standing within the cryptocurrency landscape. At the time of analysis, CRYPTOCAP:TRX is trading at a price of $0.13131 with a market cap of $11,460,558,876. The 24-hour trading volume stands at $335,101,295, showcasing significant market activity. With a circulating supply of 88,066,863,814 CRYPTOCAP:TRX and a total supply matching that figure, TRON exhibits stability in its token distribution.
TRON’s recent initiatives, particularly the token burning event, reflect a strategic approach towards managing its token economics. By reducing the circulating supply, TRON aims to create scarcity and rigorously drive up the value of $TRX. However, the long-term implications of such measures remain to be seen, as they depend on various factors including market sentiment and adoption. In terms of its position in the cryptocurrency market, TRON holds a noteworthy ranking, currently standing at number 12 in terms of market cap according to Coinmarket Cap.
Technical Analysis
CRYPTOCAP:TRX has been in an ascending trend. This February 2024, the asset has risen by 15%, reaching a new annual high beyond the $0.131 mark. It's currently difficult to pinpoint any resistance level capable of curtailing this robust buyer momentum.
The market might first respond to sellers around the $0.133 and $0.136 levels. Nevertheless, without unexpected negative developments, these thresholds are also at risk of being swiftly surpassed, thus becoming irrelevant. Therefore, engaging in short positions for this asset is generally discouraged.
If CRYPTOCAP:TRX undergoes a correction, the zones at $0.121–$0.124 and $0.117–$0.120 are seen as potential areas for buyer orders, making them suitable entry points for long positions. A shift to a downward trend could only realistically occur if Bitcoin falls below $44,500 eventually.

TRX - Tron Break out long sideAs We see on Tron coin, its appear to be an VCP pattern where the volatility were for to long contracted.
Breaking out as the image shows, from 0.085$ level to 0.12 minimum.
Cheers

TRXUSDT SHORTbearish retest , divergence is bearish too!
I am not in the mood to write the whole message!

TRX Price Eyes $0.20 With This Breakout RallyHigh Momentum Bullish Trend: TRX displays a strong bullish trend with an overhead resistance trendline breakout.
Rounding Bottom Reversal: The recovery trend in the weekly chart indicates a rounding bottom reversal, aiming to surpass a 3-year high.
Potential to Reach $0.20: A bullish breakout could fuel TRX's price to hit the $0.20 mark.
Recovery from $0.050: Following a correction phase in 2022, TRX has been on a reversal rally for the past 15 months.
Anticipation of Altcoin Season: Rising expectations for an altcoin season could significantly boost TRX's price.
151% Rise Since November 2022: TRX's price has risen by 151% from its low point in November 2022.
Neckline at $0.12 Mark: The rounding bottom pattern's neckline coincides with the 78.60% Fibonacci level.
Current Trading Price: TRX is currently trading at $0.1244, with a 2.80% intraday growth.
Technical Indicators - RSI and EMA: The RSI is nearing the overbought territory, and the EMAs show a bullish alignment.
Bullish Trend to $0.15 and Beyond: Maintaining dominance above $0.10 indicates a possible rally to $0.15 and potentially $0.20.
Risk of Reversal to $0.10: A reversal from the $0.12 mark could lead to a price drop back to $0.10.

Tron is above the neckline of a long standing logchart C&HStill working on a weekly candle close above the rimline of this cup and handle and also the top trendline of an even bigger symmetrical triangle pattern seen here on the logarithmic weekly chart. The smaller and more realistic potential breakout target here is for the cup and handle pattern, the one that’s al the way up at $23 is the target for the symmetrical triangles breakout. Seems improbable that Tron could somehow reach a price as high as $23 when considering how sketchy Justin Sun has seemed over the last few years but that is indeed what the chart reveals. I think the smaller cup and handle breakout target is much more probable. For now though we still don’t even have a weekly candle close above the rimline yet, so before getting too excited about Tron s price action I’d need at least 1-2 weekly candle closes above that trendline…maybe even 3-4. Something to keep an eye on here. *not financial advice*
