TRON’s $4 Billion Ambition: Justin Sun’s Bold Bet on Meme CoinsIn a move that could redefine the trajectory of the TRON network, Justin Sun, the founder and CEO of TRON ( BINANCE:TRXUSDT ), has forecasted an ambitious revenue target of $4 billion for the coming year. This projection, if realized, would be a landmark achievement for the blockchain platform, driven by a strategic pivot towards meme coins and adjustments to network fees.
The $4 Billion Revenue Peak
Justin Sun’s bold prediction isn’t just a number plucked out of thin air. The $4 billion target is rooted in a comprehensive strategy that leverages TRON’s strengths while embracing the growing influence of meme coins in the cryptocurrency market. Sun anticipates that $3 billion in revenue is a conservative estimate, with the potential to exceed $4 billion through network optimizations and community-driven initiatives.
Sun has laid out a plan where $1 billion of this revenue will be ‘burned’—a practice that effectively reduces the supply of CRYPTOCAP:TRX , potentially increasing its value. The remaining $2 billion is earmarked for stakers and to cover transaction fees, creating a more attractive ecosystem for users and investors alike.
The Meme Strategy: A New Frontier
Central to Sun’s revenue forecast is TRON’s renewed focus on meme coins—a category of cryptocurrency that has gained significant traction in recent years. Sun believes that the community-driven nature of meme coins aligns well with the decentralized ethos of TRON ( BINANCE:TRXUSDT ), making it a strategic growth area.
The launch of SunPump, a meme token launchpad on the TRON network, is a testament to this strategy. Despite being just 11 days old, SunPump has already generated over $1.1 million in sales, indicating strong market interest and potential for further growth.
Network Adjustments: Lower Fees, Higher Capacity
To support this ambitious growth, Sun has proposed lowering transaction fees and raising the energy limit on the TRON network. These adjustments are expected to increase daily transactions to over 20 million within three months, significantly boosting TRON’s market share.
By increasing the network’s energy capacity, more TRX tokens will be staked, enabling free transfers and enhancing the network’s overall profitability. These measures are designed to make TRON a more attractive platform for developers and users, fostering long-term growth.
TRON’s Integration with Dex Screener
In addition to its meme coin strategy, TRON ( BINANCE:TRXUSDT ) has recently achieved a significant milestone with its integration into Dex Screener, a leading decentralized exchange tracking service. This listing is expected to enhance TRON’s visibility in the decentralized finance (DeFi) space, attracting more users and liquidity to the network.
The integration with Dex Screener is seen as a critical step in TRON’s broader strategy to expand its ecosystem and capitalize on the growing DeFi market. Coupled with the recent minting of one billion USDT tokens on the TRON network by Tether, TRON’s liquidity and market presence are set to strengthen further.
TRX Price Forecast: Bullish Trends with Caution
As of the latest market analysis, CRYPTOCAP:TRX , the native cryptocurrency of the TRON network, is trading at $0.1572 down by 2.54%. Despite a minor correction, TRX is showing signs of a bullish trend, with the potential to reach $0.20 in the near term. If this momentum continues, CRYPTOCAP:TRX could even achieve a new all-time high of $0.50.
However, the market is not without risks. In a bearish scenario, TRX could stabilize around $0.14, with the possibility of further declines to approximately $0.135 if negative trends persist.
Conclusion: A High-Stakes Gamble
Justin Sun’s $4 billion revenue forecast and strategic pivot towards meme coins represent a high-stakes gamble for TRON. While the potential rewards are significant, the path to success is fraught with challenges. However, with Sun’s track record of bold moves and the network’s growing ecosystem, TRON could very well be on the cusp of a new era of growth and innovation.
As the crypto market continues to evolve, TRON’s ability to adapt and capitalize on emerging trends will determine whether Sun’s ambitious vision becomes a reality. For now, all eyes are on TRON as it navigates this exciting yet uncertain future.
TRXUSDT.P trade ideas

Tron (TRX): Price Is Way Overbought, Time To Sell?Tron coin is next on our radar and straight away, looking at the chart, you can see that the price is overbought.
Bollinger Bands are broken and RSI is in overbought zones. We are looking here for a local support zone to be reached (tested) and, from there, a possible break of support to happen as well!
Swallow Team

TRON: Cup & Handle Fulfilled and Magic Happened.After the last post, TRON move up with confident to the level of resistant of 0.618 and this is really one of the best move so far. Note that this is the usual level of pullback and possible to re-test level of 0.5 or 0.382. We are near the last week of August, 2024.

Does TRXUSDT Go to Target?When the TRXUSDT weekly chart is examined; It is observed that price movements continue on the trend line. As long as the 0.09257 level of the crypto is not broken down, it is evaluated that the price movements above the 0.11741 level can target the 0.34797 level by passing the 0.17982 level upwards.

TRON — Healthy Correction Or Going Parabolic?I mentioned it a couple of days ago. Tron's chart is one of the most sustainable out there.
• Growing HEALTHY since November '22
• Did only retrace moderately after March's peak
• Doesn't look over-heated despite a >200% growth
During the last few days, Tron has been crushing it:
• Pumped almost 40%
• Entered the top 10 by market cap (replacing ADA)
• Entered the upper band of its upward channel and touched the upper resistance.
So, what's next?
If Tron follows its path of the last years, we won't see it go much higher at this point. Instead, it will consolidate and gradually move higher. However, I expect Tron to stay in the upper band.
Can it go parabolic?
Sure, it can. However, from my perspective, it needs broader market support. I don't see Tron going parabolic as long as Bitcoin doesn't break out to the top.

What next for TRONWhat next for TRON
After TRON broke out of a consolidation zone on the 17th of this month, the push-up has been remarkable.
This asset is currently dancing around $0.15 zone. will this energy continue?
Zones to watch out for
Resistance: $0.16
Support: $0.15

Tron | Major Correction (Biggest Since 2021)Bitcoin's capitulation event will affect the entire Cryptocurrency market...
➖ Tron is great.
➖ Tron is a true Cryptocurrency —an amazing project.
➖ Tron has its own economy and really works to help people exchange value. We love it.
Technical Analysis
➖ Looking at this weekly chart, TRXUSDT, the first thing that is revealed is the strong uptrend, a very long one. This uptrend is coming to its end.
➖ The pattern that reveals the end of the uptrend is the rounded top, followed by a second rounded top coupled with a lower high.
➖ These signals and patterns are accompanied by, first, an increase in bearish volume and, second, a decrease in overall trading volume.
Price Action Dynamics
Expect the drop to be fast and strong. TRON is not looking to be in a "bear market" for long as there is no bear market, we are simply looking at a strong correction that is only natural, normal and expected after such a long period of growth.
This pair is really strong, so some of the targets can miss. The first one, black line, is sure to hit. Actually, knowing Crypto, it will crash and flush everything up just to shake things out a little bit before a year that will be forever remembered as the year when Cryptocurrency changed the world.
👉 In the year 2025 people will know Crypto just as they know Email, Cellphones and Drugs.
Namaste.

Tron TRX price goes against the marketWhile the entire crypto market is falling, the TRX price is rising!)
Maybe this is the reaction of the #TRXUSDT price to the "rumors" that Justin Sun is working on a full-scale launch of #TRON-based memecoins?)
We will find out soon...
Nevertheless, as long as the #TRXUSD price is kept above $0.115-0.12, it will remain in a "long phase".
_____________________
Did you like our analysis? Leave a comment, like, and follow to get more

$TRX Holders!!! Warning 0.0supper strong weekly resistance is going to drop the price
so be carefull about your Long Positions 📈❌
Short Position in Trx recommended 📉✅
@TradeWithMky

TRXUSDT.PWe do have an uptrend on TRX 1D and 1W. The price has retested the support zone successfully, and now accumulating above it. Expecting trend continuation.
Rising volume after long accumulation in the uptrend give us the clue, that both targets could be covered till the 2025.
Trade cancellation: If support will be lost, and price would fix below it.
DYOR

TRX look good to go up 5 win 2 loss so farentry 0.13558
TRX look good to go up 5 win 2 loss so far
RR 1:1

TRX coin look good to go upentry 0.13455
SL 0.13386
TP 1:1
LIVE TRADING,INTRADAY,CRYPTO,stock market,how to trade,livetrading,trading,forex,forextrader,update,live,tecnical,annalys,market,stratgy,tecnical annalys,fundamental,education

TRX (Crypto TRON-USD) BUY TF H1 TP = 0.1354On the H1 chart the trend started on Aug. 05 (linear regression channel).
There is a high probability of profit taking. Possible take profit level is 0.1354
Using a trailing stop is also a good idea!
Please leave your feedback, your opinion. I am very interested in it. Thank you!
Good luck!
Regards, WeBelievelnTrading

Crypto Overview: Technical Ratings of top 40 cryptosAfter screening the top 40 cryptocurrencies, it has become evident that TRXUSDT (TRON) outperforms and stands out as the only bullish coin in the current crypto market landscape. With its recent bullish signal on 7/22/2024 and if it remains its bullish rating, it's anticipated that TRON will probably lead the charge in the upcoming market uptrend.

Tron (TRX): Plan A or Plan B? Price At Strong ResistanceTron is in a strong zone where the price is on the verge of a breakout or breakdown.
We are now waiting for further confirmation of the scenario here so we keep monitoring the current zone where the price is!
Swallow Team

TRX trade setupTron (TRX) is one of my favourite coins which I choose to invest in.This is trade (investment) setup on larger timeframe. I am not looking to reach targets 2,3,4 and 5 very soon, that could be year(s). I will sell most of my capital on targets 3,4 and 5. Small portions will be sold on targets 1 and 2.
Entry Zone: 0.27 – 0.34
Buy Zone: 0.024 – 0.03
Target 1: 0.11 – 0.12 (102%)
Target 2: 0.14 – 0.14 (151%)
Target 3: 0.17 – 0.18 (211%)
Target 4: 0.24 – 0.25 (335%)
Target 5: 0.31– 0.32 (454%)

Tron (TRX) Chart Analysis — One Of The Most Exciting Charts!In this video, I deep dive into the Tron (TRX) chart. Starting on the 1D chart, we discover the incredible long-term uptrend Tron has been delivering. I discuss crucial levels and why Tron is an interesting investing opportunity.
Afterwards, we move one level lower and discuss short-term trade options on the 4H chart.
Would love to get your feedback and opinions. Share it in the comments!

TRX is in a dangerous placeThis analysis is an update of the analysis you see below in the "Related Ideas" section.
The triangle of the previous analysis is still standing and only the D wave has become more time-consuming.
We expect the formation of wave E from TRX.
It can be rejected from the supply range to the green box.
The targets are marked on the picture.
Closing a daily candle above the invalidation level will violate the analysis.
For risk management, please don't forget stop loss and capital management
When we reach the first target, save some profit and then change the stop to entry
Comment if you have any questions
Thank You

TRX. 0.12766. LONGThe token continues its confident upward movement. Excellent accumulative movement. Slight volatility. And emptiness lies ahead. Even though we only have a local level, this is a good point to enter into a continuation position.

Tron — Pumping Since 2022Among altcoins, Tron is definitely a rarity at the moment. While many other tokens are down 70%, 80%, or even 90% and trade close to their bear market low, Tron has constantly moved upwards since late 2022!
In fact, the token has been trading in a wonderful upward channel for more than two years! Even the latest market drop last Monday didn't force Tron to leave its path—it simply bounced from the bottom.
As a result, I expect Tron to move back to the channel top in the next days/weeks. Moreover, if the bullish momentum continues, we could see another breakout attempt—similar to the one in March.
However, even if this won't happen, Tron provides nice trading opportunities based on the channel.
Moreover, if we enter a bull run in late 2024 or 2025, Tron should be among the top tokens — at least based on its recent performance.

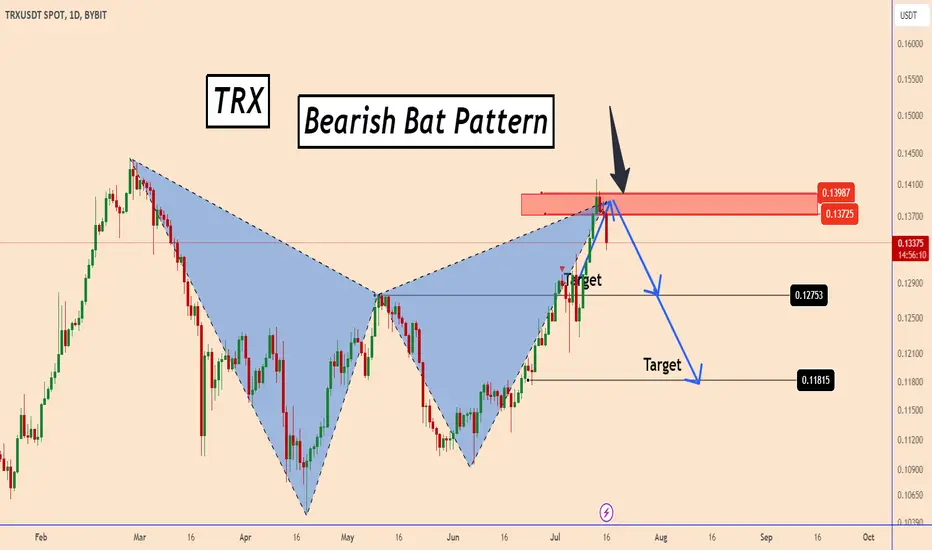
TRX : Harmonic Bat Pattern Completed - next move downTRX : Harmonic Bat Pattern Completed - next move down
In early July TRX was showing chances of completing a bearish harmonic pattern.
After the price completed the pattern of the bullish wave it was developing, the Harmonic pattern showed its power by creating the first signs of a reversal.
So far, the price development looks good. It may still have some ups and downs, but the direction should be down again.
We can see TRX moving down to 0.1180
Thank you and Good Luck!
Previous analysis:
TRXUSDT.PTRXUSDT.P is in bullish trend.
Potentially printing HH and HL.
No sign of reversal here buyers are strongly active.
We buy at CMP.

TRX - Slow and easy trade#TRX/USDT #Analysis
Description
---------------------------------------------------------------
+ Price has hit the support line and successfully bounced back from it with a long wick.
+ Overall trend is looking strong and we can expect the price to hit the next resistance line
---------------------------------------------------------------
VectorAlgo Trade Details
------------------------------
Entry Price: 0.1262
Stop Loss: 0.1156
------------------------------
Target 1: 0.1298
Target 2: 0.1333
Target 3: 0.1391
------------------------------
Timeframe:
Capital Risk: 1-2% of trading amount
Leverage: 5-10x
---------------------------------------------------------------
Enhance, Trade, Grow
---------------------------------------------------------------
Feel free to share your thoughts and insights.
Don't forget to like and follow us for more trading ideas and discussions.
Best Regards,
VectorAlgo
