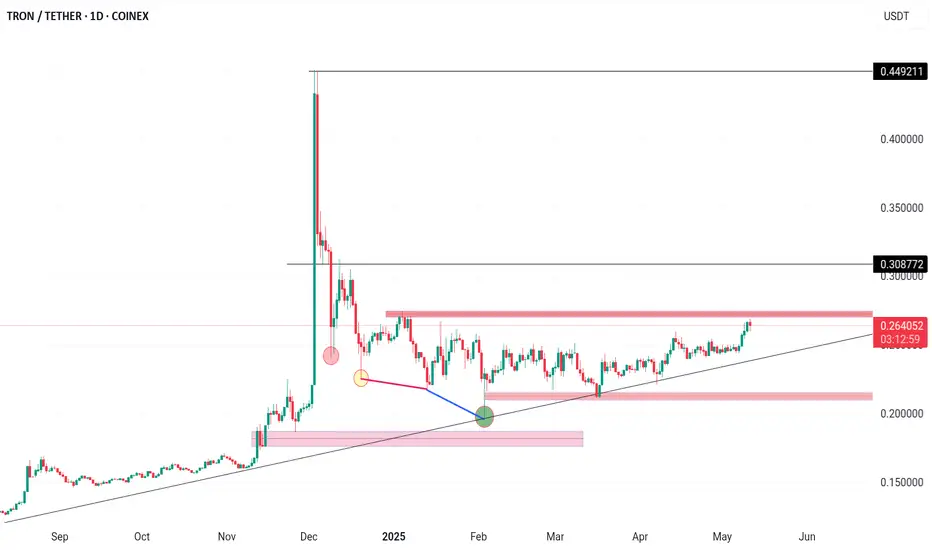
The Hidden TRX Buying Pressure Most Traders Are MissingI didn't draw the blue box below now, it's from my previous analysis,
I told you to wait and those who waited should be pretty happy right now TRX is still generally bullish and this is our current blue box and our assessment is as follows:
Contrary to the general market sentiment you might be seeing, my analysis of TRX is leaning positive.
What's caught my eye is the clear presence of buyers stepping in. This isn't just a fleeting moment of interest; the strength I'm observing suggests these buyers have the conviction and capital to genuinely drive the price upwards.
As always, I'm not just making a blind call. I'm seeing this strength reflected in the volume footprint, indicating genuine accumulation. The CDV (Cumulative Delta Volume) is also showing a positive divergence, supporting the idea of increasing buying pressure.
Now, while the overall market might be showing different signals, the concentrated buying activity in TRX is compelling. I'll be watching for low timeframe (LTF) confirmations of this strength continuing. If we see sustained buying volume and positive price action on the lower timeframes, this bullish outlook will be further validated.
It's important to remember that I focus on coins showing sudden and significant increases in volume, and TRX is currently exhibiting this. This concentrated interest from buyers suggests a potential for significant price movement, regardless of broader market headwinds.
Keep TRX on your radar. Sometimes, the real opportunities lie where the focused strength of buyers can overcome general market noise. You know I only bring you what I see as high-potential setups. Let's see if TRX can prove the broader market wrong.
📌I keep my charts clean and simple because I believe clarity leads to better decisions.
📌My approach is built on years of experience and a solid track record. I don’t claim to know it all but I’m confident in my ability to spot high-probability setups.
📌If you would like to learn how to use the heatmap, cumulative volume delta and volume footprint techniques that I use below to determine very accurate demand regions, you can send me a private message. I help anyone who wants it completely free of charge.
🔑I have a long list of my proven technique below:
🎯 ZENUSDT.P: Patience & Profitability | %230 Reaction from the Sniper Entry
🐶 DOGEUSDT.P: Next Move
🎨 RENDERUSDT.P: Opportunity of the Month
💎 ETHUSDT.P: Where to Retrace
🟢 BNBUSDT.P: Potential Surge
📊 BTC Dominance: Reaction Zone
🌊 WAVESUSDT.P: Demand Zone Potential
🟣 UNIUSDT.P: Long-Term Trade
🔵 XRPUSDT.P: Entry Zones
🔗 LINKUSDT.P: Follow The River
📈 BTCUSDT.P: Two Key Demand Zones
🟩 POLUSDT: Bullish Momentum
🌟 PENDLEUSDT.P: Where Opportunity Meets Precision
🔥 BTCUSDT.P: Liquidation of Highly Leveraged Longs
🌊 SOLUSDT.P: SOL's Dip - Your Opportunity
🐸 1000PEPEUSDT.P: Prime Bounce Zone Unlocked
🚀 ETHUSDT.P: Set to Explode - Don't Miss This Game Changer
🤖 IQUSDT: Smart Plan
⚡️ PONDUSDT: A Trade Not Taken Is Better Than a Losing One
💼 STMXUSDT: 2 Buying Areas
🐢 TURBOUSDT: Buy Zones and Buyer Presence
🌍 ICPUSDT.P: Massive Upside Potential | Check the Trade Update For Seeing Results
🟠 IDEXUSDT: Spot Buy Area | %26 Profit if You Trade with MSB
📌 USUALUSDT: Buyers Are Active + %70 Profit in Total
🌟 FORTHUSDT: Sniper Entry +%26 Reaction
🐳 QKCUSDT: Sniper Entry +%57 Reaction
📊 BTC.D: Retest of Key Area Highly Likely
📊 XNOUSDT %80 Reaction with a Simple Blue Box!
📊 BELUSDT Amazing %120 Reaction!
📊 Simple Red Box, Extraordinary Results
📊 TIAUSDT | Still No Buyers—Maintaining a Bearish Outlook
📊 OGNUSDT | One of Today’s Highest Volume Gainers – +32.44%
I stopped adding to the list because it's kinda tiring to add 5-10 charts in every move but you can check my profile and see that it goes on..
TRXUSDT trade ideas

TRX/USDT Trade Setup & Why This Fibonacci Level Matters🚨 TRX/USDT Trade Breakdown 🔍💹
Taking a close look at TRX/USDT (Tron) — the chart is showing a strong, sustained bullish trend on the 4H timeframe 📈🔥.
At the moment, I’m waiting for a pullback into equilibrium ⚖️. If we apply a Fibonacci retracement from the current swing low to the recent high, the 50% level stands out as a key area of interest for a potential entry 🎯.
🧠 This zone offers a high-probability area to look for trend continuation, provided price respects it and holds structure. My Fibonacci tool also outlines projected targets, and I walk you through everything in the video 📽️🗺️.
📌 This is NOT financial advice — just my personal analysis and approach. Always do your own research and manage your risk accordingly. ⚠️
👇 Let me know your thoughts in the comments and don’t forget to like & subscribe for more setups!
TRX/USDT Trade Setup & Why This Fibonacci Level Matters

TRX RAYNJ menu for a few minutes then we will head to bed early to bed now so I don't know what I want for a while and then we will head to the office today and I want to the house and then we will go and then I can go

Tron (TRX): Cooking Up a Good Shorting OpportunityWe are seeing the first successful retest of EMAs since breaking them, where TRX has done the first step towards the possible movement to lower zones here.
What we are now looking at is the $0.24 area, where upon successful dominance from sellers in that region we will be taking a short position with 1:3 risk and reward ratio trade.
Swallow Academy

Tron (TRX): Previous CME Filled / New CME FormedTron coin has filled our previous CME gap, and now we are looking at a newly formed CME gap.
With recent rejection from the resistance area as well, we are seeing a possibility of that bearish CME gap being filled within days, where then we will be testing the 200EMA.
Ideally we should see a proper downward movement once we see a break from that EMA, but meanwhile, the first target remains near that EMA.
Swallow Academy

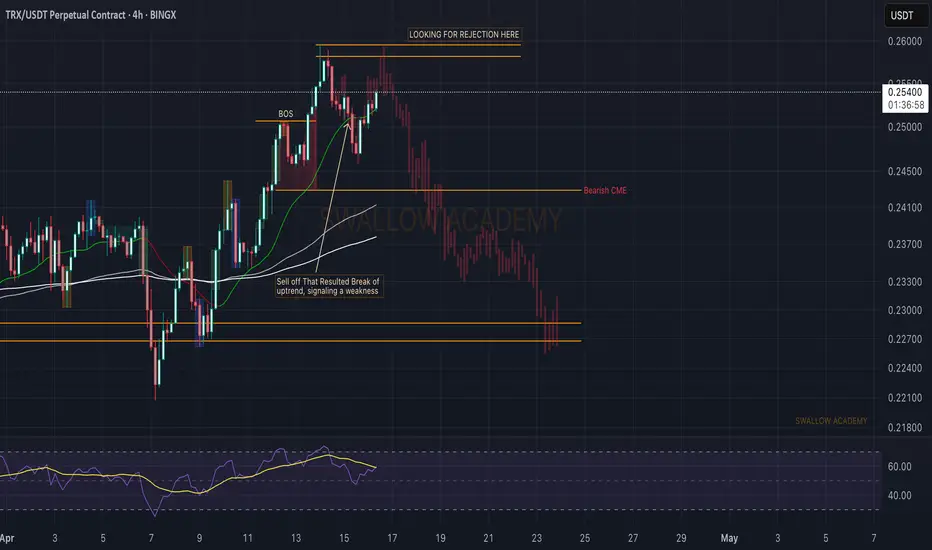
Tron (TRX): Bearish CME + Signs of WeaknessWe are seeing a possible downward movement to occur on Tron coin, where recently we have broken from that pattern of BOS on a bullish trend where we had a decent sell-off, which showed the dominance of sellers in that region.
As we are seeing a smaller bullish overtake now, we expect to see something like a "double top" pattern, where afterwards we want to see a break of the neckline/support, which then would result in a market structure break and give us a good entry for short.
Swallow Academy
Tron (TRX): Broken Neckline | We Might See Sharp DropTron coin seems a good opportunity for a short here where we recently had a nice breakdown of the local neckline zone, then filled the FVGs on a smaller timeframe on the upper zones and now we are back below the neckline zone.
Perfect opportunity, as long as some surprise news will not come on markets 👀
Swallow Academy

Tron (TRX): Possible Double Top Pattern FormingTron coin is approaching approachingthe neckline zone where recently we formed a second top, which gave us a sign of a potential upcoming "double top" pattern. We are waiting for a breakdown to happen.
As soon as we get the breakdown, we will be looking for a short position where we might catch a good R:R position.
Swallow Team


TRX LONG TRADE SETUPTRX USDT is currently holding at a strong support zone , with a high probability of an upward price move. Additionally, the 50 EMA is providing strong support during the retest.

TRX/USDT Potential UpsidesHey Traders, in today's trading session we are monitoring TRX/USDT for a buying opportunity around 0.2680 zone, TRX/USDT is trading in an uptrend and currently is in a correction phase in which it is approaching the trend at 0.2680 support and resistance area.
Trade safe, Joe.

Lingrid | TRXUSDT Trend Continuation FormationBINANCE:TRXUSDT remains in a clear uptrend, bouncing within its upward channel and forming higher lows. After a strong rally, price is consolidating around the $0.2680 support near the trendline, with signs of a bullish continuation pattern. A break above $0.2750 could fuel momentum toward the $0.2865 resistance zone. As long as price respects the rising trendline, the structure favors buyers.
📈 Key Levels
Buy zone: 0.2680 – 0.2710
Buy trigger: rebound from trendline support
Target: 0.2865
Sell trigger: break below 0.2680
💡 Risks
Loss of trendline support could shift bias short-term.
Broader market pullbacks may suppress TRX upside.
Weak breakout could lead to fakeout and reversal.
Traders, if you liked this idea or if you have your own opinion about it, write in the comments. I will be glad 👩💻

TRX USDT SHORT TRADE SETUPTRX is currently facing rejection at the strong resistance , with a high probability of a downward price move.

Trxusdt ,,,, technical analyst Tron has formed a bullish flag pattern, and it can go up as high as the length of the flag bar. Please trade with your own analysis. I am not responsible for your losses or losses. because this analysis is a personal guess and analysis.

TRX/USDT – Bearish Setup at Key Supply ZonePrice has pushed back into a 4H Fair Value Gap (FVG) and a clearly defined supply zone between 0.2730 and 0.2750 after a strong bullish move. This area has previously rejected price multiple times, suggesting institutional selling pressure.
I’ve taken a short position from this zone with a stop loss just above the FVG (~0.2784) and a target at the recent demand level around 0.2625, aligning with the lower support level.
Confluences:
• 4H FVG acting as supply.
• Bearish reaction at previous structural highs.
• Risk-reward ratio favorable (around 2.5R).
If price breaks and closes above 0.2785 with strong momentum, the setup becomes invalid. Until then, I’ll be monitoring for rejection signals and potential continuation to the downside.

TronTrx usdt Daily analysis
Time frame hourly
Short time Target 0.278 $
Risk rewards ratio >3.5 👈👌
This short time analysis is in the big Daily analysis that you can see in my forecasts before

potential bull movement upwards in the short termpotential bull movement upwards in the short term for TRX, potentially reaching above 1$

TRX USDT SHORT POSITION SETUPTRX is currently facing rejection at the strong resistance , with a high probability of a downward price move. Additionally, a nearby price action support line may act as a magnet, pulling the price toward it.

Trx is Ready for Jump Potential Scenarios:
Bullish:
A breakout above 0.28 USDT could lead to a test of the next resistance near 0.35–0.45 USDT.
Trendline support continues to hold.
Bearish:
Rejection from 0.28 USDT may lead to a pullback toward the 0.22 USDT support or the trendline.
A breakdown below the trendline could indicate weakening momentum.
TRXUSDTTRX Price Analysis – Key Levels to Watch
🔍 Current Price Action:
TRX is currently trading within a tight range, with key resistance at 0.2431 and support at 0.2275. The recent close near 0.2418 indicates a strong battle near the upper resistance zone. A confirmed breakout above 0.2431 could pave the way for bullish continuation. However, failure to break through may trigger a pullback toward 0.2340 or even retest the 0.2275 support level.
📉 Trend Outlook & Next Moves:
A breakout above resistance may drive TRX toward higher price targets with strong bullish momentum.
Conversely, a breakdown below support could indicate a deeper correction ahead.
👉 Keep an eye on price reactions at these critical levels for confirmation of the next trend direction.

Flight wish for TRX currencyTRXUSDT – 4H Technical Analysis
TRON is showing signs of a potential bullish move on the 4-hour chart, with upside potential of around 2%, targeting the $0.25 resistance level.
Once this key resistance is tested, the analysis should be updated to reflect the next possible direction.
The main support level lies at $0.2428, which aligns with the bottom of the ascending channel and also acts as a static support zone in this timeframe.
🟢 Support: $0.2428 (channel support + static support)
🔴 Resistance: $0.25 (short-term target)

$TRX Coiling for Launch: Breakout Loading..TRX/USDT is ranging tightly between $0.22–$0.26, building pressure for a breakout. Price is still above the 100-day EMA, hinting at bullish bias. A confirmed breakout above $0.26 could fuel a rally toward;
$0.282, $0.32, $0.37, and $0.43 (+66%). However, losing the range support risks more sideways movement. Breakout or fakeout—watch volume closely!
#TRX #Crypto #Altcoins #Breakout #Trading #TechnicalAnalysis #CryptoTrading #Bullish #CryptoCharts

Tron Built a Fresh Down Trend!!!Hey Traders, in today's trading session we are monitoring TRX/USDT for a selling opportunity around 0.2530 zone, Tron is trading in a down trend and currently is in a correction phase in which iti s approaching the trend at 0.2530 support and resistance area.
Trade safe, Joe.
