TRX (Crypto TRON-USD) BUY TF H1 TP = 0.1354On the H1 chart the trend started on Aug. 05 (linear regression channel).
There is a high probability of profit taking. Possible take profit level is 0.1354
Using a trailing stop is also a good idea!
Please leave your feedback, your opinion. I am very interested in it. Thank you!
Good luck!
Regards, WeBelievelnTrading
TRXUSDT_1F7DF5 trade ideas

Crypto Overview: Technical Ratings of top 40 cryptosAfter screening the top 40 cryptocurrencies, it has become evident that TRXUSDT (TRON) outperforms and stands out as the only bullish coin in the current crypto market landscape. With its recent bullish signal on 7/22/2024 and if it remains its bullish rating, it's anticipated that TRON will probably lead the charge in the upcoming market uptrend.

Tron (TRX): Plan A or Plan B? Price At Strong ResistanceTron is in a strong zone where the price is on the verge of a breakout or breakdown.
We are now waiting for further confirmation of the scenario here so we keep monitoring the current zone where the price is!
Swallow Team

TRX trade setupTron (TRX) is one of my favourite coins which I choose to invest in.This is trade (investment) setup on larger timeframe. I am not looking to reach targets 2,3,4 and 5 very soon, that could be year(s). I will sell most of my capital on targets 3,4 and 5. Small portions will be sold on targets 1 and 2.
Entry Zone: 0.27 – 0.34
Buy Zone: 0.024 – 0.03
Target 1: 0.11 – 0.12 (102%)
Target 2: 0.14 – 0.14 (151%)
Target 3: 0.17 – 0.18 (211%)
Target 4: 0.24 – 0.25 (335%)
Target 5: 0.31– 0.32 (454%)

Tron (TRX) Chart Analysis — One Of The Most Exciting Charts!In this video, I deep dive into the Tron (TRX) chart. Starting on the 1D chart, we discover the incredible long-term uptrend Tron has been delivering. I discuss crucial levels and why Tron is an interesting investing opportunity.
Afterwards, we move one level lower and discuss short-term trade options on the 4H chart.
Would love to get your feedback and opinions. Share it in the comments!

TRX is in a dangerous placeThis analysis is an update of the analysis you see below in the "Related Ideas" section.
The triangle of the previous analysis is still standing and only the D wave has become more time-consuming.
We expect the formation of wave E from TRX.
It can be rejected from the supply range to the green box.
The targets are marked on the picture.
Closing a daily candle above the invalidation level will violate the analysis.
For risk management, please don't forget stop loss and capital management
When we reach the first target, save some profit and then change the stop to entry
Comment if you have any questions
Thank You

TRX. 0.12766. LONGThe token continues its confident upward movement. Excellent accumulative movement. Slight volatility. And emptiness lies ahead. Even though we only have a local level, this is a good point to enter into a continuation position.

Tron — Pumping Since 2022Among altcoins, Tron is definitely a rarity at the moment. While many other tokens are down 70%, 80%, or even 90% and trade close to their bear market low, Tron has constantly moved upwards since late 2022!
In fact, the token has been trading in a wonderful upward channel for more than two years! Even the latest market drop last Monday didn't force Tron to leave its path—it simply bounced from the bottom.
As a result, I expect Tron to move back to the channel top in the next days/weeks. Moreover, if the bullish momentum continues, we could see another breakout attempt—similar to the one in March.
However, even if this won't happen, Tron provides nice trading opportunities based on the channel.
Moreover, if we enter a bull run in late 2024 or 2025, Tron should be among the top tokens — at least based on its recent performance.

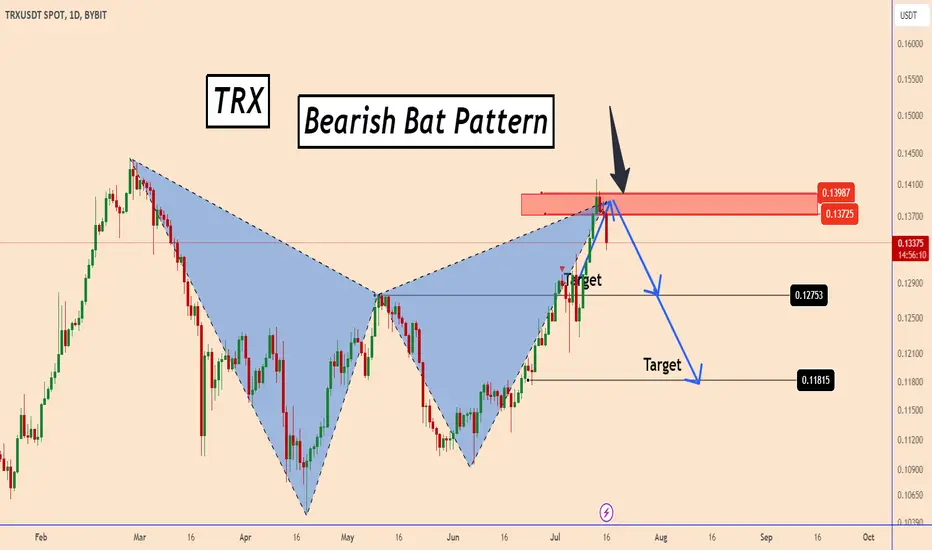
TRX : Harmonic Bat Pattern Completed - next move downTRX : Harmonic Bat Pattern Completed - next move down
In early July TRX was showing chances of completing a bearish harmonic pattern.
After the price completed the pattern of the bullish wave it was developing, the Harmonic pattern showed its power by creating the first signs of a reversal.
So far, the price development looks good. It may still have some ups and downs, but the direction should be down again.
We can see TRX moving down to 0.1180
Thank you and Good Luck!
Previous analysis:
TRXUSDT.PTRXUSDT.P is in bullish trend.
Potentially printing HH and HL.
No sign of reversal here buyers are strongly active.
We buy at CMP.

TRX - Slow and easy trade#TRX/USDT #Analysis
Description
---------------------------------------------------------------
+ Price has hit the support line and successfully bounced back from it with a long wick.
+ Overall trend is looking strong and we can expect the price to hit the next resistance line
---------------------------------------------------------------
VectorAlgo Trade Details
------------------------------
Entry Price: 0.1262
Stop Loss: 0.1156
------------------------------
Target 1: 0.1298
Target 2: 0.1333
Target 3: 0.1391
------------------------------
Timeframe:
Capital Risk: 1-2% of trading amount
Leverage: 5-10x
---------------------------------------------------------------
Enhance, Trade, Grow
---------------------------------------------------------------
Feel free to share your thoughts and insights.
Don't forget to like and follow us for more trading ideas and discussions.
Best Regards,
VectorAlgo

Lingrid | TRXUSDT level REJECTION. Opportunity to BUYThe price perfectly fulfilled my last idea. BINANCE:TRXUSDT has pulled back after forming a double top pattern. Recently, the market bounced off the 61.8% Fibonacci retracement level, indicating potential support. A rejection candle with a wick suggests that buyers are stepping in at this level. The area between 12 and 12.5 has been respected in the past, with multiple bounces occurring there. If we zoom out, it's clear that the price has been creating a triangle pattern, which indicates prolonged consolidation as it has struggled to break above its highs since February. The recent rebound from the bottom of the triangle suggests the possibility of a retest of the upper boundary of this pattern. This could lead to either a breakout to the upside or a continuation of the consolidation, depending on market sentiment. Observing how the price reacts at the triangle's upper resistance will be crucial for assessing the next move. My target is resistance zone at 0.1325
Traders, if you liked this idea or if you have your own opinion about it, write in the comments. I will be glad 👩💻

Tron (TRX): Possible Sell Off Incoming!Tron coin is showing us a similar pattern to form here, where after each sell, we had nice bullish momentum yet again followed by a sell-off.
So here we are seeing another bout of buying pressure and a slight sign of weakness as well, possibly starting another sell-off movement.
Swallow Team

Rebounding from the support levelTRON is currently rebounding from the support level, but the upcoming resistance levels could hinder further price growth. Examining these key levels can provide a better understanding of future market behavior.
Support Levels:
$0.1190 Level: This level acted as initial support and the price has rebounded from it.
$0.1120 Level: The second support level, acting as a stronger backup.
Resistance Levels:
$0.1260 Level: This level acts as the first resistance and might prevent further price growth.
$0.1300 Level: The second resistance level, breaking which could indicate a trend change.
$0.1370 Level: The final resistance level, reaching which could confirm a new upward trend.

Tron (TRX): Looking For Tron has had a nice rejection from the upper resistance zone, where we are now looking for further movement to the lower zones.
And as you all know, our favourite EMAs need to be broken in order for us to see the last contraction of downward movement so eyes open here!
Swallow Team

TRX Ticking time bombShorting TRX created a displacement along with breaking Market structure. Went back up into the OB and swept buy side liquidity. Expecting it to now fall to catch side liquidity

Tron (TRX): Back At Crucial Zone of 200EMATron is back at the crucial zone of 200EMA, where price has made a small breakdown here (now looking to secure this zone as well).
As it is a little early to consider it a good breakdown, we will be keeping an eye out for further confirmations here, and if we get one, we will be looking for a downward movement!
Swallow Team

TRXUSDT Idea longBINANCE:TRXUSDT
Bullish setup on a 1Day timeframe.
Going for a new higher high first target 0.1440 and the 2nd target is 0.1500.
NOT A FINANCIAL ADVISE DYOR

TRX/USDT Entry for Continuation?Here's my analysis on TRX/USDT:
TRX/USDT is looking very strong! I'm looking to enter a TRX/USDT trade if it hits the 40-EMA on the daily timeframe, as it has bounced off that zone several times before, with 0.164 as our target.

+12%+ TRON ideaWith demand growing, I can't help but think TRON is set to do at least another 12% increase, just a thought. DYOR

I Cannot Short This !!! situation+next targets.TRX is in an ascending triangle which means the price is about to do a good bullish movement. The price can increase as much as the measured price movement ( AB=CD ) .
broke out the Triangle on 1D timeframe.
Up we go📈
✨Traders, if you liked this idea or have your opinion on it, write in the comments, We will be glad.
_ _ _ _ __ _ _ _ _ _ _ _ _ _ _ _ _ _ _ _ _ _ _ _ _ _ _ _ _ _ _ _
✅Thank you, and for more ideas, hit ❤️Like❤️ and 🌟Follow🌟!
⚠️Things can change...
The markets are always changing and even with all these signals, the market changes tend to be strong and fast!!

spot TRXIn the crypto market, after each liquidity and receiving it
Spot buying becomes very important. You can buy in two stages of the current price and in the specified prices

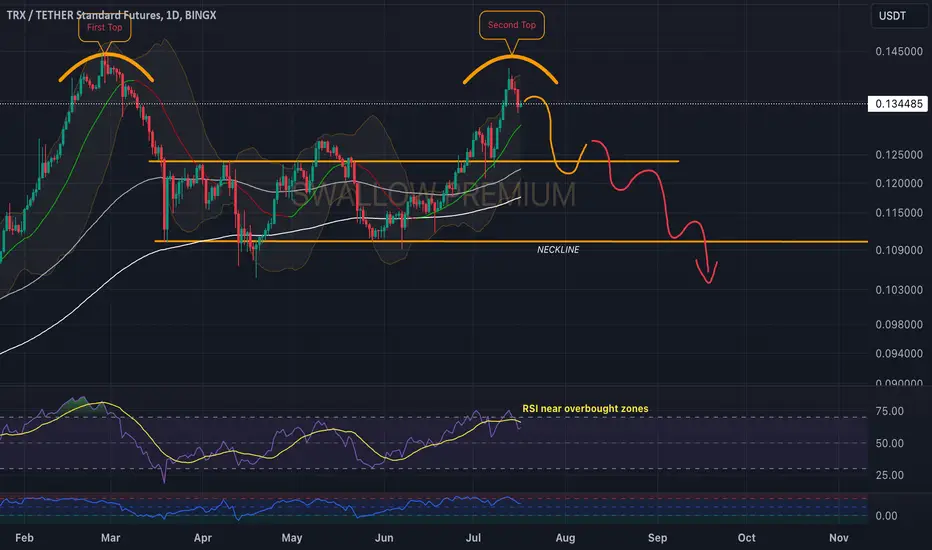
Tron (TRX): Possible Zone of Rejection!Tron might see some kind of downward movement here after getting that nice small rejection from the second top zone.
As of now, we are expecting a further movement to lower zones but we might see some struggle near 200 EMA (which has been a very strong trend holder so far), so keep an eye on that zone for sure!
Swallow Team