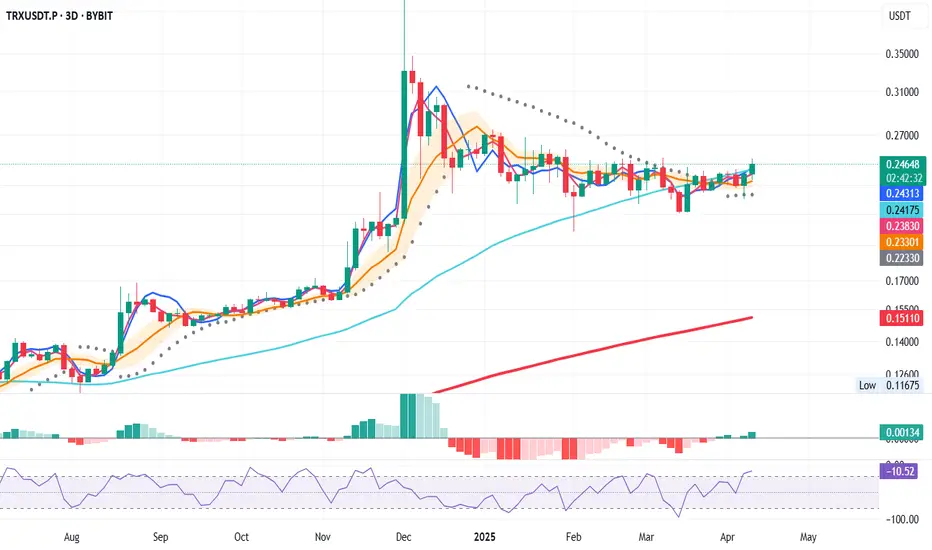
TRXUSDT – Bullish System Trigger (3D Chart)
📅 April 13, 2025
Today’s 3D bar close offers a strong bullish signal, aligning multiple system indicators in favor of a long entry.
Here’s what the system confirms:
✅ Price closed above the 50 MA – bullish structure
✅ MLR > SMA > BB Center – solid confluence
✅ Price > PSAR – trend shift confirmed
✅ Above the 200 MA – long-term trend support
Entry Strategy
- Open long at the 3D bar close
- Stop-loss below the latest PSAR dot for system integrity
📌 Note: This is a system-based entry — not a prediction.
TRXUSDT_A98D8A trade ideas
Lingrid | TRXUSDT short-term BULLISH move in CONSOLIDATION zoneThe price perfectly fulfilled my last idea . It reached the target level. BINANCE:TRXUSDT market is forming an ABC extension pattern and has established higher lows, while the highs remain relatively equal. Price continues to test the 0.2400 resistance zone, and I anticipate a potential breakthrough and close above this level. Recently, price broke above the previous week's high, suggesting it may either pull back or continue moving upward. However, I expect price to retest the support zone before resuming its upward trajectory. My target is resistance zone around 0.2500
Traders, if you liked this idea or if you have your own opinion about it, write in the comments. I will be glad 👩💻

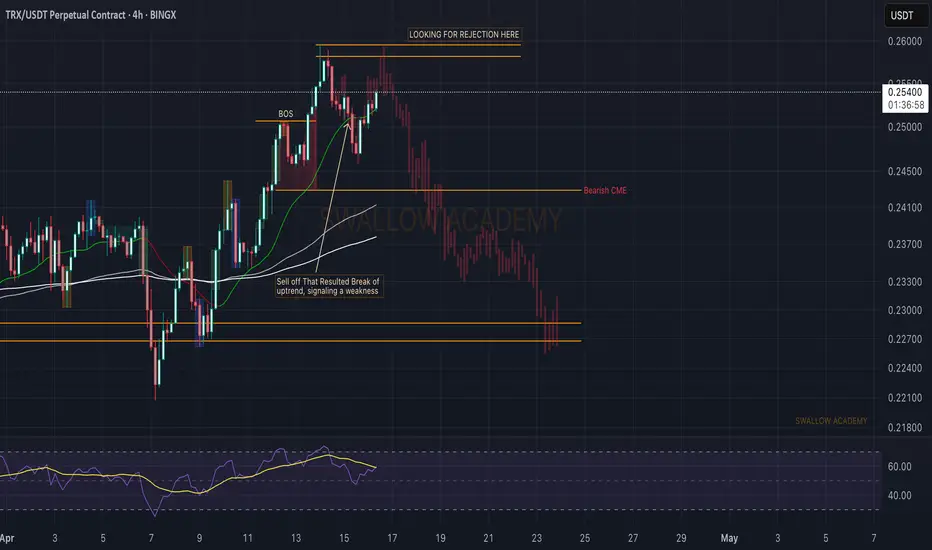
Tron (TRX): Bearish CME + Signs of WeaknessWe are seeing a possible downward movement to occur on Tron coin, where recently we have broken from that pattern of BOS on a bullish trend where we had a decent sell-off, which showed the dominance of sellers in that region.
As we are seeing a smaller bullish overtake now, we expect to see something like a "double top" pattern, where afterwards we want to see a break of the neckline/support, which then would result in a market structure break and give us a good entry for short.
Swallow Academy
Lingrid | TRXUSDT bullish STRUCTURE with Potential ENTRY Zone The price perfectly fulfilled my last idea . It hit the target level. BINANCE:TRXUSDT is showing a strong bullish momentum making higher lows and higher highs. On the daily timeframe, the market is rolling back after forming higher highs. There's a possibility that the price might pull back toward the support level, dipping below the psychological round number at 0.240. I think if the price rejects the upward trendline, weekly high and support level there is great chance of trend continuation. This correction might provide an opportunity for buyers to enter, with the potential for the price to retest the recent higher high level afterwards. 📈 Keep an eye on these key levels for optimal entry points. My goal is resistance zone around 0.2530
Traders, if you liked this idea or if you have your own opinion about it, write in the comments. I will be glad 👩💻

TRXUSDT Eyes Breakout Amid Bullish StructureThe TRXUSDT market appears to be forming an ABC extension pattern, characterized by a series of higher lows, while the highs remain relatively flat. The price has been consistently testing the 0.2400 resistance area, indicating the possibility of a breakout and a sustained move above this level. Recently, the price surpassed the previous week's high, which may signal either a short-term pullback or continued upward momentum. A retest of the support zone is anticipated before the market potentially resumes its upward trend. The next key resistance level is projected around the 0.2500 mark

TRX iHVF 12HTRX setting up for a iHVF to 0.1810. 8.5 RRR. Exit pump considering macro environment. Stop loss at assumed second impulse low (high). Target from first impulse draw brought to second impulse low (high), potential for over/under performance.

Tron (TRX): Broken Neckline | We Might See Sharp DropTron coin seems a good opportunity for a short here where we recently had a nice breakdown of the local neckline zone, then filled the FVGs on a smaller timeframe on the upper zones and now we are back below the neckline zone.
Perfect opportunity, as long as some surprise news will not come on markets 👀
Swallow Academy

TRXUSDT TRXUSDT Price Action Analysis (1H Timeframe)
🔹 Overall Trend: After a strong rally, the price is in a correction phase, currently trading at 0.2291. The key resistance at 0.2300 must be broken for a bullish continuation.
🔹 Bullish Scenario:
A breakout above 0.2300 with confirmation could push the price towards 0.2345 and 0.2435.
If this happens, the bearish structure will be invalidated, increasing bullish momentum.
🔹 Bearish Scenario:
Failure to break 0.2300 may lead to a pullback towards 0.2250 and 0.2205.
Losing 0.2205 could open the way for a deeper drop to 0.2160, a critical support zone.
🎯 Conclusion: Watch key levels closely; a confirmed breakout above 0.2300 signals a buy opportunity, while losing 0.2250 strengthens the bearish outlook.

Tron (TRX): Possible Smaller Correction To Lower Zones Tron coin has recently filled the bullish CME gap with a decent liquidity-hunting candle, where now we see the dominance is back in the hands of sellers.
We have put 2 points of interest zones for us where we will be looking for some kind of re-test to happen before another movement to upper zones.
Swallow Team

TRXUSDT (TRON) End of correction and Bullish Starting PointBased on the presented chart, it is observed that TRON is undergoing a corrective phase. This correction may extend to the level of 0.2421. It is anticipated that after reaching this level, a new upward trend in TRON's movement will commence

TRXUSDT TRON $TRX #bullish #breakingout #trend #longbaseIn a tough market after a sideways movement, it has broken out. If it kicks on from here, it will run to 0.30 imo. Time to add on and scale with conviction.

Tron (TRX): Possible Double Top Pattern FormingTron coin is approaching approachingthe neckline zone where recently we formed a second top, which gave us a sign of a potential upcoming "double top" pattern. We are waiting for a breakdown to happen.
As soon as we get the breakdown, we will be looking for a short position where we might catch a good R:R position.
Swallow Team

Be careful with TRX !!!As you can see, the price has now formed an ascending wedge , which is promising. The price could rise to $0.27 after breaking this wedge...
Give me some energy !!
✨We spend hours finding potential opportunities and writing useful ideas, we would be happy if you support us.
Best regards CobraVanguard.💚
_ _ _ _ __ _ _ _ _ _ _ _ _ _ _ _ _ _ _ _ _ _ _ _ _ _ _ _ _ _ _ _
✅Thank you, and for more ideas, hit ❤️Like❤️ and 🌟Follow🌟!
⚠️Things can change...
The markets are always changing and even with all these signals, the market changes tend to be strong and fast!!

Liquidity Grab Ahead? Why TRX (Tron) May Retrace Soon TRX (Tron) is currently trading near a significant resistance zone, aligning with the upper boundary of a descending channel on the 4-hour timeframe 📉. This area is likely to hold liquidity in the form of buy stops resting above the previous range highs. Given the broader downtrend and the strong resistance overhead, the price may retrace as it taps into this liquidity pool.
This setup presents a compelling short opportunity, with the expectation that TRX will reject this level and move lower, targeting support zones below. Traders should remain cautious and monitor price action closely for confirmation before entering a position ⚠️.
Disclaimer: This analysis is for informational purposes only and does not constitute financial advice. Cryptocurrency trading involves significant risk, and you should consult with a financial advisor before making any investment decisions. Always trade responsibly! 🚨

TRXUSDT Breakout detected, Accumulate!!Join our community and start your crypto journey today for:
In-depth market analysis
Accurate trade setups
Early access to trending altcoins
Life-changing profit potential
Let's analyze TRXUSDT:
TRX has broken out after prolonged consolidation, signaling strong potential. Fundamentally and technically, TRX appears robust. An ascending triangle breakout suggests bullish momentum. Accumulate TRX now to capitalize on this upward trend. This breakout indicates a significant price movement is likely.
Resistance zone: $0.2540- $0.2614
Target 1: $0.2735
Target 2: $0.3010
Target 3: $0.3391
If you find this analysis helpful, please hit the like button to support my content! Share your thoughts in the comments, and feel free to request any specific chart analysis you’d like to see.

TRXUSDT 1D LONG [UPdate]In line with the expectations I outlined in my main TRXUSDT 1D LONG review the price interacted perfectly with the key liquidity block and turned around confidently.
To feel safe in this position, I move the stop order to breakeven and continue to wait for my targets to be reached!
Targets:
$0.2509
$0.2580
$0.2679
$0.2815

TRXUSDT accumulation zone, support & resistance!!Join our community and start your crypto journey today for:
In-depth market analysis
Accurate trade setups
Early access to trending altcoins
Life-changing profit potential
Let's analyze TRXUSDT:
TRXUSDT is currently in a prolonged consolidation, mirroring a prior 80-day phase that triggered a 165% surge. After 100 days of similar accumulation, TRX is oscillating within a demand zone of $0.2106-$0.2218, facing resistance at $0.2540-$0.2614. A decisive break above this resistance could propel TRX towards higher targets, capitalizing on the extended accumulation period and historical breakout patterns.
Resistance zone: $0.2540- $0.2614
Accumulation zone: $0.2106-$0.2218
Target 1: $0.3010
Target 2: $0.3391
Long-term target: 80% -100%
If you find this analysis helpful, please hit the like button to support my content! Share your thoughts in the comments, and feel free to request any specific chart analysis you’d like to see.
Happy Trading!!

TRXUSDT NEXT MOVESell after bearish candle stick pattern, buy after bullish candle stick pattern....
Best bullish pattern , engulfing candle or green hammer
Best bearish pattern , engulfing candle or red shooting star
NOTE: IF YOU CAN'T SEE ANY OF TOP PATTERN IN THE ZONE DO NOT ENTER
Stop lost before pattern
R/R %1/%3
Trade in 5 Min Timeframe, use signals for scalping

TRX/USDT: Consolidation Holds with Upside PotentialThe TRX/USDT market recently saw a false breakout below a key support level, followed by a rebound toward the upper boundary of the channel. On the broader timeframe, the price has been in a two-month consolidation, forming a range near the 0.2200 support, which has held firm through multiple tests.
This consistent rebound highlights the significance of the 0.2200 level, suggesting it may continue to act as a launch point for upward movement. A retest of the trendline is possible, with potential for the price to approach the channel's upper boundary. The next target is the resistance zone at 0.2370

Lingrid | TRXUSDT sideways MARKET Movement. Long OpportunityThe price perfectly fulfilled my last idea . It reached the target level. BINANCE:TRXUSDT market recently made a fake break of the previous support level before bouncing back and reaching the upper boundary of the channel. When we zoom out, it's clear that the price has been consolidating for two months. Notably, the market has created a range zone at support level around 0.2200, with the price rebounding from this level multiple times, indicating its importance to the market. I think the price may move upward from this support, retest the trendline, and potentially approach the channel's upper boundary. My goal is resistance zone at 0.2370
Traders, If you liked this educational post🎓, give it a boost 🚀 and drop a comment 📣

How to Trade Descending Channels Like a Pro!
🚀 TRON (TRX) is stuck in a descending channel! But how can you trade this setup effectively? Let’s break it down:
📌 What is a Descending Channel?
A descending channel forms when price makes lower highs and lower lows, staying between two parallel trendlines. It shows a downtrend, but it also creates trading opportunities!
🔥 How to Trade It?
✅ Breakout Strategy: If price breaks above the channel and retests, it could signal a bullish move! (Potential target: $0.29)
✅ Breakdown Strategy: If price drops below the key level, it might dump to the next support ($0.19).
✅ Mid-Range Trades: You can short at resistance and long at support inside the channel – but only with strong confirmations!
💡 Pro Tip: Always wait for confirmation candles before entering a trade to avoid false breakouts!
📊 What do you think? Will TRX break out or dump? Comment below! 👇👇
🔄 Tag a trader who needs to learn this! 🚀 #CryptoEducation #TradingTips #TRX #TradingView
#Miracle #TradeWithMky #MegaAltseason 2025

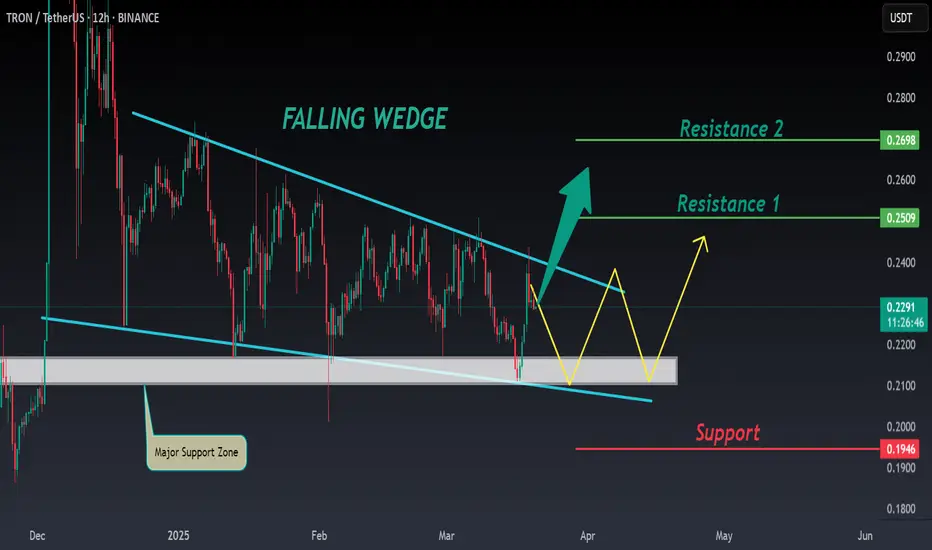
TRX ANALYSIS📊 #TRX Analysis
✅There is a formation of Falling Wedge Pattern on 12 hr chart and currently trading around its major support zone🧐
Pattern signals potential bullish movement incoming after a breakout
👀Current Price: $0.2290
🚀 Target Price: $0.2500
⚡️What to do ?
👀Keep an eye on #TRX price action and volume. We can trade according to the chart and make some profits⚡️⚡️
#TRX #Cryptocurrency #TechnicalAnalysis #DYOR
Trading opportunity for TRXUSDTBased on technical factors there is a Buy position in :
📊 TRXUSDT
🔵 Buy Now
🪫Stop loss 0.1850
🔋Target 0.3200
📏 R/R 2
💸RISK : 1%
We hope it is profitable for you ❤️
Please support our activity with your likes👍 and comments📝
