TRXUSDT Breakout detected, Accumulate!!Join our community and start your crypto journey today for:
In-depth market analysis
Accurate trade setups
Early access to trending altcoins
Life-changing profit potential
Let's analyze TRXUSDT:
TRX has broken out after prolonged consolidation, signaling strong potential. Fundamentally and technically, TRX appears robust. An ascending triangle breakout suggests bullish momentum. Accumulate TRX now to capitalize on this upward trend. This breakout indicates a significant price movement is likely.
Resistance zone: $0.2540- $0.2614
Target 1: $0.2735
Target 2: $0.3010
Target 3: $0.3391
If you find this analysis helpful, please hit the like button to support my content! Share your thoughts in the comments, and feel free to request any specific chart analysis you’d like to see.
TRXUSDT_A98D8A trade ideas

TRXUSDT 1D LONG [UPdate]In line with the expectations I outlined in my main TRXUSDT 1D LONG review the price interacted perfectly with the key liquidity block and turned around confidently.
To feel safe in this position, I move the stop order to breakeven and continue to wait for my targets to be reached!
Targets:
$0.2509
$0.2580
$0.2679
$0.2815

TRXUSDT accumulation zone, support & resistance!!Join our community and start your crypto journey today for:
In-depth market analysis
Accurate trade setups
Early access to trending altcoins
Life-changing profit potential
Let's analyze TRXUSDT:
TRXUSDT is currently in a prolonged consolidation, mirroring a prior 80-day phase that triggered a 165% surge. After 100 days of similar accumulation, TRX is oscillating within a demand zone of $0.2106-$0.2218, facing resistance at $0.2540-$0.2614. A decisive break above this resistance could propel TRX towards higher targets, capitalizing on the extended accumulation period and historical breakout patterns.
Resistance zone: $0.2540- $0.2614
Accumulation zone: $0.2106-$0.2218
Target 1: $0.3010
Target 2: $0.3391
Long-term target: 80% -100%
If you find this analysis helpful, please hit the like button to support my content! Share your thoughts in the comments, and feel free to request any specific chart analysis you’d like to see.
Happy Trading!!

TRXUSDT NEXT MOVESell after bearish candle stick pattern, buy after bullish candle stick pattern....
Best bullish pattern , engulfing candle or green hammer
Best bearish pattern , engulfing candle or red shooting star
NOTE: IF YOU CAN'T SEE ANY OF TOP PATTERN IN THE ZONE DO NOT ENTER
Stop lost before pattern
R/R %1/%3
Trade in 5 Min Timeframe, use signals for scalping

TRX/USDT: Consolidation Holds with Upside PotentialThe TRX/USDT market recently saw a false breakout below a key support level, followed by a rebound toward the upper boundary of the channel. On the broader timeframe, the price has been in a two-month consolidation, forming a range near the 0.2200 support, which has held firm through multiple tests.
This consistent rebound highlights the significance of the 0.2200 level, suggesting it may continue to act as a launch point for upward movement. A retest of the trendline is possible, with potential for the price to approach the channel's upper boundary. The next target is the resistance zone at 0.2370

Lingrid | TRXUSDT sideways MARKET Movement. Long OpportunityThe price perfectly fulfilled my last idea . It reached the target level. BINANCE:TRXUSDT market recently made a fake break of the previous support level before bouncing back and reaching the upper boundary of the channel. When we zoom out, it's clear that the price has been consolidating for two months. Notably, the market has created a range zone at support level around 0.2200, with the price rebounding from this level multiple times, indicating its importance to the market. I think the price may move upward from this support, retest the trendline, and potentially approach the channel's upper boundary. My goal is resistance zone at 0.2370
Traders, If you liked this educational post🎓, give it a boost 🚀 and drop a comment 📣

How to Trade Descending Channels Like a Pro!
🚀 TRON (TRX) is stuck in a descending channel! But how can you trade this setup effectively? Let’s break it down:
📌 What is a Descending Channel?
A descending channel forms when price makes lower highs and lower lows, staying between two parallel trendlines. It shows a downtrend, but it also creates trading opportunities!
🔥 How to Trade It?
✅ Breakout Strategy: If price breaks above the channel and retests, it could signal a bullish move! (Potential target: $0.29)
✅ Breakdown Strategy: If price drops below the key level, it might dump to the next support ($0.19).
✅ Mid-Range Trades: You can short at resistance and long at support inside the channel – but only with strong confirmations!
💡 Pro Tip: Always wait for confirmation candles before entering a trade to avoid false breakouts!
📊 What do you think? Will TRX break out or dump? Comment below! 👇👇
🔄 Tag a trader who needs to learn this! 🚀 #CryptoEducation #TradingTips #TRX #TradingView
#Miracle #TradeWithMky #MegaAltseason 2025

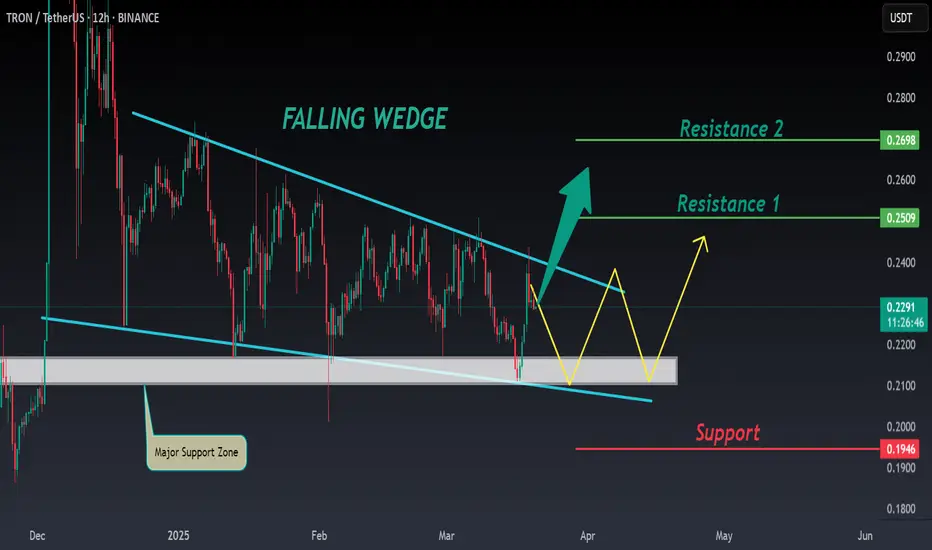
TRX ANALYSIS📊 #TRX Analysis
✅There is a formation of Falling Wedge Pattern on 12 hr chart and currently trading around its major support zone🧐
Pattern signals potential bullish movement incoming after a breakout
👀Current Price: $0.2290
🚀 Target Price: $0.2500
⚡️What to do ?
👀Keep an eye on #TRX price action and volume. We can trade according to the chart and make some profits⚡️⚡️
#TRX #Cryptocurrency #TechnicalAnalysis #DYOR
Trading opportunity for TRXUSDTBased on technical factors there is a Buy position in :
📊 TRXUSDT
🔵 Buy Now
🪫Stop loss 0.1850
🔋Target 0.3200
📏 R/R 2
💸RISK : 1%
We hope it is profitable for you ❤️
Please support our activity with your likes👍 and comments📝

TRXUSDT 1D LONGStudying the market, I have not traded much lately. Daily manipulation, as daily news very often breaks formations and trends within the day.
Therefore, I decided to look at 1D TF and I really liked the situation with TRX
Most likely, the price is in the final stage of reaccumulation before aggressive growth.
I am waiting for the testing of the bullish POI to start looking for an entry point into the position and work out such targets:
$0.2509
$0.2580
$0.2679
$0.2815
Risk for stop order -1%

TON the sell is not over. Keep in view $0.18TON the sell is not over. Keep in view $0.18
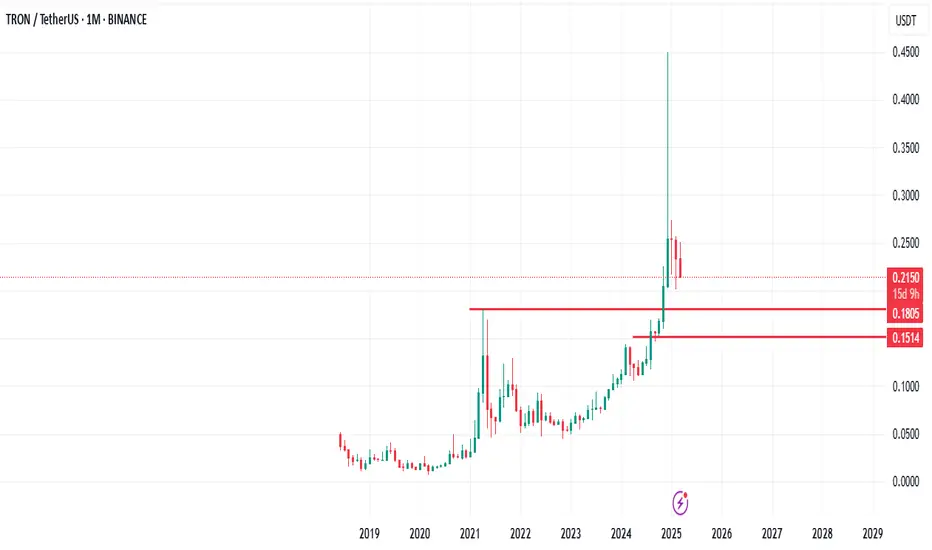
Have you bothered to look deep into TRX monthly chart?
I feel $0.18 is solid place for TRON to cool off its selling pressure long term.
I look forward to this shit happening for me to load my shopping cart
TRX - asset Punchingasset Punching a slant on a third touchdown.
the target after the breakthrough is the minimum (marked with a blue unit).
I suspect that bad news about this asset is coming.
if you like the idea, please "Like" it. This is the best "Thanks!" for the author 😊 P.S. Always do your own analysis before a trade. Put a stop loss. Fix profits in installments. Withdraw profits in fiat and please yourself and your friends.


Will Tron Correct 11% and Hit $0.20 Strong Support?Hello and greetings to all the crypto enthusiasts, ✌
Let’s dive into a full analysis of the upcoming price potential for Tron 🔍📈.
Tron is positioned within a parallel channel, nearing a key resistance level. Given its relative strength in the current market compared to other altcoins, I foresee a potential correction of up to 11%. This could lead the price to $0.20, a significant psychological support zone with strong technical backing.📚🙌
🧨 Our team's main opinion is:🧨
Tron is approaching key resistance, with an 11% drop likely to $0.20 support.📚🎇
Give me some energy !!
✨We invest hours crafting valuable ideas, and your support means everything—feel free to ask questions in the comments! 😊💬
Cheers, Mad Whale. 🐋

Lingrid | TRXUSDT Remains in a CONSOLIDATION PhaseAfter the recent sell-off, BINANCE:TRXUSDT market has been moving sideways within a downward channel. The price is consolidating below the key level of 0.25. Zooming out, we can observe that the price is forming a triangle pattern. I believe there is a possibility of a fake breakout at the channel boundary and resistance zone, which would likely lead to continued sideways movement. If a false breakout occurs at the resistance zone, I expect the price may move to lower levels, especially since this area coincides with the previous week’s highs from the last two weeks. My goal is support zone around 0.2250
Traders, if you liked this idea or if you have your own opinion about it, write in the comments. I will be glad 👩💻

Tron (TRX): Broken Triangle Channel, Sellers Taking OverTron coin has broken recently from an ascending triangle pattern, which is usually a bullish pattern but not for us.
Triangle pattern just gives you a warning of an upcoming volatile breakout or breakdown and we had one.
Now that the price has broken fully down, we are aiming to see even more fall to at least $0.215, where we might see some buying orders sitting at!
Swallow Team

Tron (TRX): This Coin Can Do Another 2X After A proper DumpExpecting to see a proper correction on the TRON coin where afterwards we want to see a new ATH to form, great potential for a coin that is currently sitting in the top 10 based on MC!
More in-depth info is in the video—enjoy!
Swallow Team

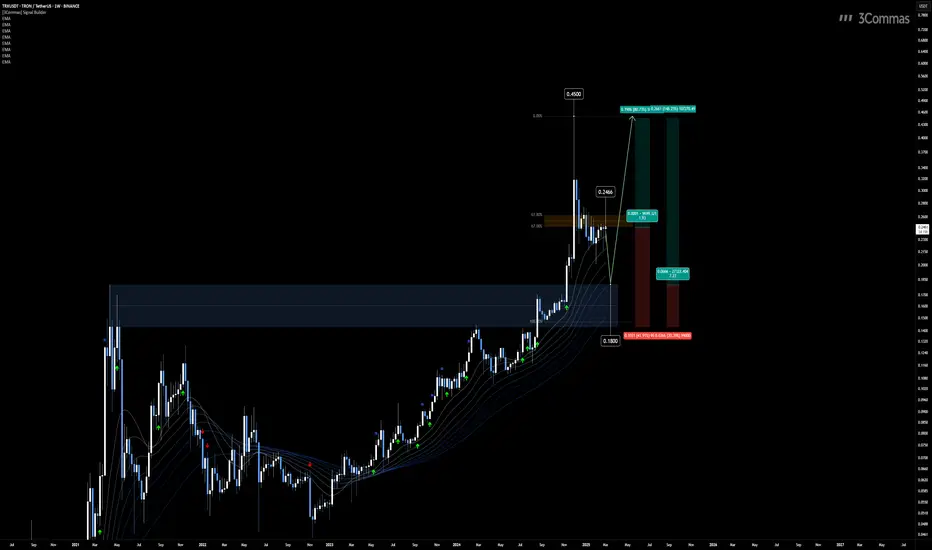
Will TRX Hold Above $0.2466 or Drop to $0.18 Before a Rally?
The BINANCE:TRXUSDT BINANCE:TRXUSD chart on the 1W timeframe maintains a bullish structure despite the recent retracement. The EMA ribbon remains upward-sloping, and the price is showing signs of rejection from this zone, reinforcing the broader uptrend.
Two potential entry zones stand out for a continuation to the upside. The first is $0.2466, aligning with the golden Fibonacci retracement zone, a key level where buyers may step in. The second is $0.18, a significant support level where the price previously broke through a major historical high. Both areas offer favorable setups targeting $0.45, the next major resistance level.
The market’s reaction at these key levels will determine the next move. A strong bounce could confirm a continuation toward $0.45, while a breakdown of these supports could shift the momentum.
👨🏻💻💭 Which entry do you favor? Will TRX hold above $0.2466 or revisit $0.18 before its next leg up? Let’s discuss your outlook!
__
The information and publications within the 3Commas TradingView account are not meant to be and do not constitute financial, investment, trading, or other types of advice or recommendations supplied or endorsed by 3Commas and any of the parties acting on behalf of 3Commas, including its employees, contractors, ambassadors, etc.
Tron coin shortI just now opened a short position on Tron. The market seems high and its at a resistance. Due for a correction and possibly a full blown reversal....today has been quite bullish but just going with the PA. I think its more probable to fall lower

TRX at the Edge: Bounce or Break?TRX is trading at 0.2256, presenting a mixed picture with both bullish and bearish signals. The 50-period moving average (MA) is above the 200-period MA, pointing to a longer-term uptrend, but the price is currently below both MAs, reflecting recent weakness. The Relative Strength Index (RSI) sits at 45, which is neutral territory, while the Moving Average Convergence Divergence (MACD) shows a bearish crossover, suggesting potential downward pressure. Key support levels are at 0.221 and 0.2141, with resistance at 0.232 and 0.240. The price is nearing the support at 0.221, which could trigger a bounce if it holds firm. A break below might see it drop to 0.2141, whereas a push above 0.232 could target 0.240. If TRX lingers between 0.221 and 0.232, it might consolidate until a decisive breakout occurs.
Looking at the broader market, Bitcoin’s current mixed signals could impact TRX, as it often follows Bitcoin’s lead. However, Tron’s growing network activity and adoption might offer some independent support, potentially softening the blow from any market-wide pullbacks. Volume remains steady for now, but a noticeable increase could signal the next move, keep an eye out for a surge on either a bounce from support or a breakdown below it.
For trading: Set alerts at 0.221 and 0.232 to track potential reversals or breakouts. It’s smart to wait for confirmation, like a 4H candle closing outside these levels, before jumping in. Given the market’s volatility, use stop-losses to manage risk, and stay tuned to Bitcoin’s price action and any Tron-related news, as these could steer TRX’s next steps.

TRXUSDT: Is a Major Sell-Off Incoming? Yello, Paradisers! Is #TRXUSDT about to face a sharp rejection? The price is struggling at a critical level and with buyers failing to push through, the risk of a deeper correction is growing fast. A breakdown below key support levels could trigger a much larger move downward.
💎The bullish momentum is fading, and a clear bearish shift is in play. The break of the ascending trendline combined with a probable rejection from the Bearish Order Block and Supply Zone at $0.2376 – $0.2425, reinforces strong downside momentum. TRX is now trading below both the 50 EMA and 200 EMA, further confirming a bearish outlook.
💎If sellers maintain control, #TRON could drop toward the $0.2160 demand zone as the next key support. A deeper correction could take the price to $0.2072, where strong buyers might attempt to step in.
💎Unless TRX breaks above $0.2490, the bearish continuation remains the dominant play. The recent candlestick action shows strong rejection from the imbalance zone,with long upper wicks a clear sign of aggressive selling pressure.
Bearish bias still in control! Be ready, Paradisers!
MyCryptoParadise
iFeel the success 🌴

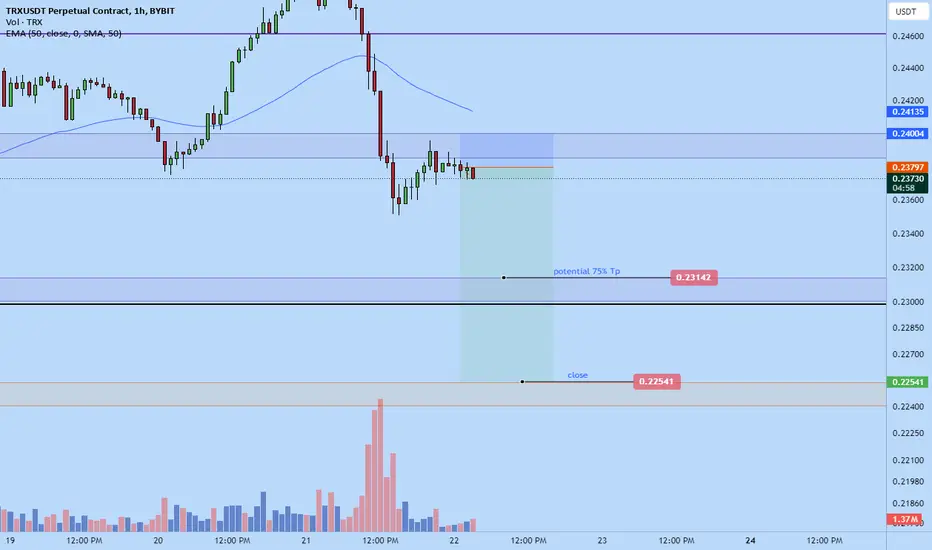
Tron short back to $0.23142Trx short.
Given trade plays out. Am looking to potentially take 75% profit at $0.23142 area. Right now am going o bed and I'll leave tp open just in case...I don't know...maybe we get a bigger than normal drop.
I don't think if big drop it will wick up fast as I anticipate if could fall all the way down to $0.2254 area so having tp open should be fine.
I think this trade has a very high probability to work out like 80-90% chance, just a matter of timing the entry.
LongAccording to the analysis of the waves and the help of the Gann method, it can be expected that the price will return to the green zone again.
This is my personal opinion. Please don't use it as your trading criteria. Good luck
