TRXUSDT #3 ( Ready to start big bullish rally ) Hello dear traders .
Good day .
TRXUSDT broken important monthly Gann Arc Resistance and after retest support will start bullish rally to about 0.1092 Price which is 0.5 fib level of monthly Gann Box resistance.
Good luck and safe trades .
Thanks for your support and comments .
TRXUSDT_A98D8A trade ideas

TRON swing trade longTron had one of the best relative strengths this year compared to the whole crypto market. Recently it broke the ascending channel and retested it within the same zone at a bigger Fibonacci level.
Here we can see the bigger picture at weekly timeframe.
A 2 RR is determined for the trade. Although it is near the resistance, but the support seems good enough to take the risk. Bitcoin is not showing any weakness either & US Bond market showed few big red candles last week too.
Take profit target can be extended with proper trailing stop loss.
Entry: 0.09921$
Stop Loss: 0.09660$
Take Profit: 0.10442$

TRX IF BREAK SUPPORTConsidering the strong growth of currencies yesterday, Yen 7 Shahrivar Tron was not exempted from this growth and was able to show a good reaction to the ceiling of its range and we witnessed the reverse in the same area.
On the price of 0.0777 dollars, which was a very important point in terms of price action, we saw how the price was returned until the price of 0.075 dollars, where we saw the range between these two ranges, and after crossing this range, the first price ceiling of 0.080 dollars and the higher ceiling, i.e. 0.083 dollars We can expect.
If we consider the break from the floor, which is more predictable, we can determine the price of $.0073 for Rios.

TRONUSDT (4H) - Bullish breakoutHi Traders
TRXUSDT (4H Timeframe)
The market is in an uptrend and we are waiting for an entry signal to go LONG above the 0.1012 resistance level. Only the downward break of 0.0958 would cancel the bullish scenario.
Trade details
Entry: 0.1012
Stop loss: 0.0958
Take profit 1: 0.1045
Take profit 2: 0.1098
Score: 7
Strategy: Bullish breakout

TRX/USDT Break the key level area. Rounding Bottom Confirmed!💎 TRX has undeniably made a significant impact on the market with its Rounding Bottom pattern and the successful breakthrough of a key supply zone, signaling a bullish momentum for TRX. However, it's worth noting that TRX has not yet undergone a retesting phase at the demand area, which was previously a supply zone.
💎 Due to this, there's a possibility that TRX will enter a retesting phase at around $0.91 to confirm the continuation of its upward movement. It's conceivable that after a valid retesting phase, we might witness a substantial bounce from the demand area, probability propelling TRX toward our target, the major supply area.
💎 Conversely, a less favorable scenario would materialize if TRX retests the demand area within the range of $0.91 to $0.885 and experiences a breakdown. In this scenario, TRX would transition back to a bearish trend, potentially resulting in a downward movement, with testing areas at $0.717 and even the formidable support area.

TRX is a Beast 🦾Hello TradingView Family / Fellow Traders. This is Richard, also known as theSignalyst.
📊 Unlike many altcoins exhibiting high volatility, TRX has demonstrated steady upward movement throughout the entire year.
This bullish trend is engulfed within the rising broadening wedge pattern outlined in orange, currently approaching the upper boundary marked by the orange trendline, serving as a non-horizontal resistance.
Additionally, the zone between 0.105 and 0.115 presents a robust resistance level.
📈 To maintain long-term control, the bulls must breach the 0.115 resistance.
If successful, a movement toward the subsequent resistance level at 0.14 can be anticipated.
📉 Conversely, as long as TRX trades below 0.115, there is potential for bears to instigate one more correction (confirmation needed on lower timeframes).
In such a scenario, we should be vigilant for trend-following buy setups as TRX approaches the lower boundary of the orange trendline.
📚 Always remember to follow your trading plan regarding entry, risk management, and trade management.
Good luck!
And always remember: All strategies are good if managed properly!
~Rich

Forecast for TRXHello everyone
The marked areas on the chart are important areas for trading and the probability of reaction is shown as a path.

TRX Crypto TRON Sell TP = 0.0959On the M30 chart the trend started on Nov. 2 (linear regression channel).
There is a high probability of profit taking. Possible take profit level is 0.0959
But we should not forget about SL = 0.10068
Using a trailing stop is also a good idea!
Please leave your feedback, your opinion. I am very interested in it. Thank you!
Good luck!
Regards, WeBelieveInTrading

Tron TVL Balloons To Over $15 Billion: DeFi Growth Evident?Tron TVL Balloons To Over $15 Billion: DeFi Growth Evident?

Small long or big long on TRX?Choose what you want... ether small long via stop-buy or big long later. Place both orders and wait

✴️ Tron Looking Really Good | Follow Me!Follow me into this analysis, another one that reveals what is coming to the Altcoins market.
You know the famous saying, "When life gives you lemons, trade Crypto".
Some charts need long, detailed explanations while others can be really short.
✔️ Tron is showing a very strong rising channel with a hidden bullish divergence signal and high rising volume... We don't need no more.
This clearly points to higher prices. The trading volume is just too strong to go into details.
Thanks a lot for your support.
Namaste.

TRON ($TRX) What is Next After The SurgeUnlike the majority of altcoins, TRX began its upward trend even before Bitcoin surpassed its annual high. Currently, TRX is trading at around $0.094, marking the asset's highest price point in the last two years.
Given the ongoing positive dynamics of BTC, a continuation of this growth trend is anticipated. The last time Tron reached these heights was two years ago, rendering the old resistance levels irrelevant. After surpassing the resistance zone of $0.093-$0.094, potential next targets for buyers could be the $0.097 mark and the psychological level of $0.1.
In the event of a correction, the TRX price could fall to $0.091 and enter the buyer's zone between $0.0890-$0.0905. Below that, the support level at $0.0885 could also be tested, without posing a threat to the prevailing uptrend.

TRXUSDT Support and resistance levelsHello friends,
In the case of Tron, these ranges seem to have reaction potential.
Let's see the resistance we are facing now will be broken and we will go to the next resistance or return to the specified support range.
what is your opinion?
Good luck.
# Let's look simply

TRXUSDT Limit Long is about to TriggerTRXUSDT is clearly one of the strongest coins in the recent months. It has established a clear long-term uptrend, where the resistance has flipped into the support.
We have placed a limit order to go long on the Tron, and we expect quite a strong uptrend to start this week.

Tron in 4 hour analysis, if we still bullish on bitcoinIf the bitcoin keep run with the actual buyers momentum, we will se Tron below 0.1 dollars

TRX short positionyou can setup short position on TRX/USDT
OPEN: 0.08957
Target: 0.08880
LEV: 15X to 35X
Capital: 30% off all capital
OK?

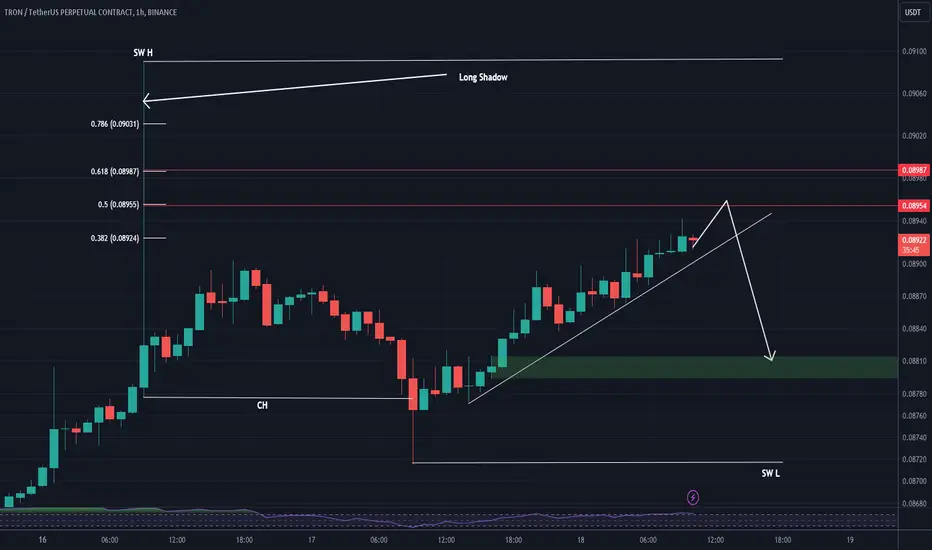
TRX can have a crash (has an educational point)TRX can have a crash
There is an educational tip here, pay close attention:
Educational tip: When we have long shoadow, the price tends to fill 50-60% of these shodows and then continue in the opposite direction. If a CH is in the opposite direction of the long shadow, we have more confirmation.
If more than 70% of the log is filled, it is possible to pass the log.
TRXTRX shows a bullish movement on the higher timeframe, that's why I am only looking for a long position. In this case, I am looking forward to move price like this BUT still a good bullish engulfing candle, then I will go for a limit order.

TRX (Crypto TRON ) Buy TF H1 TP = 0.0876On the H1 chart the trend started on October 13 (linear regression channel).
There is a high probability of profit taking. Possible take profit level is 0.0876
But we should not forget about SL = 0.0845
Using a trailing stop is also a good idea!
Please leave your feedback, your opinion. I am very interested in it. Thank you!
Good luck!
Regards, WeBelieveInTrading

Trxusdt with good setupRisk management is key book your profits when you making 1:3 and tn let it run for tp

TRXUSDTTRXUSDT is trading under the declining in descending parallel channel and break through Support and closed below this zone. now the price perfectly retest of broken level
Will the sellers attack again and send the price to 0.0830 level?
What you guys think of this idea ?

TRXUSDTHello snipers, nothing is impossible. In the one-day time frame, after hitting the upper line of the ascending channel, the price will decline to the bottom of the channel, in between there is a 103-day moving average that can provide good support and reverse the trend. All analyzes are only possibilities.

TRX: A bearish wave has already been confirmedTRX: A bearish wave has already been confirmed
During these days the price was moving down with very low volume and we can
see the final pattern was a type of triangle that was losing volume.
We have a minimum confirmation and this can push the price down this time.
Considering also the TRX price position it can be also an aggressive move as well.
Targets:
🎯 0.08300
🎯 0.08050
You may find more details on the chart!
Thank you and Good Luck!
